
|
|||||
|
 | |
| |
| |
| |
| |
| |
|
Gene: SLC51A |
Gene summary for SLC51A |
| Gene information | Species | Human | Gene symbol | SLC51A | Gene ID | 200931 |
| Gene name | solute carrier family 51 subunit alpha | |
| Gene Alias | OSTA | |
| Cytomap | 3q29 | |
| Gene Type | protein-coding | GO ID | GO:0006810 | UniProtAcc | Q86UW1 |
Top |
Malignant transformation analysis |
| Identification of the aberrant gene expression in precancerous and cancerous lesions by comparing the gene expression of stem-like cells in diseased tissues with normal stem cells |
| Entrez ID | Symbol | Replicates | Species | Organ | Tissue | Adj P-value | Log2FC | Malignancy |
| 200931 | SLC51A | HTA11_83_2000001011 | Human | Colorectum | SER | 1.51e-03 | 4.36e-01 | -0.1526 |
| 200931 | SLC51A | LZE5T | Human | Esophagus | ESCC | 1.15e-08 | 4.66e-01 | 0.0514 |
| 200931 | SLC51A | LZE7T | Human | Esophagus | ESCC | 3.98e-06 | 3.51e-01 | 0.0667 |
| 200931 | SLC51A | LZE20T | Human | Esophagus | ESCC | 1.26e-02 | 1.75e-01 | 0.0662 |
| 200931 | SLC51A | P1T-E | Human | Esophagus | ESCC | 2.97e-02 | 1.84e-01 | 0.0875 |
| 200931 | SLC51A | P2T-E | Human | Esophagus | ESCC | 7.98e-13 | 3.07e-01 | 0.1177 |
| 200931 | SLC51A | P8T-E | Human | Esophagus | ESCC | 7.28e-26 | 5.64e-01 | 0.0889 |
| 200931 | SLC51A | P15T-E | Human | Esophagus | ESCC | 5.26e-03 | 1.23e-01 | 0.1149 |
| 200931 | SLC51A | P23T-E | Human | Esophagus | ESCC | 2.33e-14 | 5.15e-01 | 0.108 |
| 200931 | SLC51A | P24T-E | Human | Esophagus | ESCC | 9.44e-07 | 1.82e-01 | 0.1287 |
| 200931 | SLC51A | P36T-E | Human | Esophagus | ESCC | 1.55e-04 | 3.20e-01 | 0.1187 |
| 200931 | SLC51A | P54T-E | Human | Esophagus | ESCC | 1.94e-28 | 5.92e-01 | 0.0975 |
| 200931 | SLC51A | P74T-E | Human | Esophagus | ESCC | 6.89e-16 | 4.26e-01 | 0.1479 |
| 200931 | SLC51A | P75T-E | Human | Esophagus | ESCC | 7.31e-14 | 2.78e-01 | 0.1125 |
| 200931 | SLC51A | P82T-E | Human | Esophagus | ESCC | 4.14e-03 | 2.63e-01 | 0.1072 |
| 200931 | SLC51A | P127T-E | Human | Esophagus | ESCC | 7.38e-03 | 1.03e-01 | 0.0826 |
| 200931 | SLC51A | P128T-E | Human | Esophagus | ESCC | 3.95e-29 | 1.08e+00 | 0.1241 |
| 200931 | SLC51A | P130T-E | Human | Esophagus | ESCC | 1.66e-02 | 1.05e-01 | 0.1676 |
| Page: 1 |
| Tissue | Expression Dynamics | Abbreviation |
| Colorectum (GSE201348) | 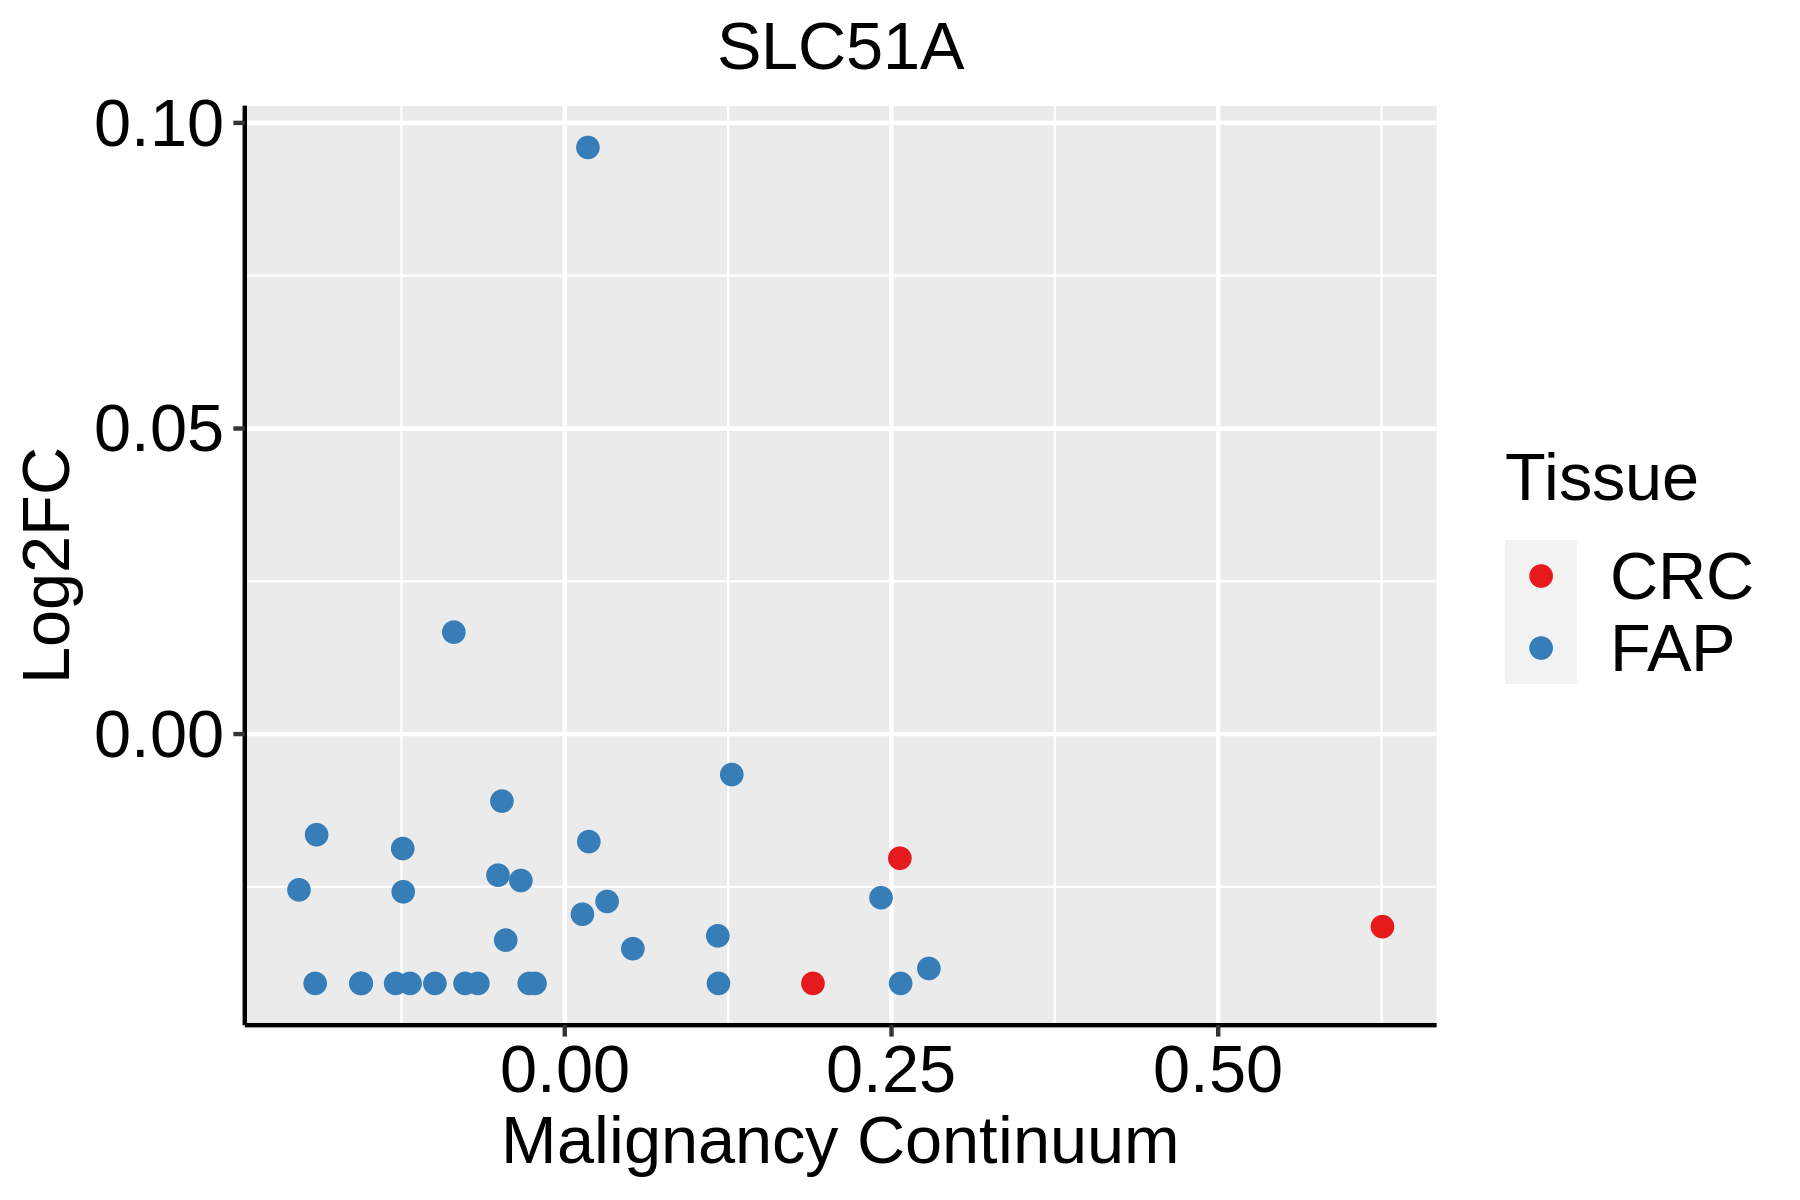 | FAP: Familial adenomatous polyposis |
| CRC: Colorectal cancer | ||
| Colorectum (HTA11) |  | AD: Adenomas |
| SER: Sessile serrated lesions | ||
| MSI-H: Microsatellite-high colorectal cancer | ||
| MSS: Microsatellite stable colorectal cancer | ||
| Esophagus | 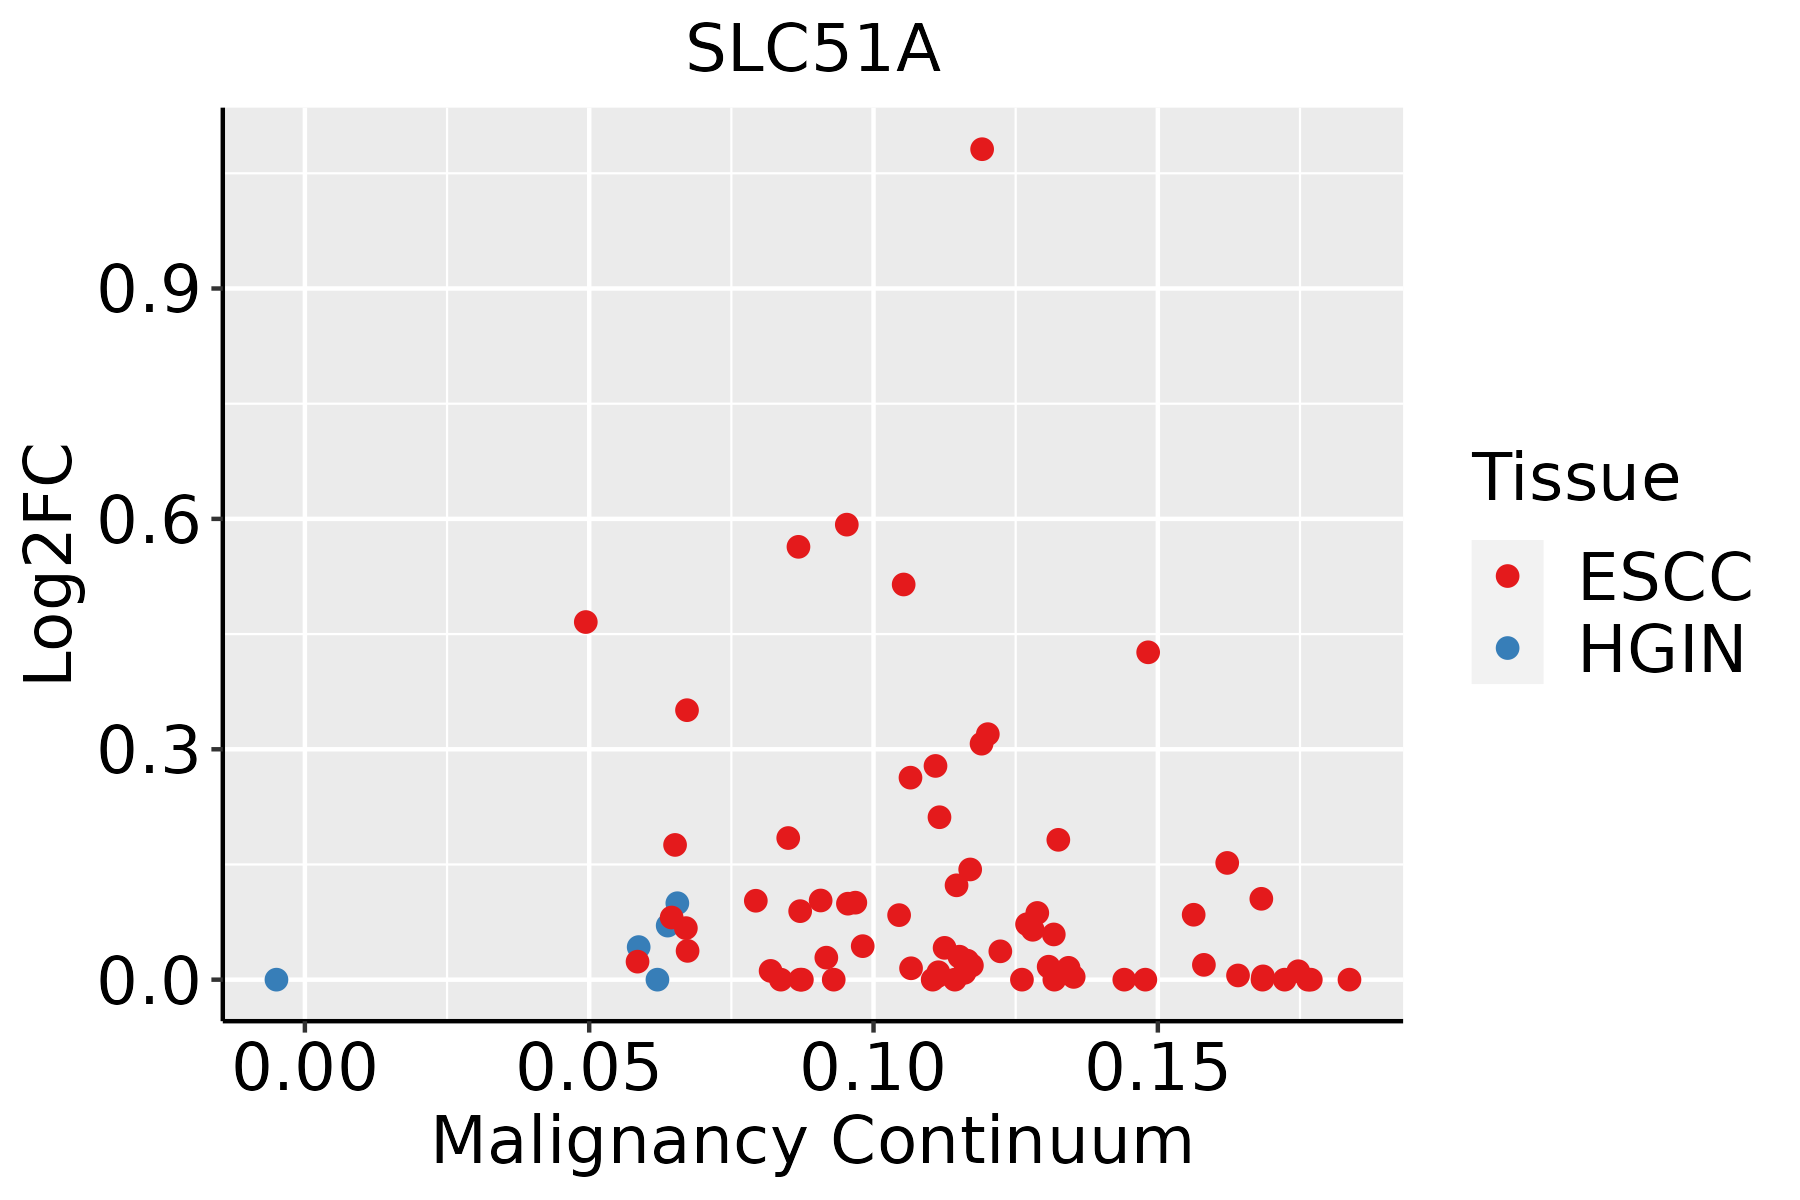 | ESCC: Esophageal squamous cell carcinoma |
| HGIN: High-grade intraepithelial neoplasias | ||
| LGIN: Low-grade intraepithelial neoplasias |
| ∗log2FC in expression of this searched gene in stem-like cells from each diseased tissue sample relative to stem-like cells in normal samples in each tissue plotted against the malignancy continuum. Samples are colored based on if they are from different disease stage. |
Top |
Malignant transformation related pathway analysis |
| Find out the enriched GO biological processes and KEGG pathways involved in transition from healthy to precancer to cancer |
| Tissue | Disease Stage | Enriched GO biological Processes |
| Colorectum | AD |  |
| Colorectum | SER |  |
| Colorectum | MSS |  |
| Colorectum | MSI-H |  |
| Colorectum | FAP |  |
| ∗Top 15 enriched GO BP terms are showed in the bar plot of each disease state in each tissue. Each row represents a significant GO biological process which is colored according to the -log10(p.adjust). |
| Page: 1 2 3 4 5 6 7 8 9 |
| GO ID | Tissue | Disease Stage | Description | Gene Ratio | Bg Ratio | pvalue | p.adjust | Count |
| Page: 1 |
| Pathway ID | Tissue | Disease Stage | Description | Gene Ratio | Bg Ratio | pvalue | p.adjust | qvalue | Count |
| Page: 1 |
Top |
Cell-cell communication analysis |
| Identification of potential cell-cell interactions between two cell types and their ligand-receptor pairs for different disease states |
| Ligand | Receptor | LRpair | Pathway | Tissue | Disease Stage |
| Page: 1 |
Top |
Single-cell gene regulatory network inference analysis |
| Find out the significant the regulons (TFs) and the target genes of each regulon across cell types for different disease states |
| TF | Cell Type | Tissue | Disease Stage | Target Gene | RSS | Regulon Activity |
| ∗The dot plots of a searched regulon are shown for all cell subpopulations in each disease state of each tissue based on the regulon specific score inferred using pySCENIC and by calculating the average expression. |
| Page: 1 |
Top |
Somatic mutation of malignant transformation related genes |
| Annotation of somatic variants for genes involved in malignant transformation |
| Hugo Symbol | Variant Class | Variant Classification | dbSNP RS | HGVSc | HGVSp | HGVSp Short | SWISSPROT | BIOTYPE | SIFT | PolyPhen | Tumor Sample Barcode | Tissue | Histology | Sex | Age | Stage | Therapy Types | Drugs | Outcome |
| SLC51A | SNV | Missense_Mutation | c.208N>C | p.Glu70Gln | p.E70Q | Q86UW1 | protein_coding | deleterious(0.02) | possibly_damaging(0.69) | TCGA-AC-A23H-01 | Breast | breast invasive carcinoma | Female | >=65 | I/II | Unknown | Unknown | PD | |
| SLC51A | SNV | Missense_Mutation | novel | c.270G>T | p.Trp90Cys | p.W90C | Q86UW1 | protein_coding | deleterious(0) | probably_damaging(0.998) | TCGA-EW-A6SD-01 | Breast | breast invasive carcinoma | Female | <65 | I/II | Chemotherapy | tch | SD |
| SLC51A | deletion | Frame_Shift_Del | novel | c.551_579delNNNNNNNNNNNNNNNNNNNNNNNNNNNNN | p.Phe185AspfsTer14 | p.F185Dfs*14 | Q86UW1 | protein_coding | TCGA-E2-A14N-01 | Breast | breast invasive carcinoma | Female | <65 | I/II | Chemotherapy | cyclophosphamide | SD | ||
| SLC51A | deletion | Frame_Shift_Del | novel | c.731delN | p.Arg244SerfsTer22 | p.R244Sfs*22 | Q86UW1 | protein_coding | TCGA-EW-A2FV-01 | Breast | breast invasive carcinoma | Female | <65 | III/IV | Chemotherapy | docetaxel | SD | ||
| SLC51A | SNV | Missense_Mutation | rs770488941 | c.134C>T | p.Ala45Val | p.A45V | Q86UW1 | protein_coding | tolerated(0.24) | benign(0.001) | TCGA-2W-A8YY-01 | Cervix | cervical & endocervical cancer | Female | <65 | I/II | Chemotherapy | cisplatin | CR |
| SLC51A | SNV | Missense_Mutation | c.970G>A | p.Val324Ile | p.V324I | Q86UW1 | protein_coding | tolerated(0.53) | benign(0) | TCGA-AA-3713-01 | Colorectum | colon adenocarcinoma | Male | >=65 | III/IV | Chemotherapy | 5-fluorouracil | PR | |
| SLC51A | SNV | Missense_Mutation | c.91N>A | p.Ala31Thr | p.A31T | Q86UW1 | protein_coding | deleterious(0.04) | benign(0.181) | TCGA-CK-5913-01 | Colorectum | colon adenocarcinoma | Female | <65 | I/II | Unknown | Unknown | SD | |
| SLC51A | SNV | Missense_Mutation | rs749146130 | c.953N>A | p.Arg318Gln | p.R318Q | Q86UW1 | protein_coding | deleterious(0) | probably_damaging(0.958) | TCGA-AG-A002-01 | Colorectum | rectum adenocarcinoma | Male | <65 | I/II | Unknown | Unknown | SD |
| SLC51A | SNV | Missense_Mutation | novel | c.529N>A | p.Leu177Ile | p.L177I | Q86UW1 | protein_coding | deleterious(0) | possibly_damaging(0.883) | TCGA-A5-A0G1-01 | Endometrium | uterine corpus endometrioid carcinoma | Female | >=65 | I/II | Unknown | Unknown | SD |
| SLC51A | SNV | Missense_Mutation | novel | c.881N>A | p.Ser294Tyr | p.S294Y | Q86UW1 | protein_coding | deleterious(0.01) | probably_damaging(0.989) | TCGA-A5-A2K5-01 | Endometrium | uterine corpus endometrioid carcinoma | Female | >=65 | I/II | Unknown | Unknown | SD |
| Page: 1 2 3 4 |
Top |
Related drugs of malignant transformation related genes |
| Identification of chemicals and drugs interact with genes involved in malignant transfromation |
| (DGIdb 4.0) |
| Entrez ID | Symbol | Category | Interaction Types | Drug Claim Name | Drug Name | PMIDs |
| Page: 1 |

Copyright 2023-Present -The University of Texas Health Science Center at Houston |