Schematic overview of the cellular and molecular mechanisms involved in the cancer progression, including the proposed cellular and molecular mechanisms in cancer cells trajectory. AT1: alveolar type 1 cells; AT2: alveolar type 2 cells; AAH: atypical adenomatous hyperplasia; AIS: adenocarcinoma in situ; MIA: minimally invasive adenocarcinoma; IA: invasive adenocarcinoma; EMT: epithelial-mesenchymal transition

Home

Download

Statistics

Help

Contact

Center for Computational Systems Medicine
leaf

Gene summary

leaf

Malignant transformation analysis

leaf

Malignant transformation related pathway analysis

leaf

Cell-cell communication analysis

leaf

Single-cell gene regulatory network inference analysis

leaf

Somatic mutation of malignant transformation related genes

leaf

Related drugs of malignant transformation related genes

Gene: SLC4A7

Gene summary for SLC4A7

check button Gene summary.

Gene informationSpeciesHuman
Gene symbol

SLC4A7

Gene ID

9497

Gene namesolute carrier family 4 member 7
Gene AliasNBC2
Cytomap3p24.1
Gene Typeprotein-coding
GO ID

GO:0002064

UniProtAcc

Q9Y6M7


Top

Malignant transformation analysis

check button Identification of the aberrant gene expression in precancerous and cancerous lesions by comparing the gene expression of stem-like cells in diseased tissues with normal stem cells
check button Malignant transformation involving gene list.
Entrez IDSymbolReplicatesSpeciesOrganTissueAdj P-valueLog2FCMalignancy
9497SLC4A7HTA11_3410_2000001011HumanColorectumAD6.31e-06-4.42e-010.0155
9497SLC4A7HTA11_3361_2000001011HumanColorectumAD2.44e-02-4.94e-01-0.1207
9497SLC4A7HTA11_696_2000001011HumanColorectumAD9.53e-03-3.23e-01-0.1464
9497SLC4A7HTA11_866_2000001011HumanColorectumAD1.58e-04-3.64e-01-0.1001
9497SLC4A7HTA11_5212_2000001011HumanColorectumAD6.66e-03-5.81e-01-0.2061
9497SLC4A7HTA11_7862_2000001011HumanColorectumAD4.10e-02-5.60e-01-0.0179
9497SLC4A7HTA11_866_3004761011HumanColorectumAD1.66e-04-4.45e-010.096
9497SLC4A7HTA11_7696_3000711011HumanColorectumAD5.19e-03-3.40e-010.0674
9497SLC4A7HTA11_99999970781_79442HumanColorectumMSS7.14e-05-3.27e-010.294
9497SLC4A7HTA11_99999974143_84620HumanColorectumMSS1.55e-05-3.10e-010.3005
9497SLC4A7A015-C-203HumanColorectumFAP4.41e-14-1.28e-01-0.1294
9497SLC4A7A002-C-201HumanColorectumFAP5.58e-03-1.32e-010.0324
9497SLC4A7A001-C-108HumanColorectumFAP1.58e-05-1.16e-03-0.0272
9497SLC4A7A002-C-205HumanColorectumFAP1.80e-08-6.42e-02-0.1236
9497SLC4A7A015-C-006HumanColorectumFAP1.21e-071.30e-01-0.0994
9497SLC4A7A015-C-106HumanColorectumFAP3.09e-03-2.08e-01-0.0511
9497SLC4A7A002-C-114HumanColorectumFAP8.13e-07-2.09e-01-0.1561
9497SLC4A7A015-C-104HumanColorectumFAP1.14e-14-5.24e-02-0.1899
9497SLC4A7A001-C-014HumanColorectumFAP1.97e-05-2.92e-020.0135
9497SLC4A7A002-C-016HumanColorectumFAP5.34e-07-1.92e-010.0521
Page: 1 2 3 4 5 6 7 8 

check button Transcriptomic changes along malignancy continuum.
TissueExpression DynamicsAbbreviation
Colorectum (GSE201348)The image shows the transcriptomic changes along malignancy continuum.log2FC in expression of this searched gene in stem-like cells from each diseased tissue sample relative to stem-like cells in normal samples in each tissue plotted against the malignancy continuum. Samples are colored based on if they are from different disease stage.FAP: Familial adenomatous polyposis
CRC: Colorectal cancer
Colorectum (HTA11)The image shows the transcriptomic changes along malignancy continuum.log2FC in expression of this searched gene in stem-like cells from each diseased tissue sample relative to stem-like cells in normal samples in each tissue plotted against the malignancy continuum. Samples are colored based on if they are from different disease stage.AD: Adenomas
SER: Sessile serrated lesions
MSI-H: Microsatellite-high colorectal cancer
MSS: Microsatellite stable colorectal cancer
EndometriumThe image shows the transcriptomic changes along malignancy continuum.log2FC in expression of this searched gene in stem-like cells from each diseased tissue sample relative to stem-like cells in normal samples in each tissue plotted against the malignancy continuum. Samples are colored based on if they are from different disease stage.AEH: Atypical endometrial hyperplasia
EEC: Endometrioid Cancer
EsophagusThe image shows the transcriptomic changes along malignancy continuum.log2FC in expression of this searched gene in stem-like cells from each diseased tissue sample relative to stem-like cells in normal samples in each tissue plotted against the malignancy continuum. Samples are colored based on if they are from different disease stage.
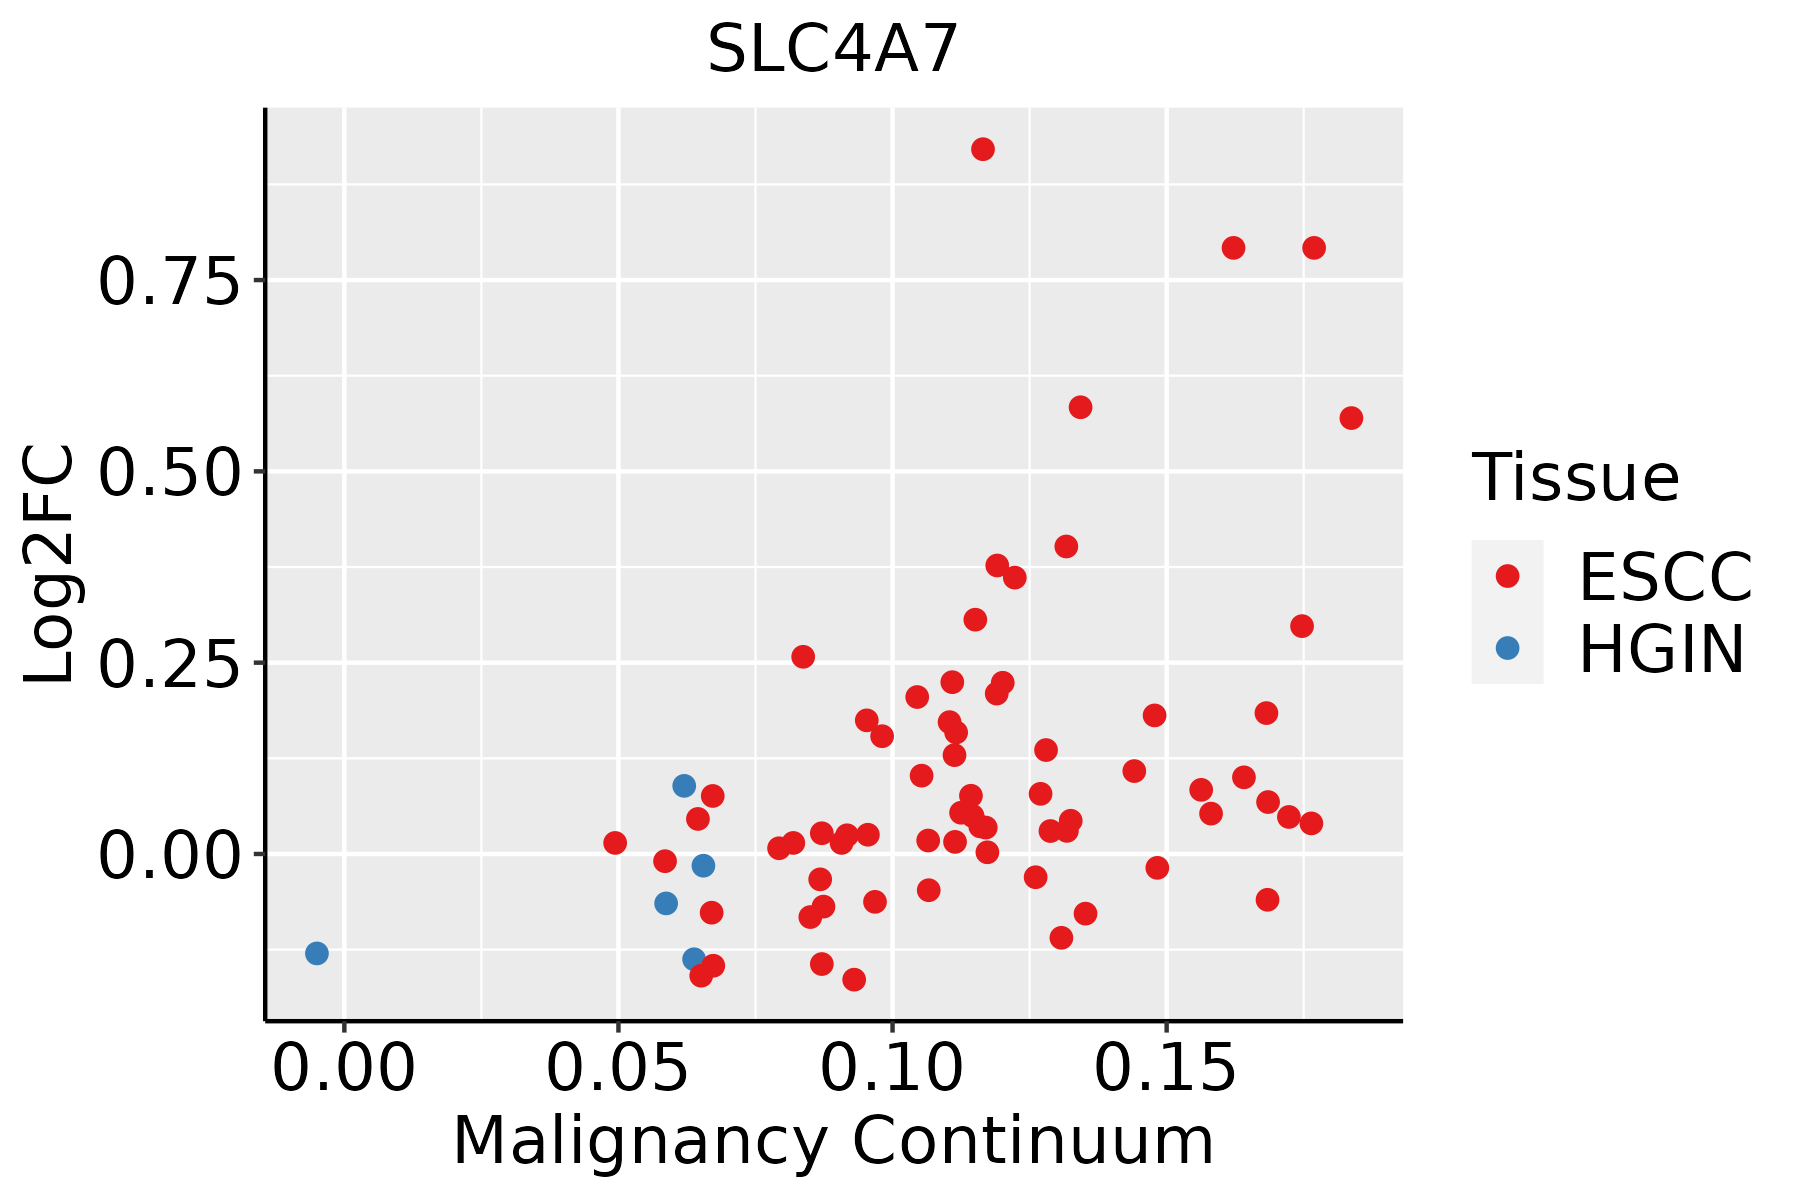
ESCC: Esophageal squamous cell carcinoma
HGIN: High-grade intraepithelial neoplasias
LGIN: Low-grade intraepithelial neoplasias
GCThe image shows the transcriptomic changes along malignancy continuum.log2FC in expression of this searched gene in stem-like cells from each diseased tissue sample relative to stem-like cells in normal samples in each tissue plotted against the malignancy continuum. Samples are colored based on if they are from different disease stage.
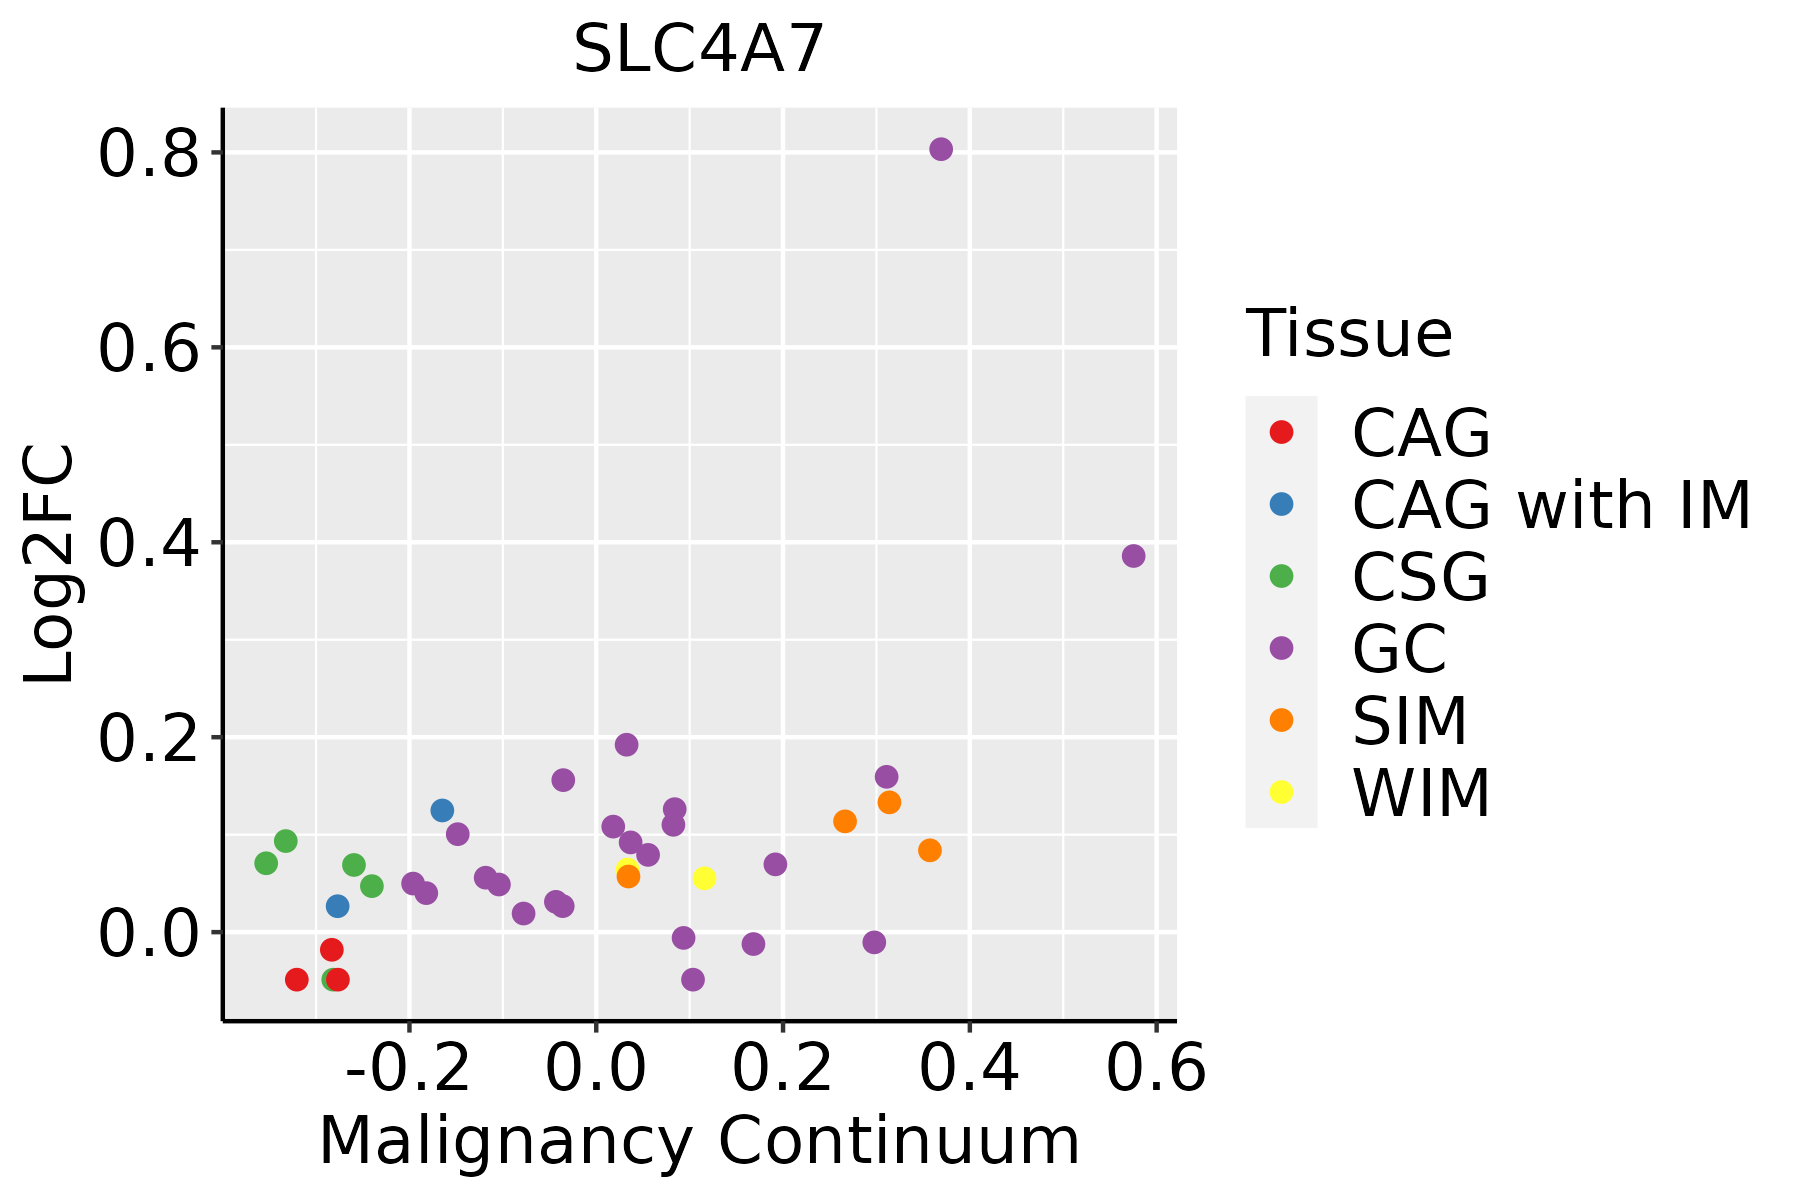
CAG: Chronic atrophic gastritis
CAG with IM: Chronic atrophic gastritis with intestinal metaplasia
CSG: Chronic superficial gastritis
GC: Gastric cancer
SIM: Severe intestinal metaplasia
WIM: Wild intestinal metaplasia
LiverThe image shows the transcriptomic changes along malignancy continuum.log2FC in expression of this searched gene in stem-like cells from each diseased tissue sample relative to stem-like cells in normal samples in each tissue plotted against the malignancy continuum. Samples are colored based on if they are from different disease stage.
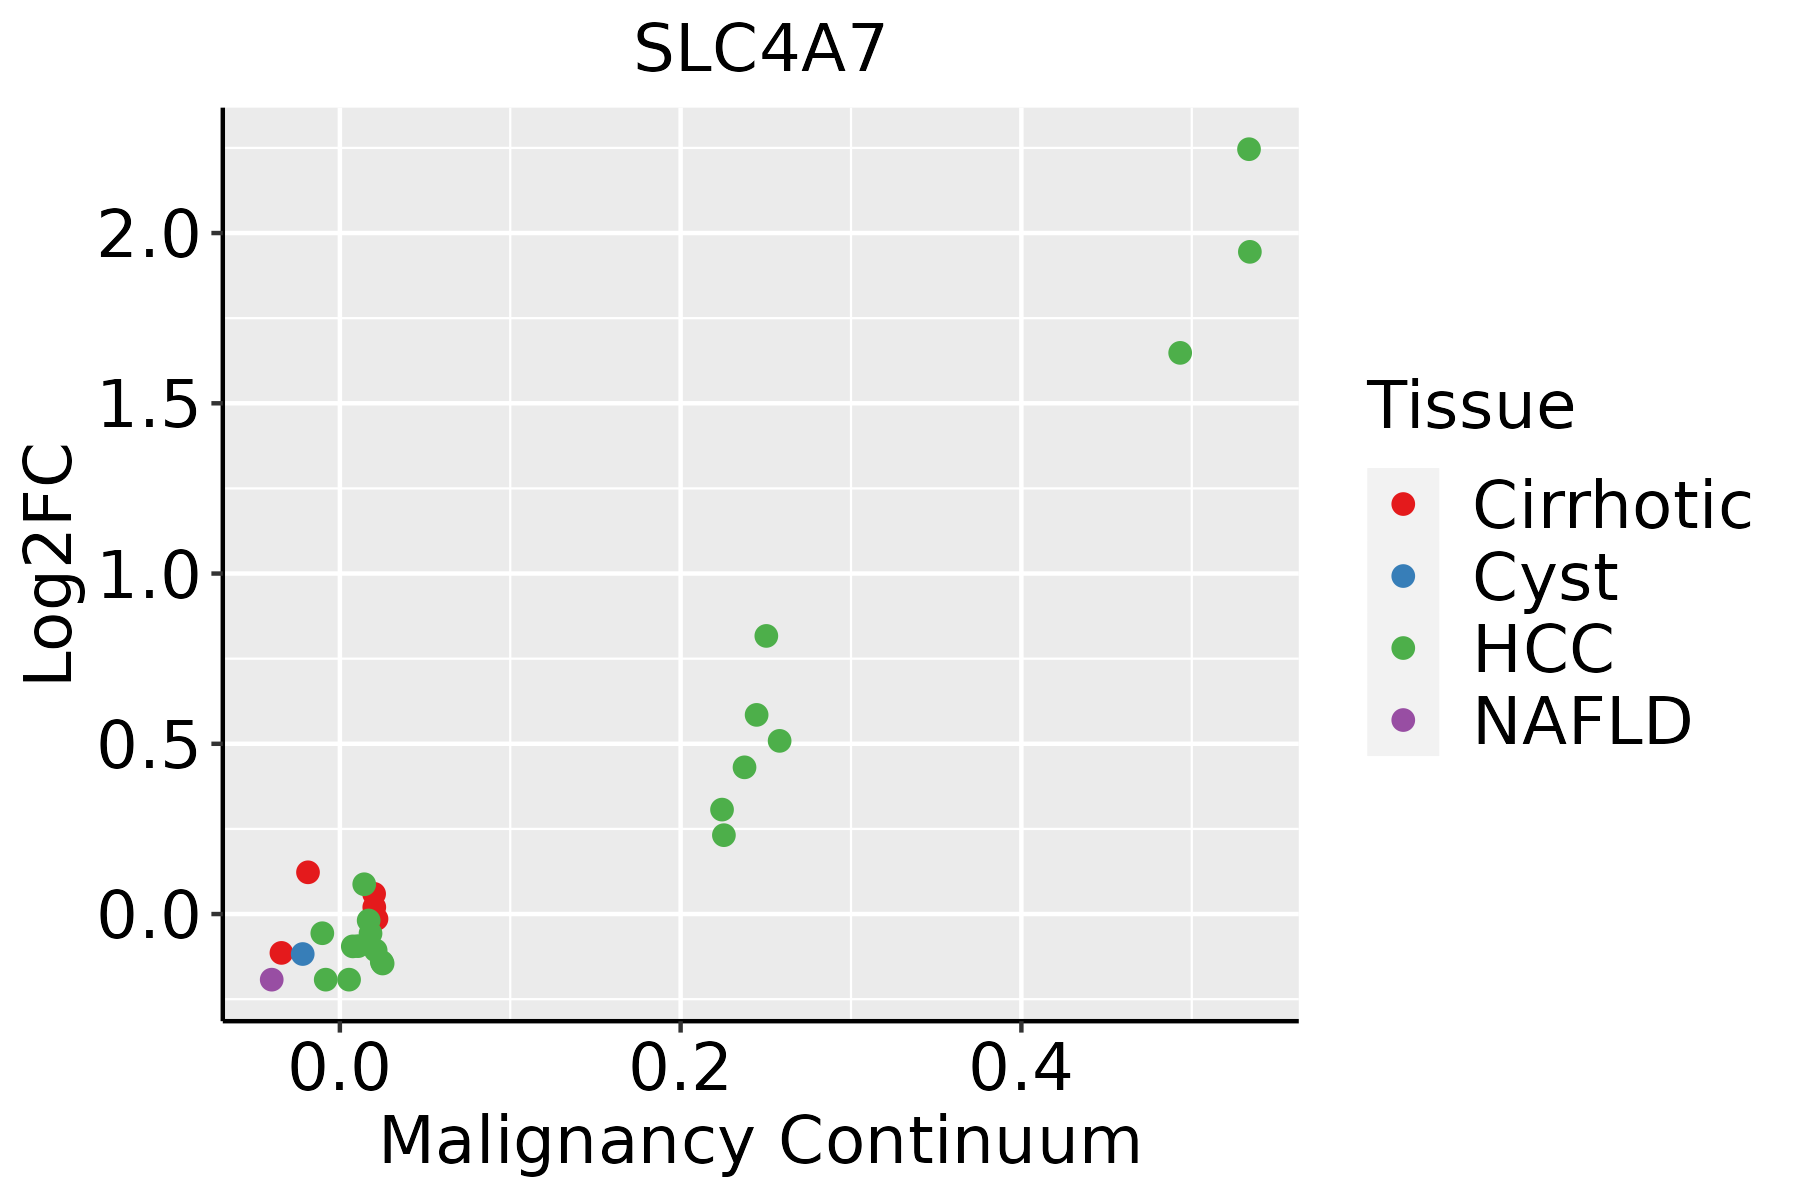
HCC: Hepatocellular carcinoma
NAFLD: Non-alcoholic fatty liver disease
LungThe image shows the transcriptomic changes along malignancy continuum.log2FC in expression of this searched gene in stem-like cells from each diseased tissue sample relative to stem-like cells in normal samples in each tissue plotted against the malignancy continuum. Samples are colored based on if they are from different disease stage.
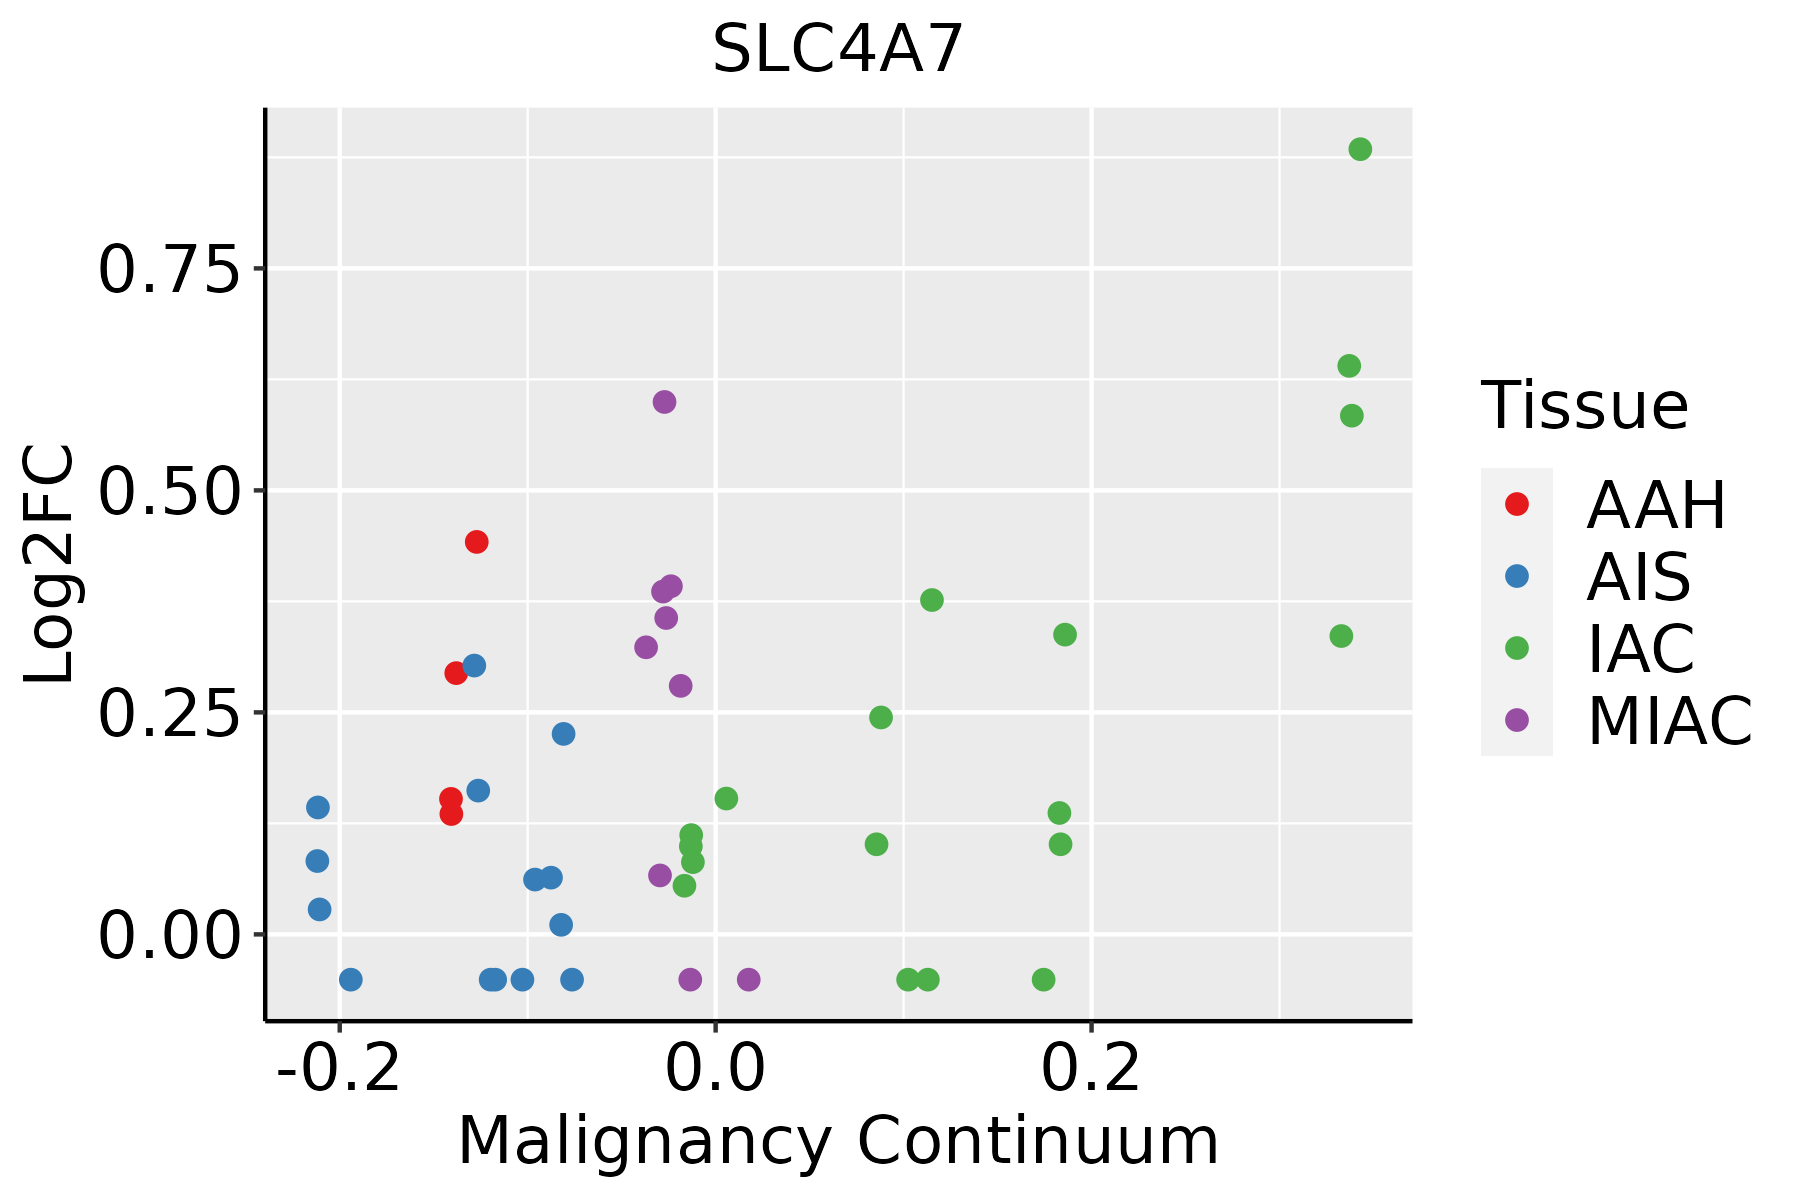
AAH: Atypical adenomatous hyperplasia
AIS: Adenocarcinoma in situ
IAC: Invasive lung adenocarcinoma
MIA: Minimally invasive adenocarcinoma
Oral CavityThe image shows the transcriptomic changes along malignancy continuum.log2FC in expression of this searched gene in stem-like cells from each diseased tissue sample relative to stem-like cells in normal samples in each tissue plotted against the malignancy continuum. Samples are colored based on if they are from different disease stage.EOLP: Erosive Oral lichen planus
LP: leukoplakia
NEOLP: Non-erosive oral lichen planus
OSCC: Oral squamous cell carcinoma
ProstateThe image shows the transcriptomic changes along malignancy continuum.log2FC in expression of this searched gene in stem-like cells from each diseased tissue sample relative to stem-like cells in normal samples in each tissue plotted against the malignancy continuum. Samples are colored based on if they are from different disease stage.BPH: Benign Prostatic Hyperplasia
SkinThe image shows the transcriptomic changes along malignancy continuum.log2FC in expression of this searched gene in stem-like cells from each diseased tissue sample relative to stem-like cells in normal samples in each tissue plotted against the malignancy continuum. Samples are colored based on if they are from different disease stage.
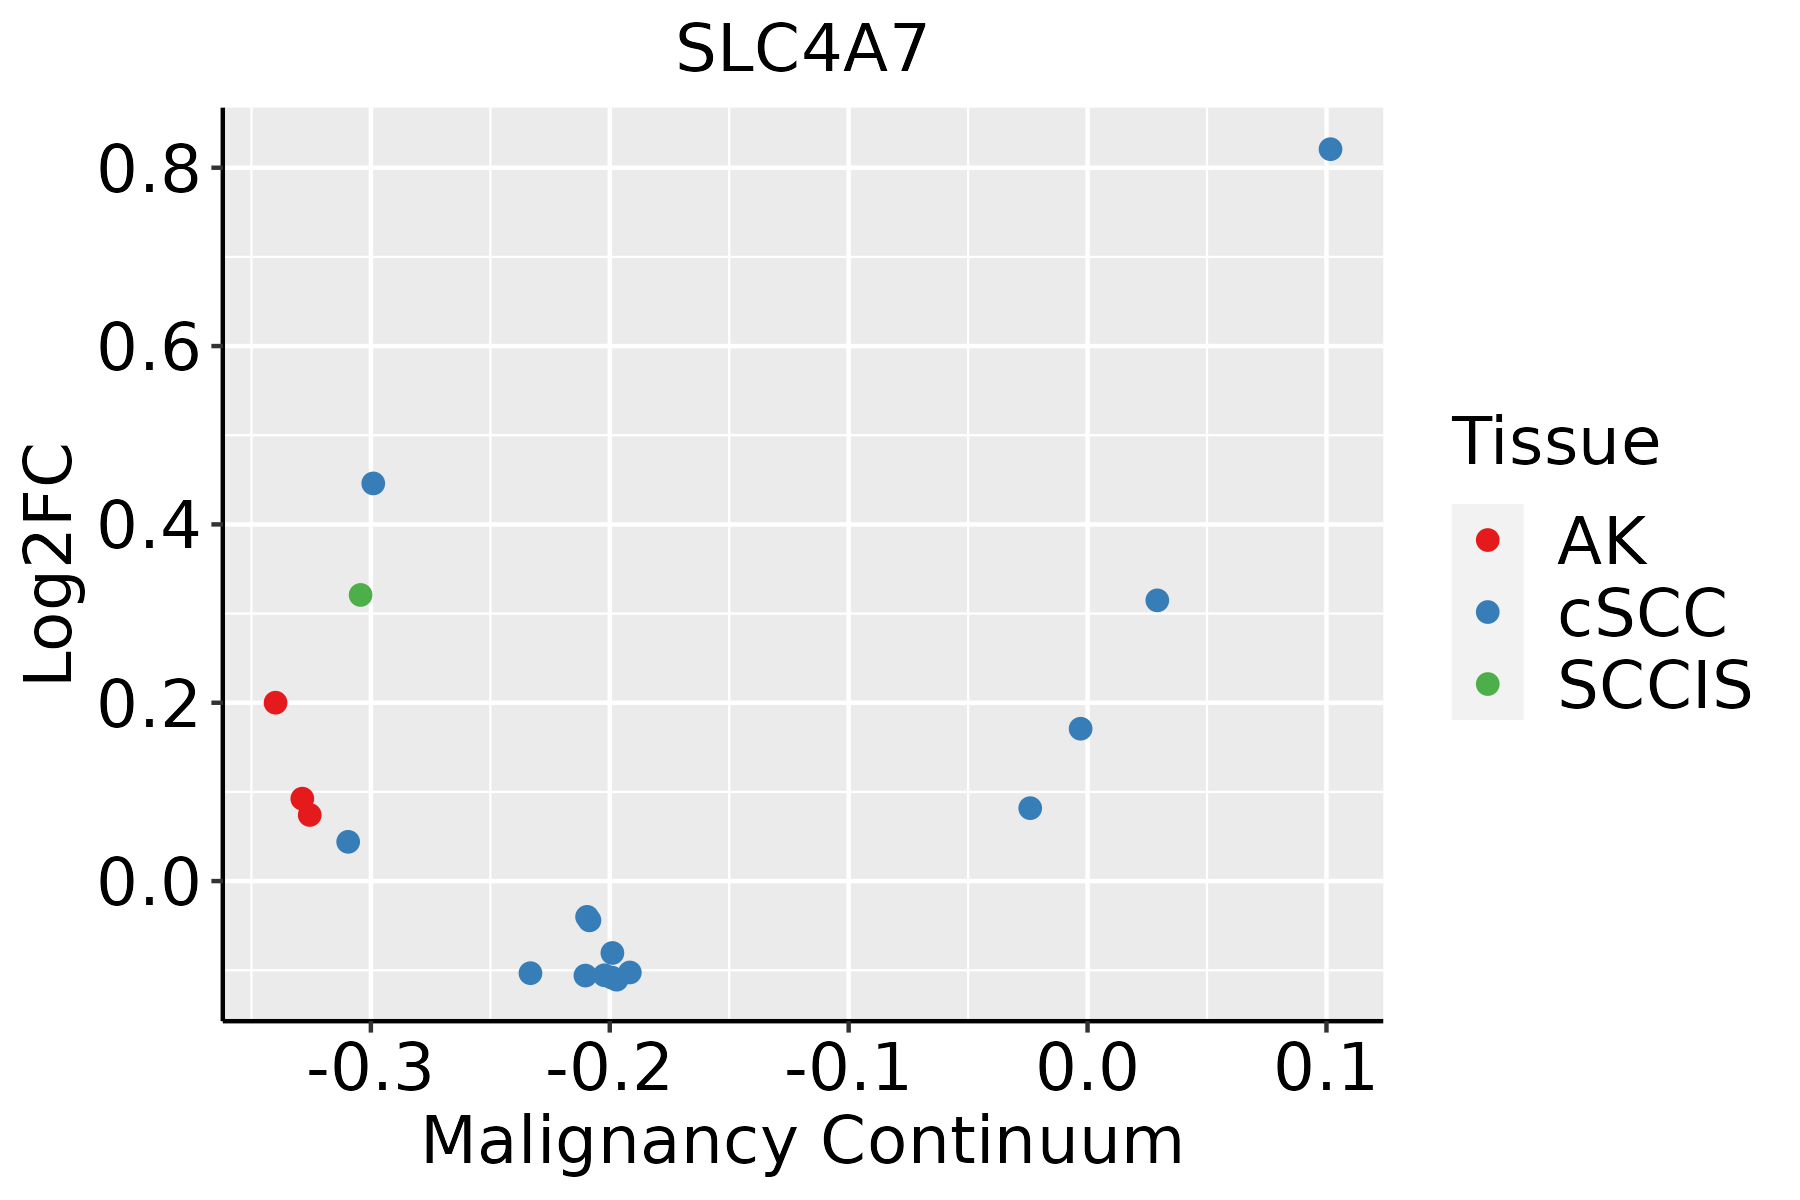
AK: Actinic keratosis
cSCC: Cutaneous squamous cell carcinoma
SCCIS:squamous cell carcinoma in situ
ThyroidThe image shows the transcriptomic changes along malignancy continuum.log2FC in expression of this searched gene in stem-like cells from each diseased tissue sample relative to stem-like cells in normal samples in each tissue plotted against the malignancy continuum. Samples are colored based on if they are from different disease stage.ATC: Anaplastic thyroid cancer
HT: Hashimoto's thyroiditis
PTC: Papillary thyroid cancer
∗log2FC in expression of this searched gene in stem-like cells from each diseased tissue sample relative to stem-like cells in normal samples in each tissue plotted against the malignancy continuum. Samples are colored based on if they are from different disease stage.

Top

Malignant transformation related pathway analysis

check buttonFind out the enriched GO biological processes and KEGG pathways involved in transition from healthy to precancer to cancer
check button Figure of enriched GO biological processes.
TissueDisease StageEnriched GO biological Processes
ColorectumADGO analysis - Figure of enriched GO biological processes: Top 15 enriched GO BP terms are showed in the bar plot of each disease state in each tissue. Each row represents a significant GO biological process which is colored according to the -log10(p.adjust).
ColorectumSERGO analysis - Figure of enriched GO biological processes: Top 15 enriched GO BP terms are showed in the bar plot of each disease state in each tissue. Each row represents a significant GO biological process which is colored according to the -log10(p.adjust).
ColorectumMSSGO analysis - Figure of enriched GO biological processes: Top 15 enriched GO BP terms are showed in the bar plot of each disease state in each tissue. Each row represents a significant GO biological process which is colored according to the -log10(p.adjust).
ColorectumMSI-HGO analysis - Figure of enriched GO biological processes: Top 15 enriched GO BP terms are showed in the bar plot of each disease state in each tissue. Each row represents a significant GO biological process which is colored according to the -log10(p.adjust).
ColorectumFAPGO analysis - Figure of enriched GO biological processes: Top 15 enriched GO BP terms are showed in the bar plot of each disease state in each tissue. Each row represents a significant GO biological process which is colored according to the -log10(p.adjust).
∗Top 15 enriched GO BP terms are showed in the bar plot of each disease state in each tissue. Each row represents a significant GO biological process which is colored according to the -log10(p.adjust).
Page: 1 2 3 4 5 6 7 8 9 

check button Enriched GO biological processes.
GO IDTissueDisease StageDescriptionGene RatioBg Ratiopvaluep.adjustCount
GO:0002064ColorectumADepithelial cell development89/3918220/187232.98e-113.52e-0989
GO:0035315ColorectumADhair cell differentiation21/391847/187232.14e-042.82e-0321
GO:0060117ColorectumADauditory receptor cell development12/391821/187233.02e-043.62e-0312
GO:0030004ColorectumADcellular monovalent inorganic cation homeostasis36/3918103/187236.80e-046.95e-0336
GO:0042491ColorectumADinner ear auditory receptor cell differentiation17/391838/187238.26e-048.13e-0317
GO:0030641ColorectumADregulation of cellular pH29/391881/187231.42e-031.22e-0229
GO:0042490ColorectumADmechanoreceptor differentiation24/391867/187233.48e-032.52e-0224
GO:0051453ColorectumADregulation of intracellular pH26/391875/187234.04e-032.82e-0226
GO:0006885ColorectumADregulation of pH30/391891/187234.95e-033.32e-0230
GO:0009913ColorectumADepidermal cell differentiation58/3918202/187235.16e-033.42e-0258
GO:0008544ColorectumADepidermis development87/3918324/187235.99e-033.76e-0287
GO:0055067ColorectumADmonovalent inorganic cation homeostasis45/3918151/187236.19e-033.88e-0245
GO:0015698ColorectumADinorganic anion transport52/3918180/187236.83e-034.22e-0252
GO:0060119ColorectumADinner ear receptor cell development17/391845/187237.10e-034.33e-0217
GO:00020642ColorectumMSSepithelial cell development81/3467220/187231.02e-101.06e-0881
GO:00601172ColorectumMSSauditory receptor cell development12/346721/187238.83e-051.41e-0312
GO:00353152ColorectumMSShair cell differentiation19/346747/187233.88e-044.86e-0319
GO:00424911ColorectumMSSinner ear auditory receptor cell differentiation16/346738/187236.47e-047.06e-0316
GO:00601191ColorectumMSSinner ear receptor cell development17/346745/187231.89e-031.65e-0217
GO:00300042ColorectumMSScellular monovalent inorganic cation homeostasis31/3467103/187232.94e-032.27e-0231
Page: 1 2 3 4 5 

check button Enriched KEGG pathways.
Pathway IDTissueDisease StageDescriptionGene RatioBg Ratiopvaluep.adjustqvalueCount
Page: 1 

Top

Cell-cell communication analysis

check buttonIdentification of potential cell-cell interactions between two cell types and their ligand-receptor pairs for different disease states
LigandReceptorLRpairPathwayTissueDisease Stage
Page: 1 

Top

Single-cell gene regulatory network inference analysis

check buttonFind out the significant the regulons (TFs) and the target genes of each regulon across cell types for different disease states
TFCell TypeTissueDisease StageTarget GeneRSSRegulon Activity
∗The dot plots of a searched regulon are shown for all cell subpopulations in each disease state of each tissue based on the regulon specific score inferred using pySCENIC and by calculating the average expression.
Page: 1 

Top

Somatic mutation of malignant transformation related genes

check buttonAnnotation of somatic variants for genes involved in malignant transformation
Hugo SymbolVariant ClassVariant ClassificationdbSNP RSHGVScHGVSpHGVSp ShortSWISSPROTBIOTYPESIFTPolyPhenTumor Sample BarcodeTissueHistologySexAgeStageTherapy TypesDrugsOutcome
SLC4A7SNVMissense_Mutationc.3568N>Gp.Pro1190Alap.P1190AQ9Y6M7protein_codingdeleterious(0)benign(0.23)TCGA-A8-A06Q-01Breastbreast invasive carcinomaFemale<65III/IVUnknownUnknownSD
SLC4A7SNVMissense_Mutationc.3477N>Cp.Lys1159Asnp.K1159NQ9Y6M7protein_codingtolerated(0.05)benign(0.097)TCGA-AC-A23H-01Breastbreast invasive carcinomaFemale>=65I/IIUnknownUnknownPD
SLC4A7SNVMissense_Mutationc.896N>Cp.Arg299Thrp.R299TQ9Y6M7protein_codingtolerated(0.28)benign(0.192)TCGA-AC-A23H-01Breastbreast invasive carcinomaFemale>=65I/IIUnknownUnknownPD
SLC4A7SNVMissense_Mutationc.466N>Ap.Asp156Asnp.D156NQ9Y6M7protein_codingtolerated(0.23)benign(0.423)TCGA-AC-A23H-01Breastbreast invasive carcinomaFemale>=65I/IIUnknownUnknownPD
SLC4A7SNVMissense_Mutationc.85G>Ap.Asp29Asnp.D29NQ9Y6M7protein_codingdeleterious(0)probably_damaging(0.984)TCGA-AR-A251-01Breastbreast invasive carcinomaFemale<65III/IVChemotherapydoxorubicinSD
SLC4A7SNVMissense_Mutationc.2048N>Gp.Phe683Cysp.F683CQ9Y6M7protein_codingdeleterious(0)probably_damaging(0.992)TCGA-D8-A1XK-01Breastbreast invasive carcinomaFemale<65I/IIChemotherapydoxorubicine+cyclophosphamideSD
SLC4A7insertionFrame_Shift_Insnovelc.914_915insACCAAACCAATGTATGCCTTATGTGTATTTGATTGATGTCTCATGTp.Ser306ProfsTer32p.S306Pfs*32Q9Y6M7protein_codingTCGA-A2-A0CW-01Breastbreast invasive carcinomaFemale>=65I/IIHormone TherapyanastrozoleSD
SLC4A7deletionFrame_Shift_Delc.1645delNp.Ser549ValfsTer46p.S549Vfs*46Q9Y6M7protein_codingTCGA-D8-A27V-01Breastbreast invasive carcinomaFemale<65I/IIHormone TherapytamoxiphenSD
SLC4A7deletionFrame_Shift_Delnovelc.1053delNp.Asp351GlufsTer5p.D351Efs*5Q9Y6M7protein_codingTCGA-D8-A27V-01Breastbreast invasive carcinomaFemale<65I/IIHormone TherapytamoxiphenSD
SLC4A7SNVMissense_Mutationrs779940746c.707G>Ap.Arg236Glnp.R236QQ9Y6M7protein_codingdeleterious(0.04)possibly_damaging(0.829)TCGA-2W-A8YY-01Cervixcervical & endocervical cancerFemale<65I/IIChemotherapycisplatinCR
Page: 1 2 3 4 5 6 7 8 9 10 11 12 13 14 

Top

Related drugs of malignant transformation related genes

check buttonIdentification of chemicals and drugs interact with genes involved in malignant transfromation
(DGIdb 4.0)
Entrez IDSymbolCategoryInteraction TypesDrug Claim NameDrug NamePMIDs
Page: 1