
|
|||||
|
 | |
| |
| |
| |
| |
| |
|
Gene: SLC4A5 |
Gene summary for SLC4A5 |
| Gene information | Species | Human | Gene symbol | SLC4A5 | Gene ID | 57835 |
| Gene name | solute carrier family 4 member 5 | |
| Gene Alias | NBC4 | |
| Cytomap | 2p13.1 | |
| Gene Type | protein-coding | GO ID | GO:0001654 | UniProtAcc | Q9BY07 |
Top |
Malignant transformation analysis |
| Identification of the aberrant gene expression in precancerous and cancerous lesions by comparing the gene expression of stem-like cells in diseased tissues with normal stem cells |
| Entrez ID | Symbol | Replicates | Species | Organ | Tissue | Adj P-value | Log2FC | Malignancy |
| 57835 | SLC4A5 | HCC1 | Human | Liver | HCC | 1.94e-07 | 1.18e+00 | 0.5336 |
| 57835 | SLC4A5 | HCC2 | Human | Liver | HCC | 1.88e-19 | 1.48e+00 | 0.5341 |
| 57835 | SLC4A5 | HCC5 | Human | Liver | HCC | 1.29e-08 | 9.22e-01 | 0.4932 |
| 57835 | SLC4A5 | RNA-P25T1-P25T1-1 | Human | Lung | AIS | 2.05e-14 | 7.26e-01 | -0.2116 |
| 57835 | SLC4A5 | RNA-P25T1-P25T1-3 | Human | Lung | AIS | 1.26e-02 | 5.26e-01 | -0.2107 |
| 57835 | SLC4A5 | RNA-P25T1-P25T1-4 | Human | Lung | AIS | 2.19e-07 | 6.03e-01 | -0.2119 |
| 57835 | SLC4A5 | male-WTA | Human | Thyroid | PTC | 1.78e-20 | 1.69e-01 | 0.1037 |
| 57835 | SLC4A5 | PTC04 | Human | Thyroid | PTC | 2.07e-03 | 8.20e-02 | 0.1927 |
| 57835 | SLC4A5 | PTC06 | Human | Thyroid | PTC | 2.42e-15 | 7.30e-01 | 0.2057 |
| 57835 | SLC4A5 | PTC07 | Human | Thyroid | PTC | 1.87e-06 | 2.72e-01 | 0.2044 |
| 57835 | SLC4A5 | ATC13 | Human | Thyroid | ATC | 2.19e-04 | -5.30e-02 | 0.34 |
| 57835 | SLC4A5 | ATC5 | Human | Thyroid | ATC | 4.21e-06 | -4.90e-02 | 0.34 |
| Page: 1 |
| Tissue | Expression Dynamics | Abbreviation |
| Liver | 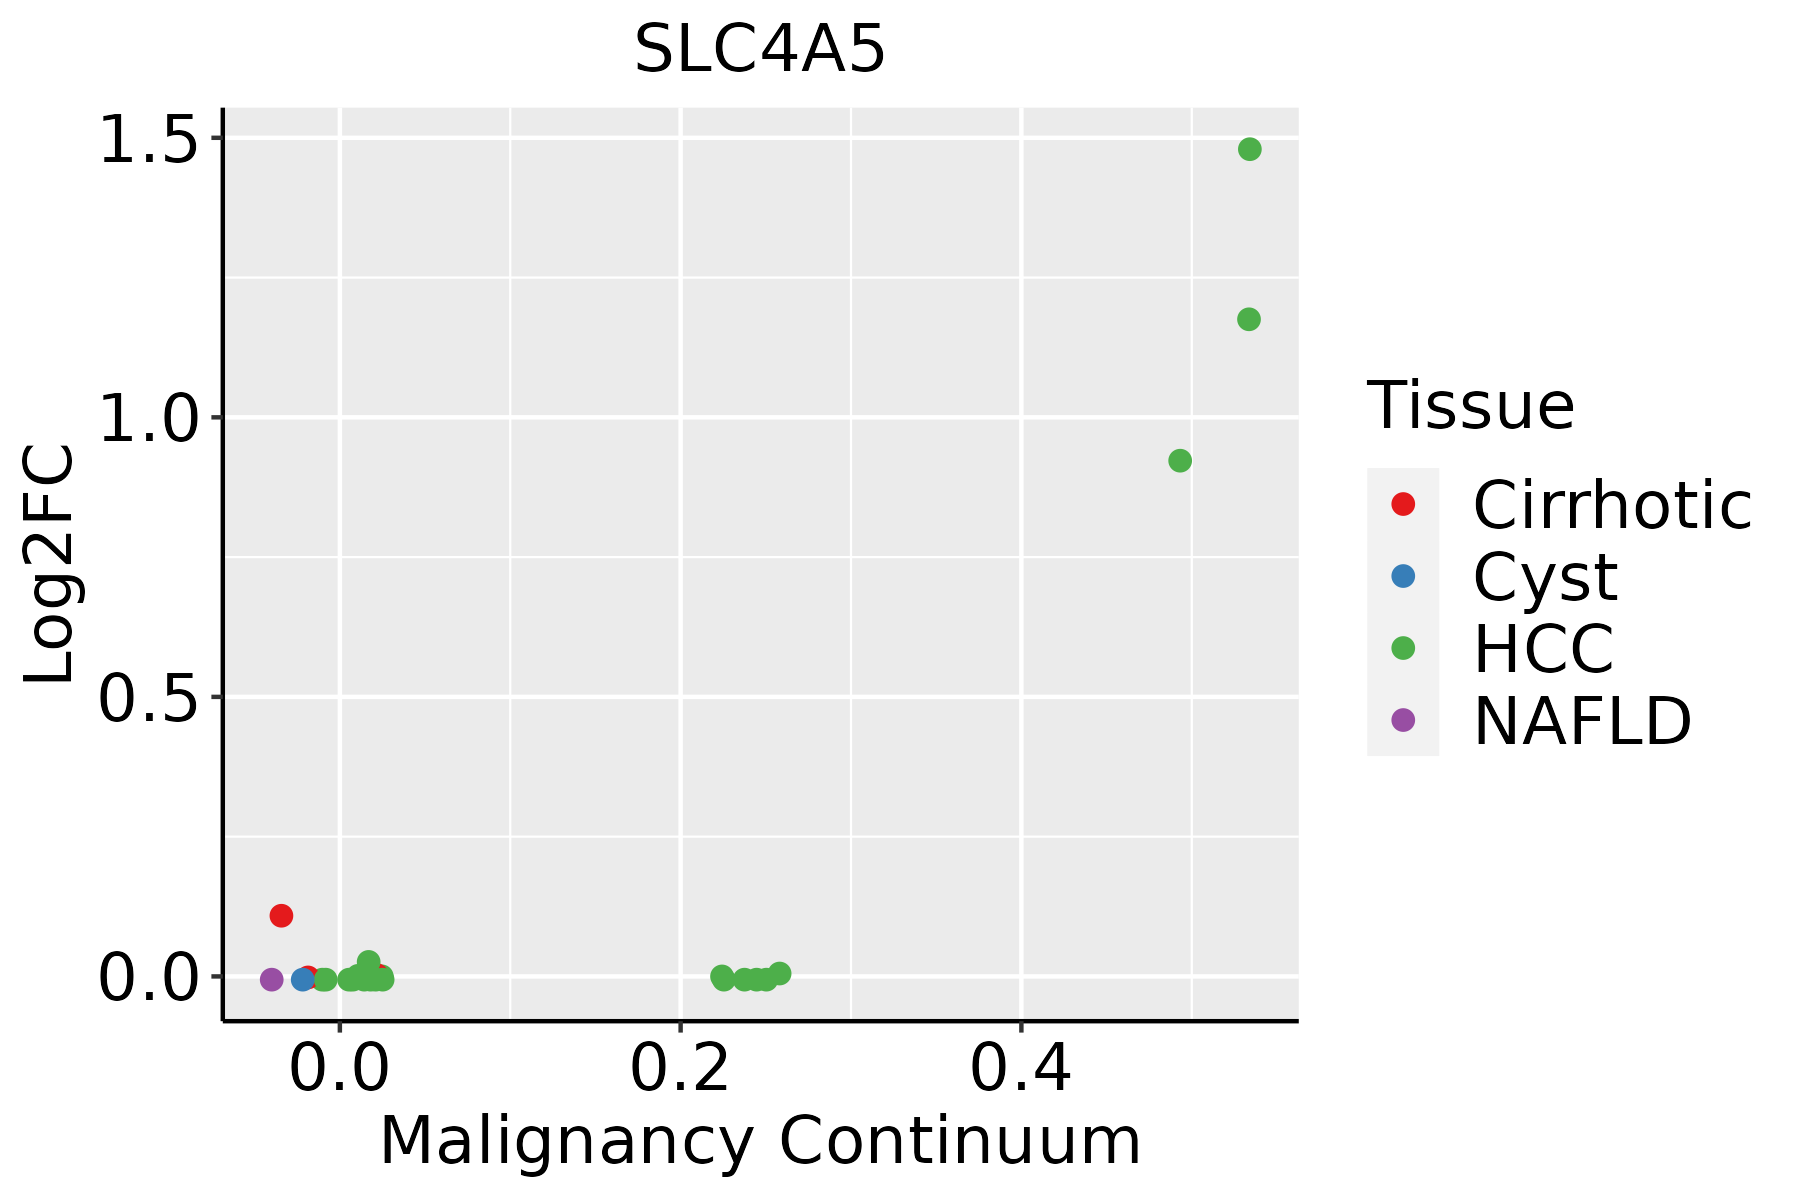 | HCC: Hepatocellular carcinoma |
| NAFLD: Non-alcoholic fatty liver disease | ||
| Lung | 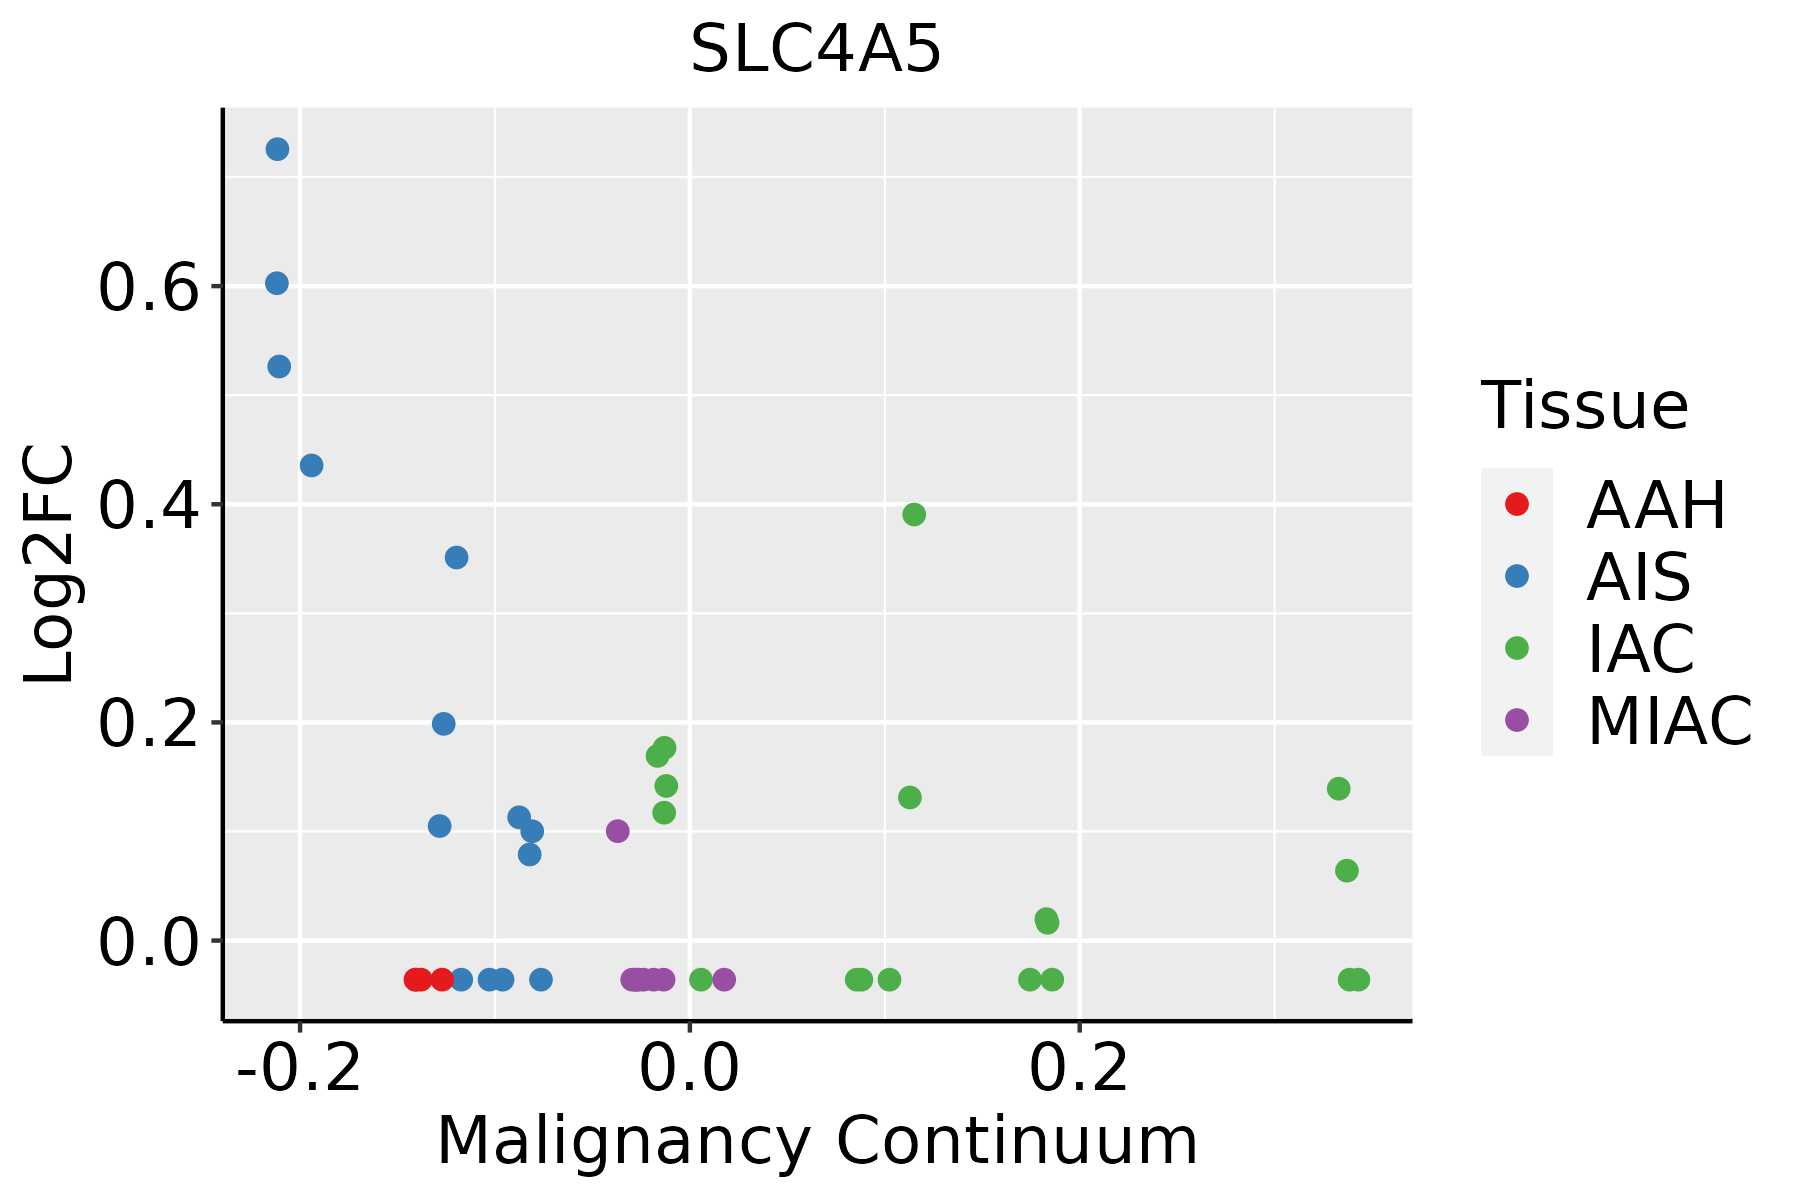 | AAH: Atypical adenomatous hyperplasia |
| AIS: Adenocarcinoma in situ | ||
| IAC: Invasive lung adenocarcinoma | ||
| MIA: Minimally invasive adenocarcinoma | ||
| Thyroid |  | ATC: Anaplastic thyroid cancer |
| HT: Hashimoto's thyroiditis | ||
| PTC: Papillary thyroid cancer |
| ∗log2FC in expression of this searched gene in stem-like cells from each diseased tissue sample relative to stem-like cells in normal samples in each tissue plotted against the malignancy continuum. Samples are colored based on if they are from different disease stage. |
Top |
Malignant transformation related pathway analysis |
| Find out the enriched GO biological processes and KEGG pathways involved in transition from healthy to precancer to cancer |
| Tissue | Disease Stage | Enriched GO biological Processes |
| Colorectum | AD |  |
| Colorectum | SER |  |
| Colorectum | MSS |  |
| Colorectum | MSI-H |  |
| Colorectum | FAP |  |
| ∗Top 15 enriched GO BP terms are showed in the bar plot of each disease state in each tissue. Each row represents a significant GO biological process which is colored according to the -log10(p.adjust). |
| Page: 1 2 3 4 5 6 7 8 9 |
| GO ID | Tissue | Disease Stage | Description | Gene Ratio | Bg Ratio | pvalue | p.adjust | Count |
| GO:0051646 | Liver | HCC | mitochondrion localization | 34/7958 | 50/18723 | 2.38e-04 | 1.79e-03 | 34 |
| GO:005087822 | Liver | HCC | regulation of body fluid levels | 191/7958 | 379/18723 | 1.06e-03 | 6.11e-03 | 191 |
| GO:000206422 | Liver | HCC | epithelial cell development | 114/7958 | 220/18723 | 3.19e-03 | 1.47e-02 | 114 |
| GO:0048311 | Liver | HCC | mitochondrion distribution | 12/7958 | 16/18723 | 8.74e-03 | 3.40e-02 | 12 |
| GO:000206413 | Lung | AIS | epithelial cell development | 48/1849 | 220/18723 | 1.06e-07 | 1.18e-05 | 48 |
| GO:00508788 | Lung | AIS | regulation of body fluid levels | 57/1849 | 379/18723 | 8.60e-04 | 1.17e-02 | 57 |
| GO:00075894 | Lung | AIS | body fluid secretion | 18/1849 | 93/18723 | 3.99e-03 | 3.65e-02 | 18 |
| GO:0002064112 | Thyroid | PTC | epithelial cell development | 101/5968 | 220/18723 | 8.53e-06 | 9.74e-05 | 101 |
| GO:00516465 | Thyroid | PTC | mitochondrion localization | 24/5968 | 50/18723 | 1.25e-02 | 4.88e-02 | 24 |
| GO:000206428 | Thyroid | ATC | epithelial cell development | 103/6293 | 220/18723 | 3.06e-05 | 2.55e-04 | 103 |
| GO:0050878112 | Thyroid | ATC | regulation of body fluid levels | 149/6293 | 379/18723 | 1.08e-02 | 3.90e-02 | 149 |
| GO:005164612 | Thyroid | ATC | mitochondrion localization | 25/6293 | 50/18723 | 1.20e-02 | 4.27e-02 | 25 |
| Page: 1 |
| Pathway ID | Tissue | Disease Stage | Description | Gene Ratio | Bg Ratio | pvalue | p.adjust | qvalue | Count |
| Page: 1 |
Top |
Cell-cell communication analysis |
| Identification of potential cell-cell interactions between two cell types and their ligand-receptor pairs for different disease states |
| Ligand | Receptor | LRpair | Pathway | Tissue | Disease Stage |
| Page: 1 |
Top |
Single-cell gene regulatory network inference analysis |
| Find out the significant the regulons (TFs) and the target genes of each regulon across cell types for different disease states |
| TF | Cell Type | Tissue | Disease Stage | Target Gene | RSS | Regulon Activity |
| ∗The dot plots of a searched regulon are shown for all cell subpopulations in each disease state of each tissue based on the regulon specific score inferred using pySCENIC and by calculating the average expression. |
| Page: 1 |
Top |
Somatic mutation of malignant transformation related genes |
| Annotation of somatic variants for genes involved in malignant transformation |
| Hugo Symbol | Variant Class | Variant Classification | dbSNP RS | HGVSc | HGVSp | HGVSp Short | SWISSPROT | BIOTYPE | SIFT | PolyPhen | Tumor Sample Barcode | Tissue | Histology | Sex | Age | Stage | Therapy Types | Drugs | Outcome |
| SLC4A5 | SNV | Missense_Mutation | novel | c.2727N>C | p.Glu909Asp | p.E909D | Q9BY07 | protein_coding | deleterious(0) | possibly_damaging(0.896) | TCGA-A7-A4SE-01 | Breast | breast invasive carcinoma | Female | <65 | I/II | Chemotherapy | adriamycin | CR |
| SLC4A5 | SNV | Missense_Mutation | c.2338G>A | p.Asp780Asn | p.D780N | Q9BY07 | protein_coding | deleterious(0.01) | probably_damaging(1) | TCGA-A8-A06Q-01 | Breast | breast invasive carcinoma | Female | <65 | III/IV | Unknown | Unknown | SD | |
| SLC4A5 | SNV | Missense_Mutation | c.2320N>A | p.Val774Ile | p.V774I | Q9BY07 | protein_coding | tolerated(0.08) | benign(0.009) | TCGA-AR-A256-01 | Breast | breast invasive carcinoma | Female | <65 | I/II | Chemotherapy | doxorubicin | PD | |
| SLC4A5 | SNV | Missense_Mutation | c.1883N>C | p.Ile628Thr | p.I628T | Q9BY07 | protein_coding | deleterious(0) | possibly_damaging(0.861) | TCGA-D8-A1XJ-01 | Breast | breast invasive carcinoma | Female | >=65 | III/IV | Hormone Therapy | tamoxiphen | SD | |
| SLC4A5 | SNV | Missense_Mutation | c.2003N>T | p.Asp668Val | p.D668V | Q9BY07 | protein_coding | tolerated(0.15) | possibly_damaging(0.673) | TCGA-E2-A158-01 | Breast | breast invasive carcinoma | Female | <65 | I/II | Chemotherapy | arimidex | SD | |
| SLC4A5 | SNV | Missense_Mutation | rs767096839 | c.2213A>C | p.Lys738Thr | p.K738T | Q9BY07 | protein_coding | tolerated(0.19) | possibly_damaging(0.513) | TCGA-E2-A1LH-01 | Breast | breast invasive carcinoma | Female | <65 | I/II | Chemotherapy | adriamycin | SD |
| SLC4A5 | SNV | Missense_Mutation | novel | c.1436C>T | p.Pro479Leu | p.P479L | Q9BY07 | protein_coding | tolerated(0.06) | probably_damaging(0.999) | TCGA-EW-A1J6-01 | Breast | breast invasive carcinoma | Female | >=65 | I/II | Hormone Therapy | femara | SD |
| SLC4A5 | SNV | Missense_Mutation | novel | c.1505N>A | p.Ile502Asn | p.I502N | Q9BY07 | protein_coding | deleterious(0) | possibly_damaging(0.88) | TCGA-HN-A2NL-01 | Breast | breast invasive carcinoma | Female | <65 | I/II | Chemotherapy | cyclophosphamide | SD |
| SLC4A5 | insertion | Nonsense_Mutation | novel | c.2783_2784insGCATGGTGGCACGTGCCTGTAATCACAGC | p.Val929HisfsTer7 | p.V929Hfs*7 | Q9BY07 | protein_coding | TCGA-A7-A0CE-01 | Breast | breast invasive carcinoma | Female | <65 | I/II | Chemotherapy | adriamycin | SD | ||
| SLC4A5 | insertion | Frame_Shift_Ins | novel | c.2943_2944insGGGCCAGGAG | p.Ile982GlyfsTer92 | p.I982Gfs*92 | Q9BY07 | protein_coding | TCGA-A8-A09B-01 | Breast | breast invasive carcinoma | Female | <65 | III/IV | Chemotherapy | 5-fluorouracil | SD |
| Page: 1 2 3 4 5 6 7 8 9 10 11 12 |
Top |
Related drugs of malignant transformation related genes |
| Identification of chemicals and drugs interact with genes involved in malignant transfromation |
| (DGIdb 4.0) |
| Entrez ID | Symbol | Category | Interaction Types | Drug Claim Name | Drug Name | PMIDs |
| Page: 1 |

Copyright 2023-Present -The University of Texas Health Science Center at Houston |