
|
|||||
|
 | |
| |
| |
| |
| |
| |
|
Gene: SLC4A2 |
Gene summary for SLC4A2 |
| Gene information | Species | Human | Gene symbol | SLC4A2 | Gene ID | 6522 |
| Gene name | solute carrier family 4 member 2 | |
| Gene Alias | AE2 | |
| Cytomap | 7q36.1 | |
| Gene Type | protein-coding | GO ID | GO:0000003 | UniProtAcc | P04920 |
Top |
Malignant transformation analysis |
| Identification of the aberrant gene expression in precancerous and cancerous lesions by comparing the gene expression of stem-like cells in diseased tissues with normal stem cells |
| Entrez ID | Symbol | Replicates | Species | Organ | Tissue | Adj P-value | Log2FC | Malignancy |
| 6522 | SLC4A2 | LZE7T | Human | Esophagus | ESCC | 2.38e-03 | 1.29e-01 | 0.0667 |
| 6522 | SLC4A2 | LZE20T | Human | Esophagus | ESCC | 1.09e-03 | 1.09e-01 | 0.0662 |
| 6522 | SLC4A2 | LZE22T | Human | Esophagus | ESCC | 2.88e-03 | 3.74e-01 | 0.068 |
| 6522 | SLC4A2 | LZE24T | Human | Esophagus | ESCC | 1.82e-16 | 2.70e-01 | 0.0596 |
| 6522 | SLC4A2 | P1T-E | Human | Esophagus | ESCC | 2.07e-10 | 3.65e-01 | 0.0875 |
| 6522 | SLC4A2 | P2T-E | Human | Esophagus | ESCC | 1.01e-12 | 8.01e-02 | 0.1177 |
| 6522 | SLC4A2 | P4T-E | Human | Esophagus | ESCC | 6.68e-09 | 1.94e-01 | 0.1323 |
| 6522 | SLC4A2 | P5T-E | Human | Esophagus | ESCC | 4.73e-11 | 1.77e-01 | 0.1327 |
| 6522 | SLC4A2 | P8T-E | Human | Esophagus | ESCC | 2.43e-16 | 2.09e-01 | 0.0889 |
| 6522 | SLC4A2 | P9T-E | Human | Esophagus | ESCC | 3.58e-10 | 2.42e-01 | 0.1131 |
| 6522 | SLC4A2 | P10T-E | Human | Esophagus | ESCC | 9.20e-19 | 2.25e-01 | 0.116 |
| 6522 | SLC4A2 | P11T-E | Human | Esophagus | ESCC | 1.76e-03 | 2.28e-01 | 0.1426 |
| 6522 | SLC4A2 | P12T-E | Human | Esophagus | ESCC | 8.51e-22 | 3.19e-01 | 0.1122 |
| 6522 | SLC4A2 | P15T-E | Human | Esophagus | ESCC | 2.77e-25 | 4.91e-01 | 0.1149 |
| 6522 | SLC4A2 | P16T-E | Human | Esophagus | ESCC | 2.26e-16 | 1.65e-01 | 0.1153 |
| 6522 | SLC4A2 | P17T-E | Human | Esophagus | ESCC | 4.60e-03 | 1.72e-01 | 0.1278 |
| 6522 | SLC4A2 | P19T-E | Human | Esophagus | ESCC | 2.21e-10 | 6.07e-01 | 0.1662 |
| 6522 | SLC4A2 | P20T-E | Human | Esophagus | ESCC | 4.14e-07 | 1.05e-01 | 0.1124 |
| 6522 | SLC4A2 | P21T-E | Human | Esophagus | ESCC | 6.62e-18 | 2.73e-01 | 0.1617 |
| 6522 | SLC4A2 | P22T-E | Human | Esophagus | ESCC | 9.38e-05 | 3.61e-02 | 0.1236 |
| Page: 1 2 3 4 5 6 |
| Tissue | Expression Dynamics | Abbreviation |
| Esophagus | 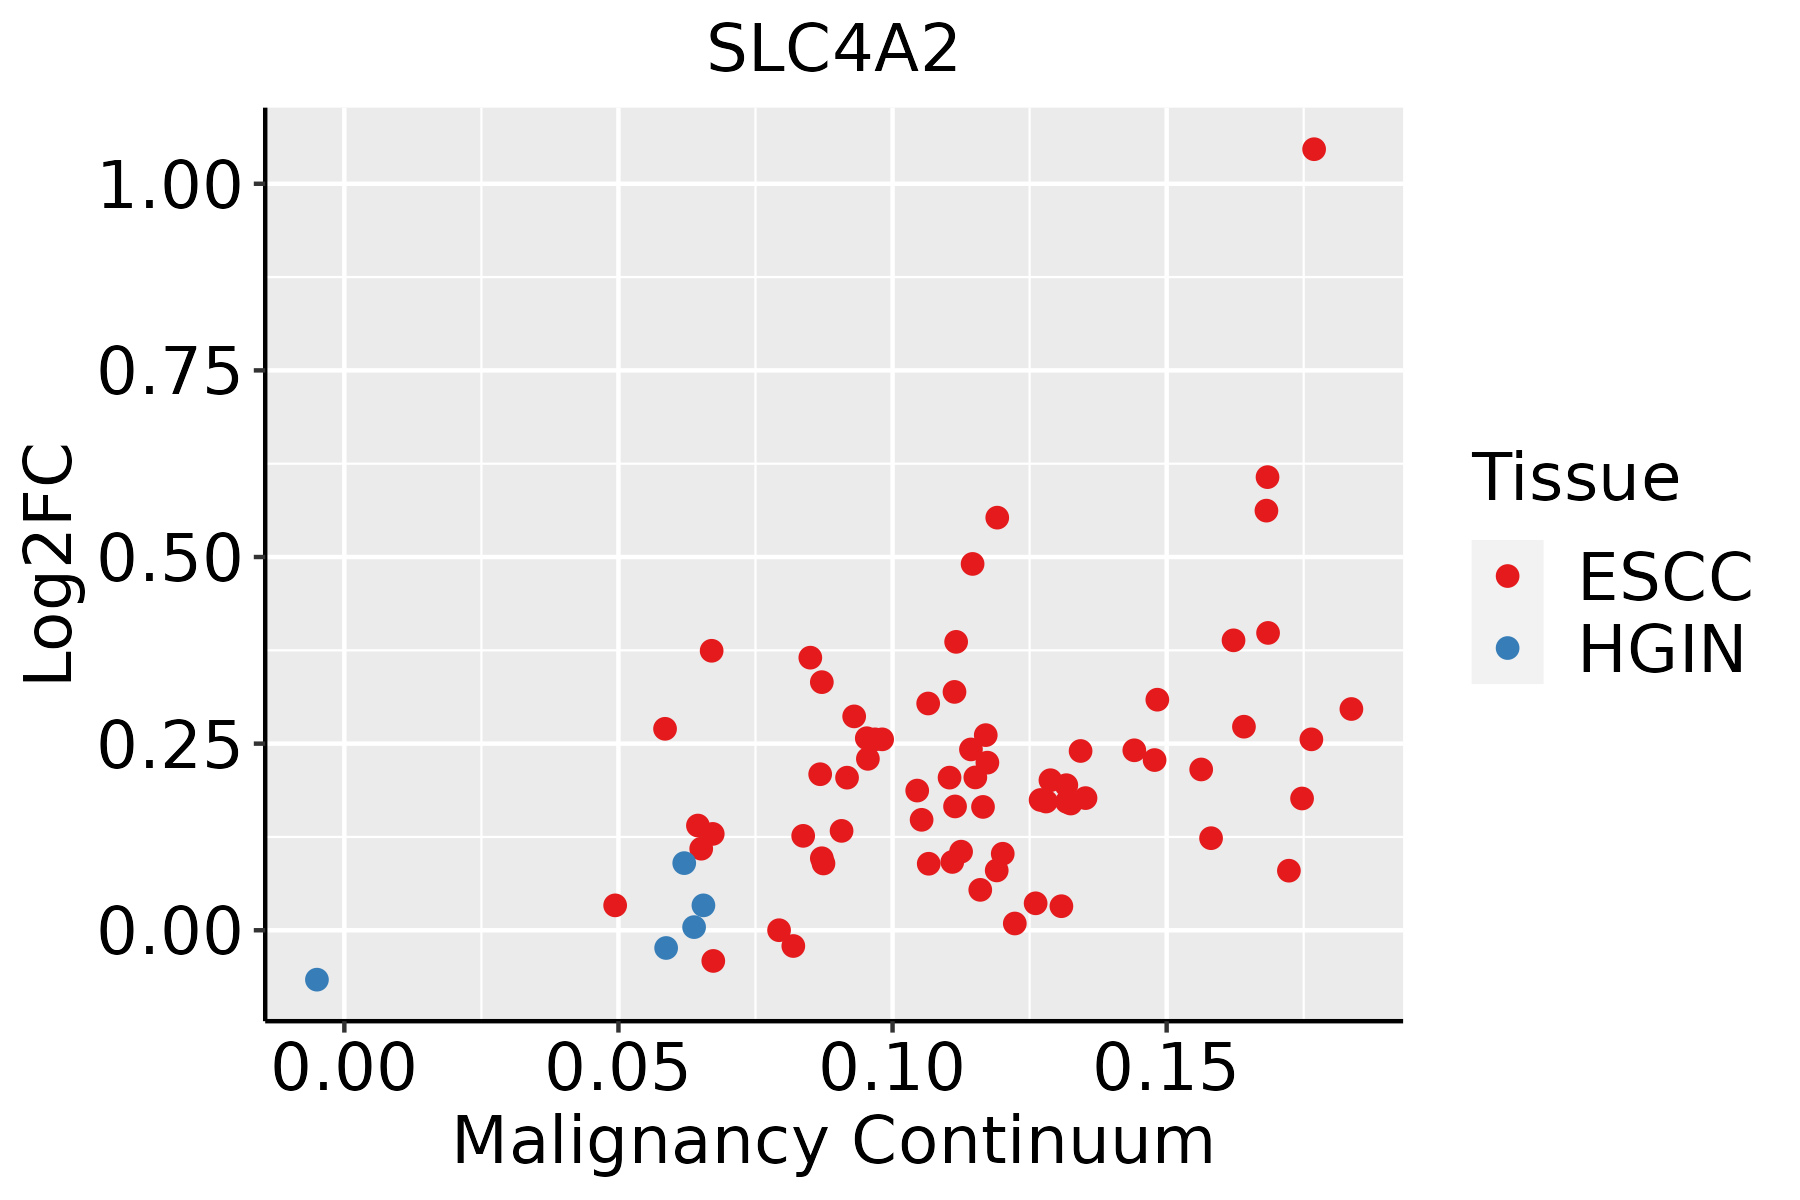 | ESCC: Esophageal squamous cell carcinoma |
| HGIN: High-grade intraepithelial neoplasias | ||
| LGIN: Low-grade intraepithelial neoplasias | ||
| Liver | 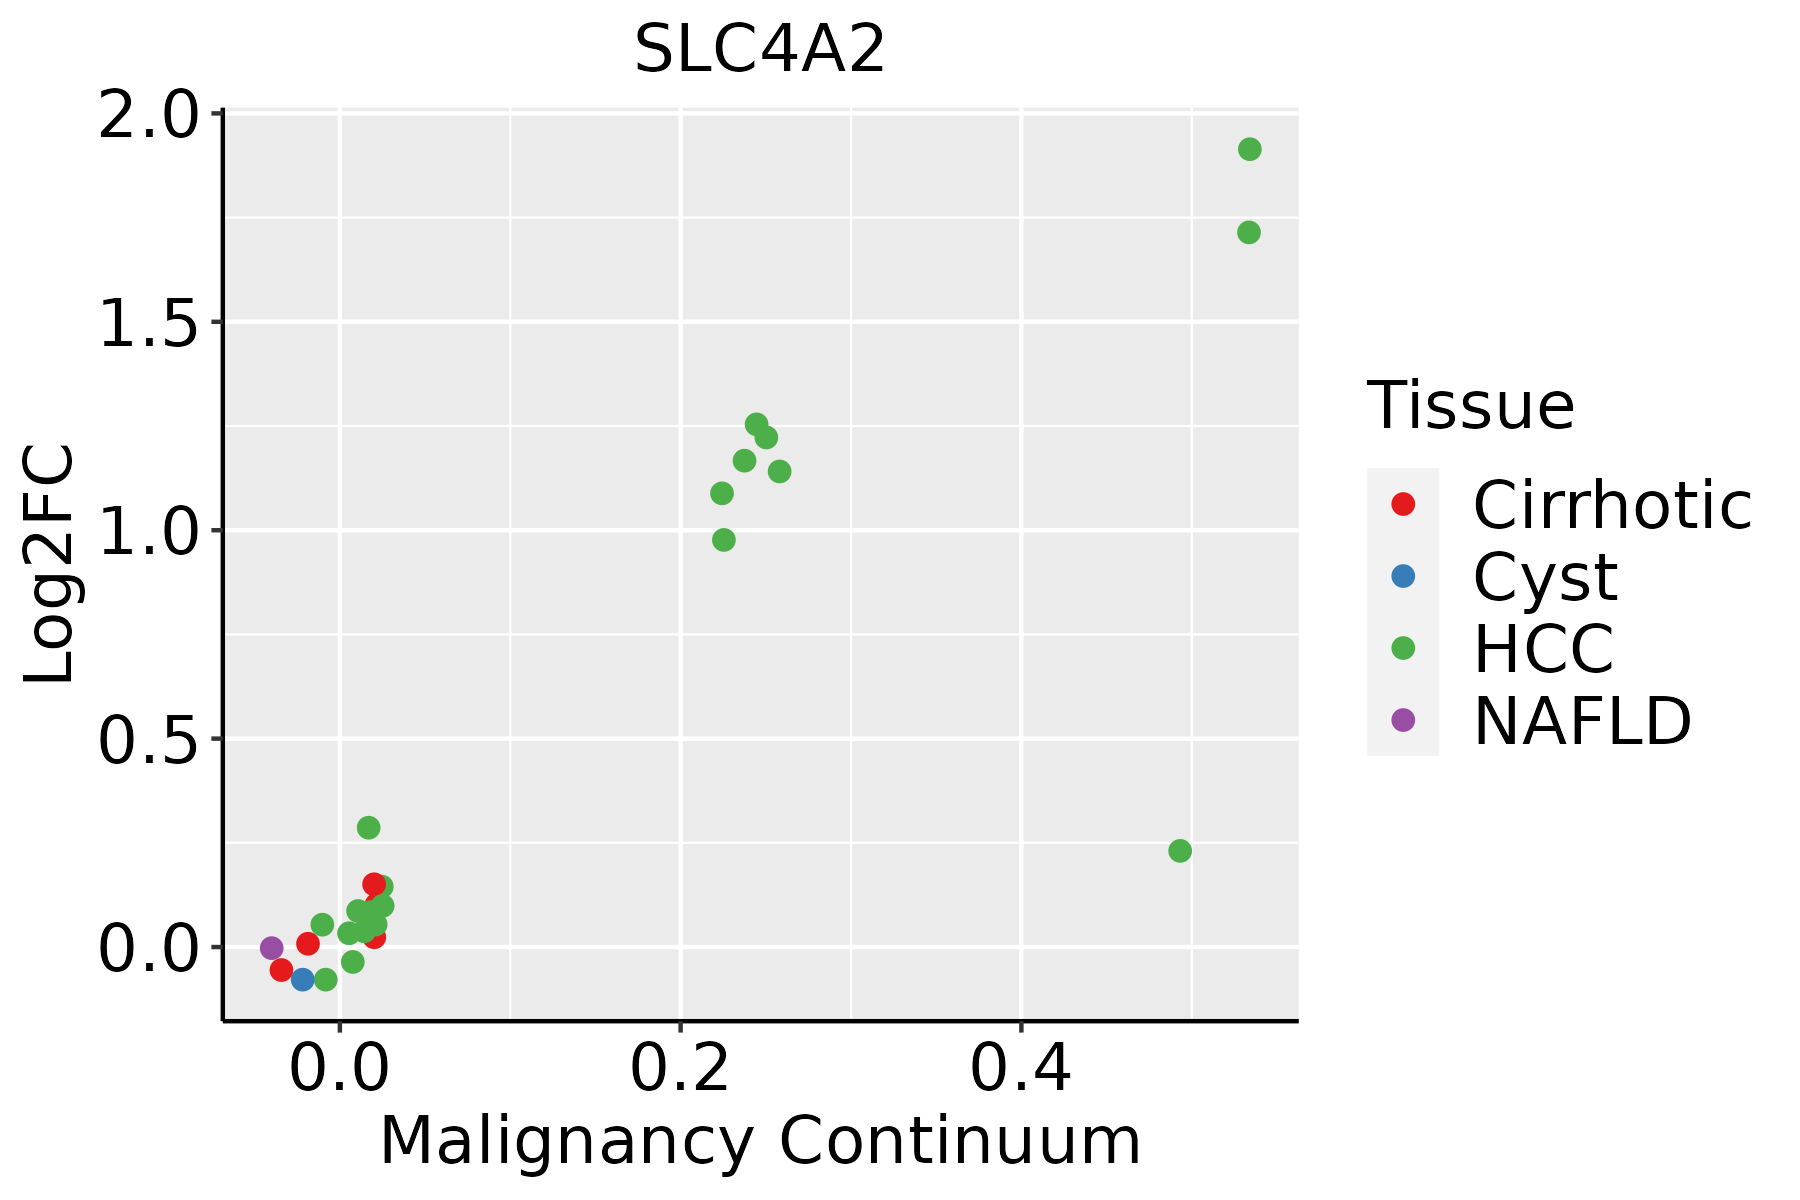 | HCC: Hepatocellular carcinoma |
| NAFLD: Non-alcoholic fatty liver disease | ||
| Oral Cavity | 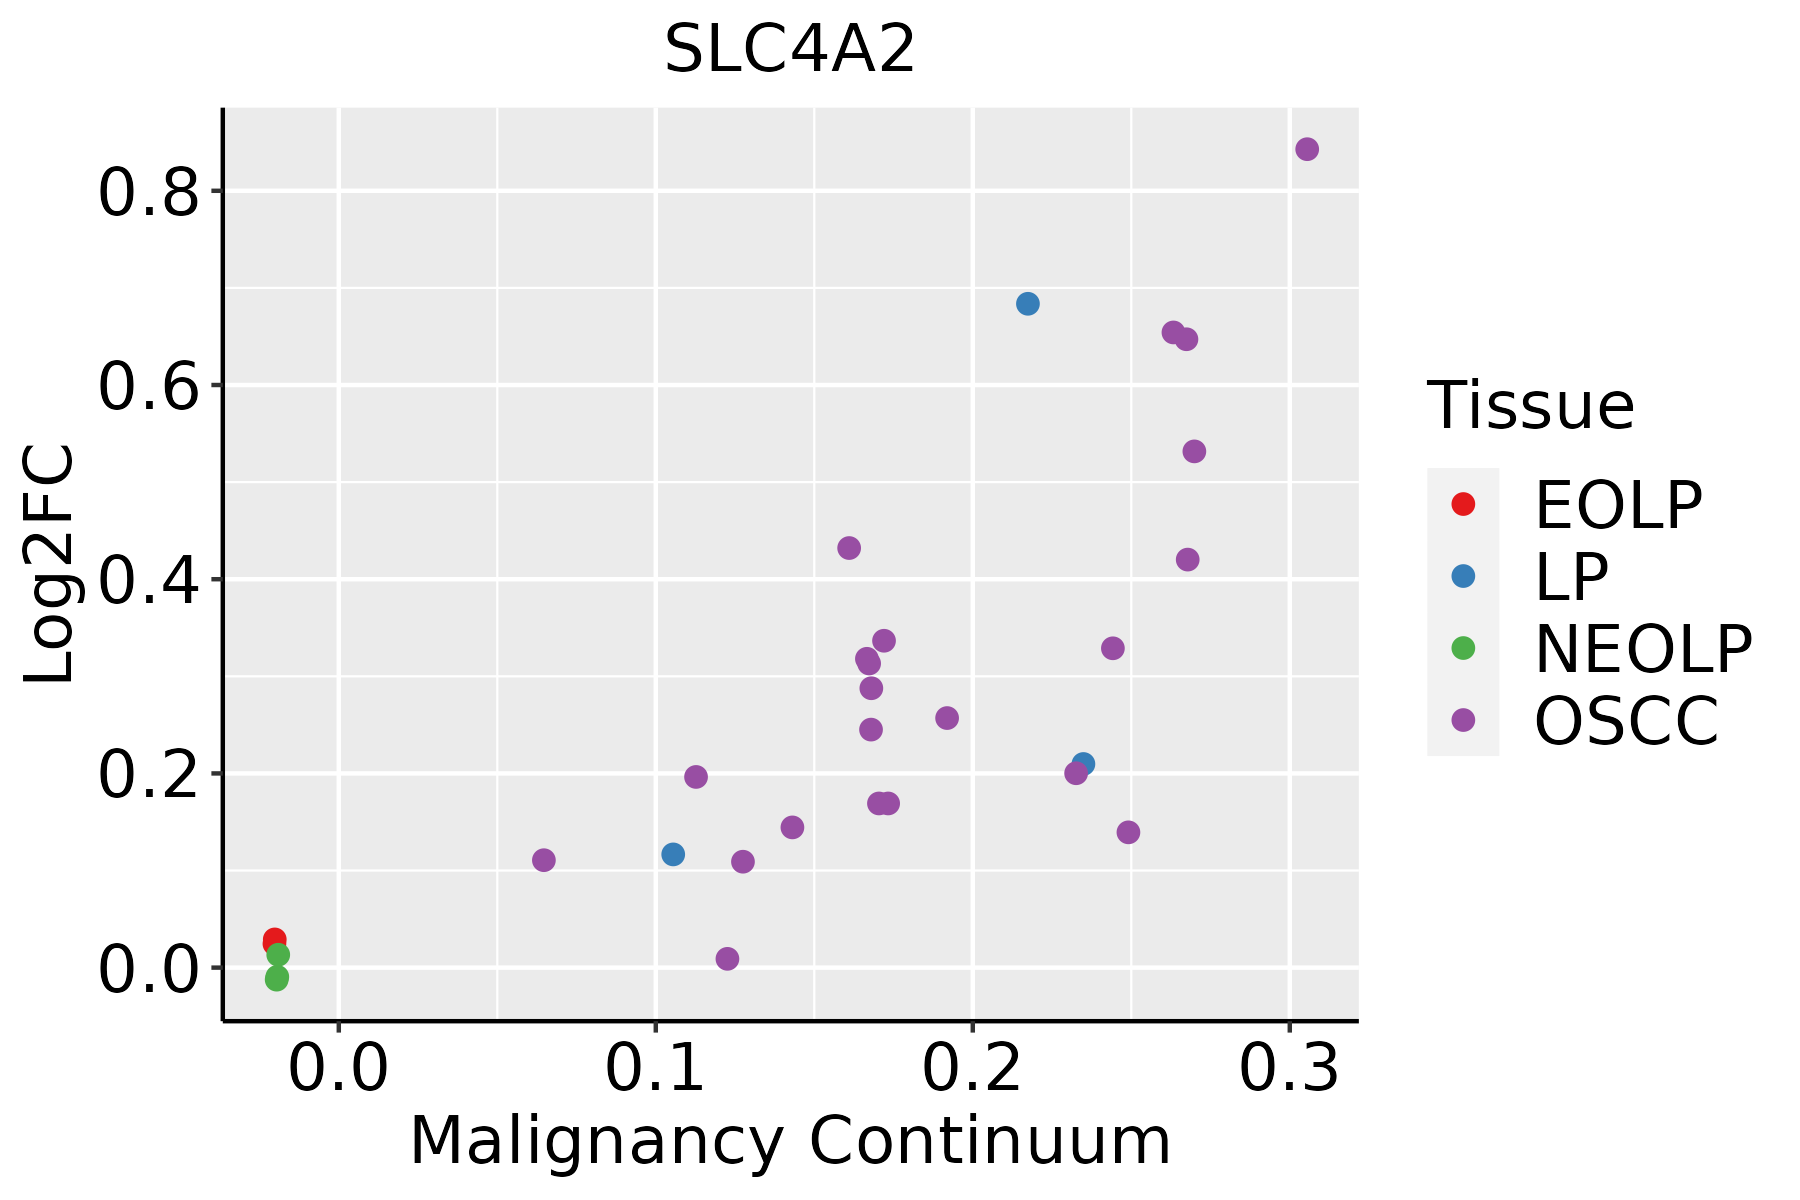 | EOLP: Erosive Oral lichen planus |
| LP: leukoplakia | ||
| NEOLP: Non-erosive oral lichen planus | ||
| OSCC: Oral squamous cell carcinoma | ||
| Thyroid | 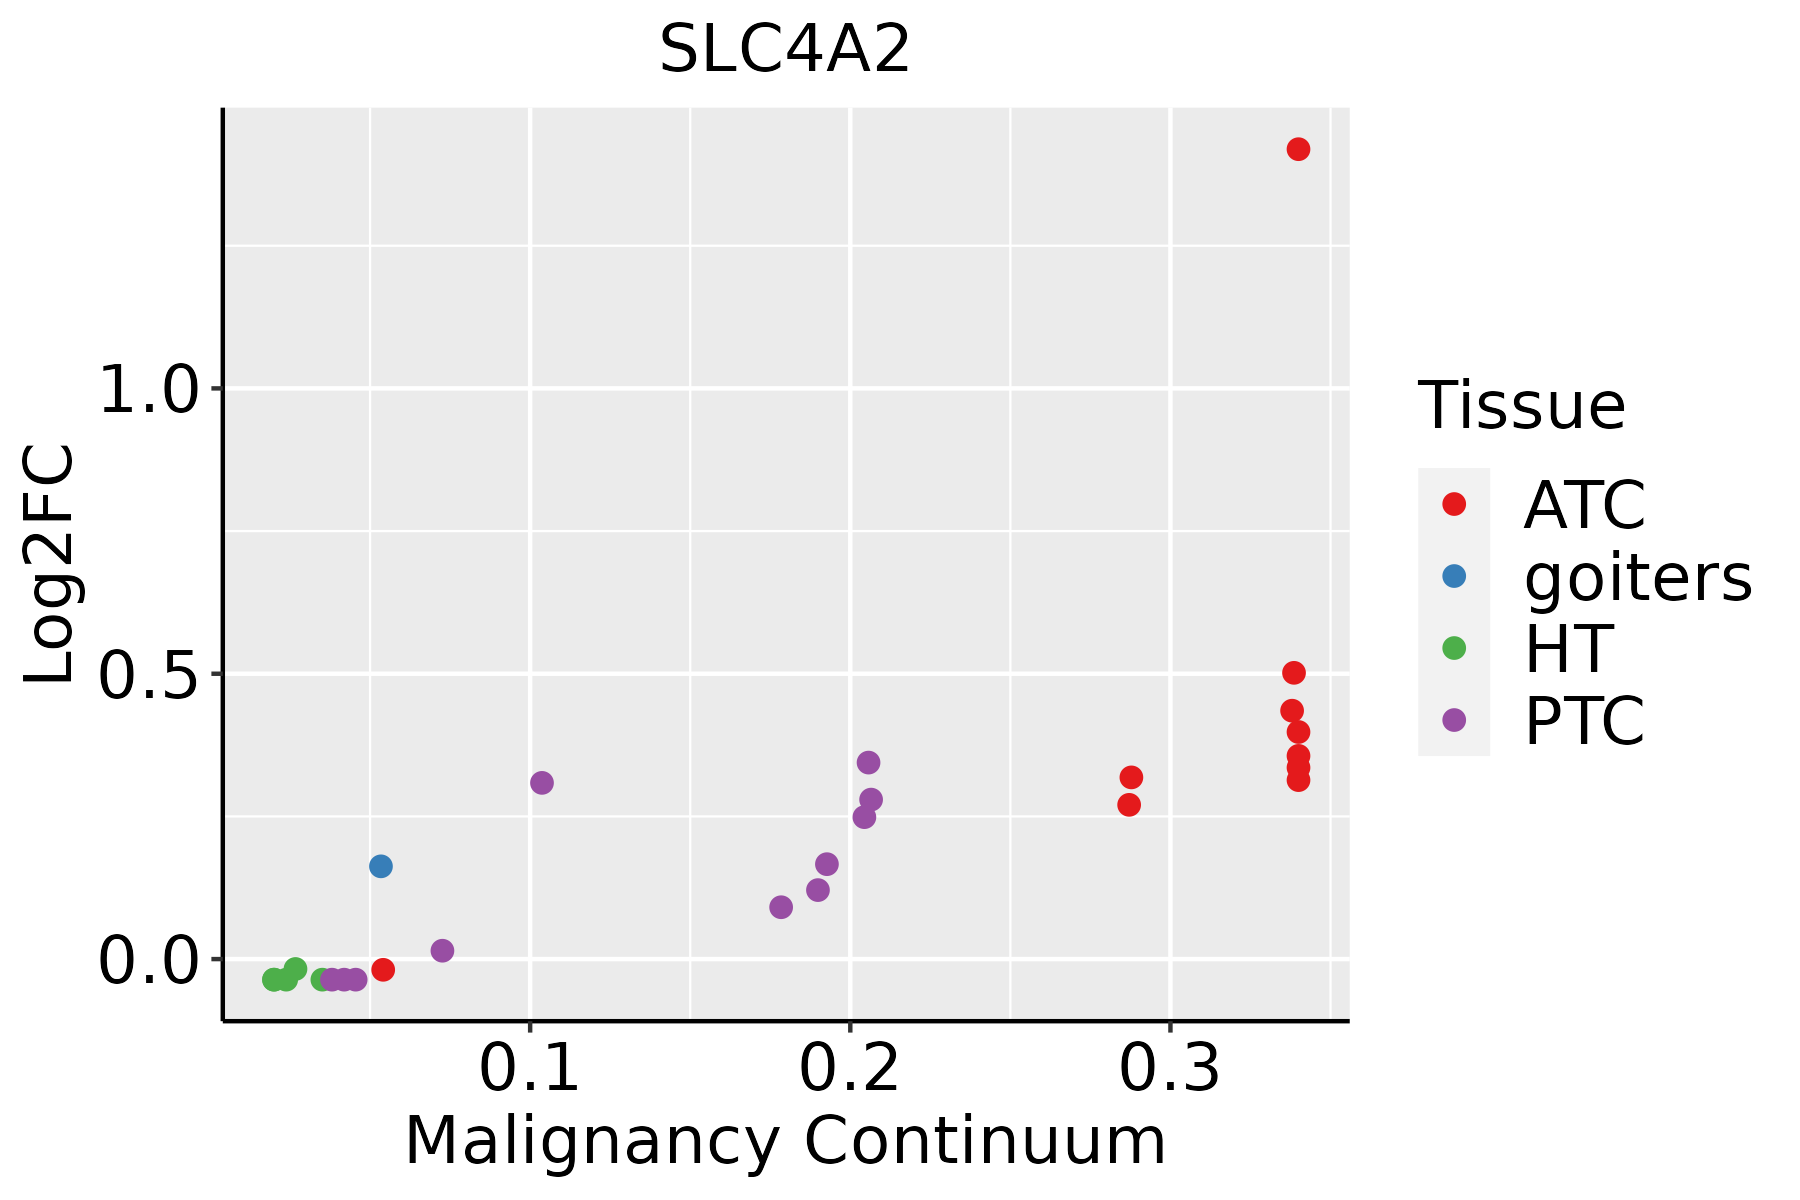 | ATC: Anaplastic thyroid cancer |
| HT: Hashimoto's thyroiditis | ||
| PTC: Papillary thyroid cancer |
| ∗log2FC in expression of this searched gene in stem-like cells from each diseased tissue sample relative to stem-like cells in normal samples in each tissue plotted against the malignancy continuum. Samples are colored based on if they are from different disease stage. |
Top |
Malignant transformation related pathway analysis |
| Find out the enriched GO biological processes and KEGG pathways involved in transition from healthy to precancer to cancer |
| Tissue | Disease Stage | Enriched GO biological Processes |
| Colorectum | AD |  |
| Colorectum | SER |  |
| Colorectum | MSS |  |
| Colorectum | MSI-H |  |
| Colorectum | FAP |  |
| ∗Top 15 enriched GO BP terms are showed in the bar plot of each disease state in each tissue. Each row represents a significant GO biological process which is colored according to the -log10(p.adjust). |
| Page: 1 2 3 4 5 6 7 8 9 |
| GO ID | Tissue | Disease Stage | Description | Gene Ratio | Bg Ratio | pvalue | p.adjust | Count |
| GO:00300045 | Liver | Cirrhotic | cellular monovalent inorganic cation homeostasis | 38/4634 | 103/18723 | 4.02e-03 | 2.17e-02 | 38 |
| GO:00306415 | Liver | Cirrhotic | regulation of cellular pH | 31/4634 | 81/18723 | 4.76e-03 | 2.50e-02 | 31 |
| GO:00068853 | Liver | Cirrhotic | regulation of pH | 33/4634 | 91/18723 | 9.39e-03 | 4.29e-02 | 33 |
| GO:01101492 | Thyroid | ATC | regulation of biomineralization | 45/6293 | 99/18723 | 9.34e-03 | 3.44e-02 | 45 |
| GO:00701672 | Thyroid | ATC | regulation of biomineral tissue development | 44/6293 | 97/18723 | 1.05e-02 | 3.81e-02 | 44 |
| Page: 1 |
| Pathway ID | Tissue | Disease Stage | Description | Gene Ratio | Bg Ratio | pvalue | p.adjust | qvalue | Count |
| Page: 1 |
Top |
Cell-cell communication analysis |
| Identification of potential cell-cell interactions between two cell types and their ligand-receptor pairs for different disease states |
| Ligand | Receptor | LRpair | Pathway | Tissue | Disease Stage |
| Page: 1 |
Top |
Single-cell gene regulatory network inference analysis |
| Find out the significant the regulons (TFs) and the target genes of each regulon across cell types for different disease states |
| TF | Cell Type | Tissue | Disease Stage | Target Gene | RSS | Regulon Activity |
| ∗The dot plots of a searched regulon are shown for all cell subpopulations in each disease state of each tissue based on the regulon specific score inferred using pySCENIC and by calculating the average expression. |
| Page: 1 |
Top |
Somatic mutation of malignant transformation related genes |
| Annotation of somatic variants for genes involved in malignant transformation |
| Hugo Symbol | Variant Class | Variant Classification | dbSNP RS | HGVSc | HGVSp | HGVSp Short | SWISSPROT | BIOTYPE | SIFT | PolyPhen | Tumor Sample Barcode | Tissue | Histology | Sex | Age | Stage | Therapy Types | Drugs | Outcome |
| SLC4A2 | SNV | Missense_Mutation | c.3697N>A | p.Glu1233Lys | p.E1233K | P04920 | protein_coding | deleterious(0.01) | possibly_damaging(0.899) | TCGA-A7-A26E-01 | Breast | breast invasive carcinoma | Female | >=65 | III/IV | Chemotherapy | cytoxan | SD | |
| SLC4A2 | SNV | Missense_Mutation | c.3039N>C | p.Gln1013His | p.Q1013H | P04920 | protein_coding | deleterious(0.05) | probably_damaging(0.989) | TCGA-AC-A23H-01 | Breast | breast invasive carcinoma | Female | >=65 | I/II | Unknown | Unknown | PD | |
| SLC4A2 | SNV | Missense_Mutation | novel | c.3019C>A | p.Leu1007Ile | p.L1007I | P04920 | protein_coding | deleterious(0.02) | probably_damaging(0.999) | TCGA-AN-A046-01 | Breast | breast invasive carcinoma | Female | >=65 | I/II | Unknown | Unknown | SD |
| SLC4A2 | SNV | Missense_Mutation | c.2725N>A | p.Ala909Thr | p.A909T | P04920 | protein_coding | tolerated(0.36) | possibly_damaging(0.643) | TCGA-AN-A0AK-01 | Breast | breast invasive carcinoma | Female | >=65 | I/II | Unknown | Unknown | SD | |
| SLC4A2 | SNV | Missense_Mutation | c.1292N>C | p.Ser431Thr | p.S431T | P04920 | protein_coding | tolerated(0.07) | possibly_damaging(0.634) | TCGA-AO-A0J2-01 | Breast | breast invasive carcinoma | Female | <65 | I/II | Chemotherapy | cyclophosphamide | SD | |
| SLC4A2 | SNV | Missense_Mutation | c.2530N>C | p.Val844Leu | p.V844L | P04920 | protein_coding | tolerated(0.3) | benign(0.014) | TCGA-BH-A0BZ-01 | Breast | breast invasive carcinoma | Female | <65 | III/IV | Chemotherapy | doxorubicin | CR | |
| SLC4A2 | SNV | Missense_Mutation | rs773194897 | c.310N>T | p.Arg104Trp | p.R104W | P04920 | protein_coding | deleterious_low_confidence(0) | possibly_damaging(0.68) | TCGA-C8-A135-01 | Breast | breast invasive carcinoma | Female | <65 | I/II | Chemotherapy | 5-fluorouracil | CR |
| SLC4A2 | SNV | Missense_Mutation | c.1009N>A | p.Glu337Lys | p.E337K | P04920 | protein_coding | deleterious(0.02) | benign(0.16) | TCGA-C8-A1HM-01 | Breast | breast invasive carcinoma | Female | >=65 | I/II | Chemotherapy | doxorubicin | CR | |
| SLC4A2 | SNV | Missense_Mutation | novel | c.163N>A | p.Gly55Arg | p.G55R | P04920 | protein_coding | tolerated_low_confidence(0.39) | benign(0.342) | TCGA-PE-A5DC-01 | Breast | breast invasive carcinoma | Female | >=65 | III/IV | Unknown | Unknown | SD |
| SLC4A2 | SNV | Missense_Mutation | novel | c.985N>C | p.Glu329Gln | p.E329Q | P04920 | protein_coding | deleterious(0.01) | benign(0.071) | TCGA-S3-AA17-01 | Breast | breast invasive carcinoma | Female | <65 | I/II | Hormone Therapy | anastrozole | SD |
| Page: 1 2 3 4 5 6 7 8 9 10 11 12 13 14 |
Top |
Related drugs of malignant transformation related genes |
| Identification of chemicals and drugs interact with genes involved in malignant transfromation |
| (DGIdb 4.0) |
| Entrez ID | Symbol | Category | Interaction Types | Drug Claim Name | Drug Name | PMIDs |
| Page: 1 |

Copyright 2023-Present -The University of Texas Health Science Center at Houston |