
|
|||||
|
 | |
| |
| |
| |
| |
| |
|
Gene: SLC4A1AP |
Gene summary for SLC4A1AP |
| Gene information | Species | Human | Gene symbol | SLC4A1AP | Gene ID | 22950 |
| Gene name | solute carrier family 4 member 1 adaptor protein | |
| Gene Alias | HLC3 | |
| Cytomap | 2p23.3 | |
| Gene Type | protein-coding | GO ID | GO:0005575 | UniProtAcc | Q9BWU0 |
Top |
Malignant transformation analysis |
| Identification of the aberrant gene expression in precancerous and cancerous lesions by comparing the gene expression of stem-like cells in diseased tissues with normal stem cells |
| Entrez ID | Symbol | Replicates | Species | Organ | Tissue | Adj P-value | Log2FC | Malignancy |
| 22950 | SLC4A1AP | LZE4T | Human | Esophagus | ESCC | 1.46e-14 | 6.38e-01 | 0.0811 |
| 22950 | SLC4A1AP | LZE7T | Human | Esophagus | ESCC | 3.20e-05 | 3.66e-01 | 0.0667 |
| 22950 | SLC4A1AP | LZE8T | Human | Esophagus | ESCC | 1.34e-02 | 1.58e-01 | 0.067 |
| 22950 | SLC4A1AP | LZE24T | Human | Esophagus | ESCC | 8.18e-10 | 3.45e-01 | 0.0596 |
| 22950 | SLC4A1AP | LZE21T | Human | Esophagus | ESCC | 2.38e-05 | 3.85e-01 | 0.0655 |
| 22950 | SLC4A1AP | LZE6T | Human | Esophagus | ESCC | 1.26e-02 | 1.56e-01 | 0.0845 |
| 22950 | SLC4A1AP | P1T-E | Human | Esophagus | ESCC | 1.77e-09 | 3.99e-01 | 0.0875 |
| 22950 | SLC4A1AP | P2T-E | Human | Esophagus | ESCC | 1.86e-47 | 9.38e-01 | 0.1177 |
| 22950 | SLC4A1AP | P4T-E | Human | Esophagus | ESCC | 2.12e-27 | 6.45e-01 | 0.1323 |
| 22950 | SLC4A1AP | P5T-E | Human | Esophagus | ESCC | 3.97e-25 | 4.95e-01 | 0.1327 |
| 22950 | SLC4A1AP | P8T-E | Human | Esophagus | ESCC | 2.27e-20 | 2.92e-01 | 0.0889 |
| 22950 | SLC4A1AP | P9T-E | Human | Esophagus | ESCC | 6.50e-16 | 3.99e-01 | 0.1131 |
| 22950 | SLC4A1AP | P10T-E | Human | Esophagus | ESCC | 2.68e-27 | 4.18e-01 | 0.116 |
| 22950 | SLC4A1AP | P11T-E | Human | Esophagus | ESCC | 8.77e-15 | 7.33e-01 | 0.1426 |
| 22950 | SLC4A1AP | P12T-E | Human | Esophagus | ESCC | 1.59e-30 | 5.65e-01 | 0.1122 |
| 22950 | SLC4A1AP | P15T-E | Human | Esophagus | ESCC | 2.19e-28 | 5.94e-01 | 0.1149 |
| 22950 | SLC4A1AP | P16T-E | Human | Esophagus | ESCC | 9.18e-26 | 4.77e-01 | 0.1153 |
| 22950 | SLC4A1AP | P17T-E | Human | Esophagus | ESCC | 1.18e-16 | 4.71e-01 | 0.1278 |
| 22950 | SLC4A1AP | P19T-E | Human | Esophagus | ESCC | 1.97e-02 | 6.57e-01 | 0.1662 |
| 22950 | SLC4A1AP | P20T-E | Human | Esophagus | ESCC | 2.87e-20 | 4.88e-01 | 0.1124 |
| Page: 1 2 3 4 5 |
| Tissue | Expression Dynamics | Abbreviation |
| Esophagus | 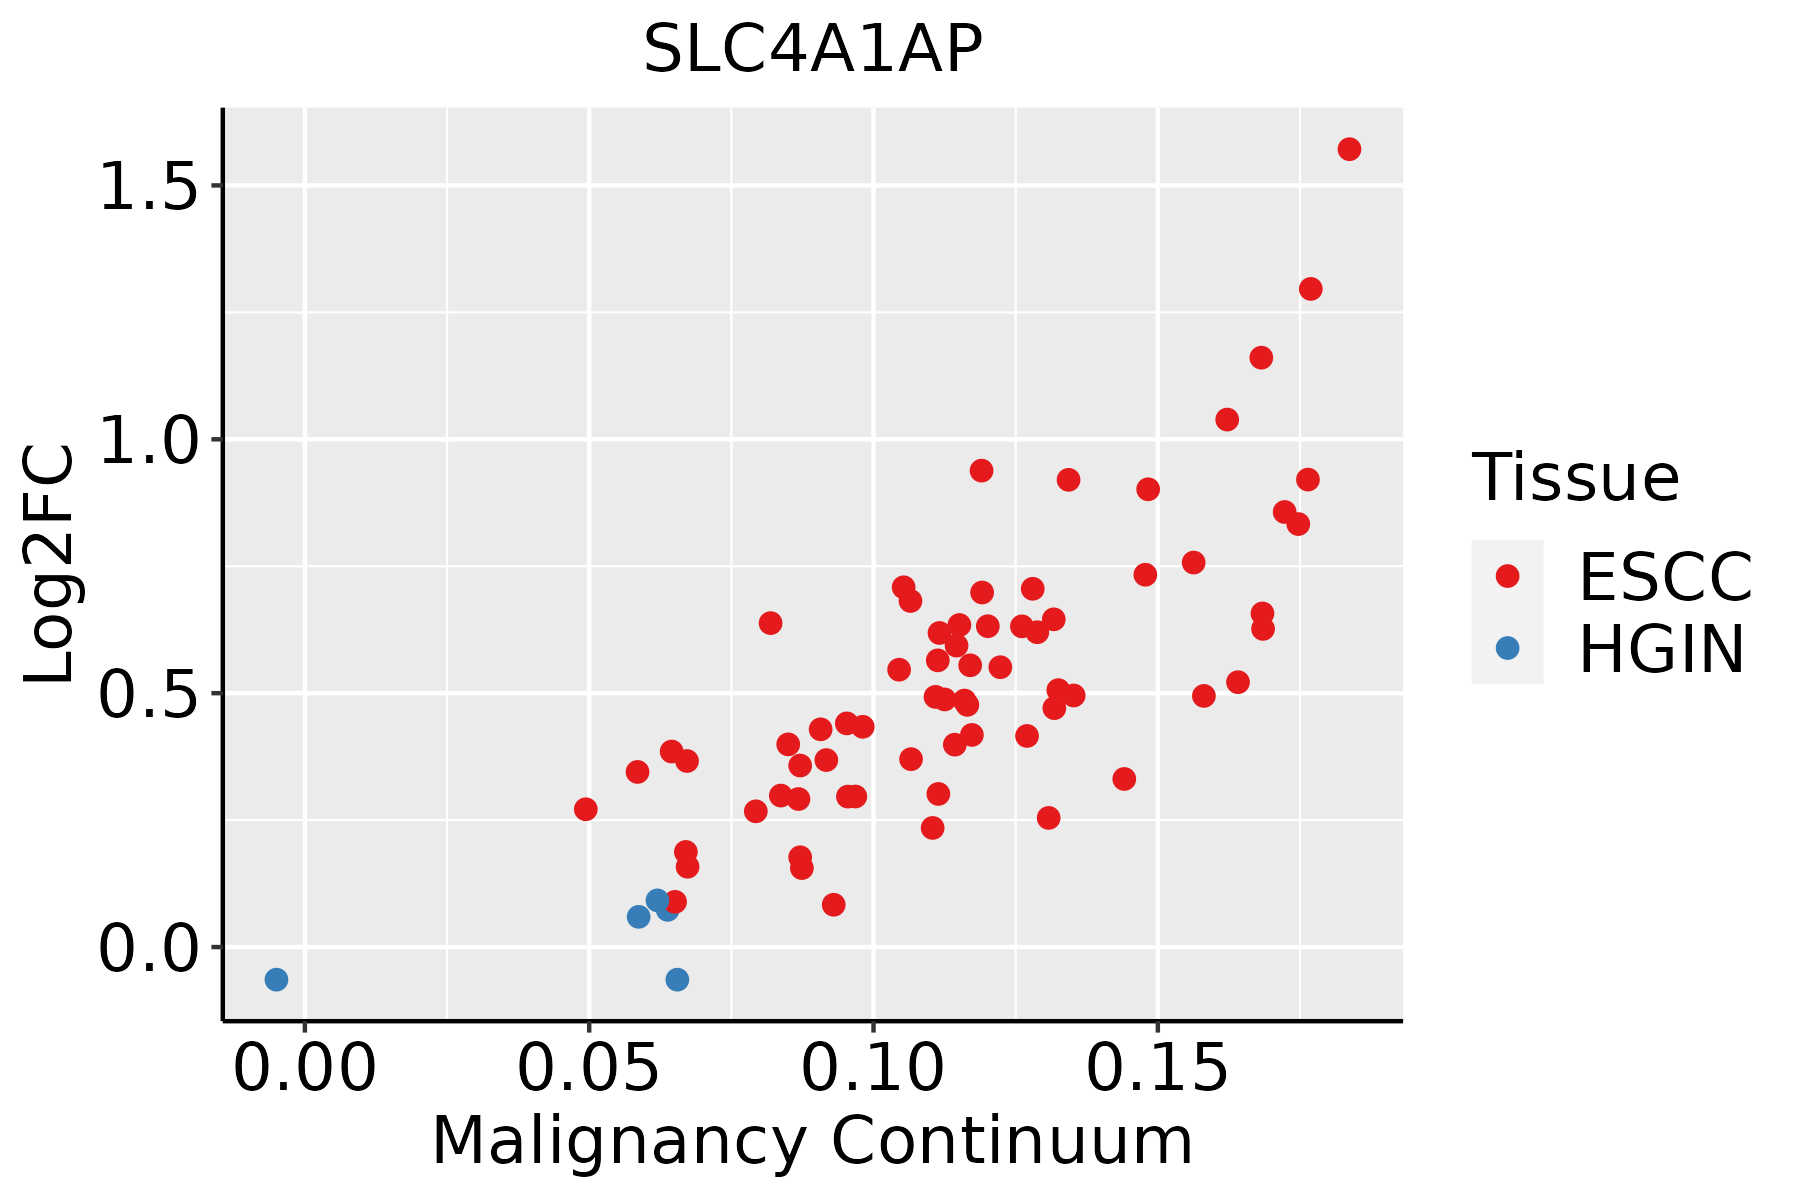 | ESCC: Esophageal squamous cell carcinoma |
| HGIN: High-grade intraepithelial neoplasias | ||
| LGIN: Low-grade intraepithelial neoplasias | ||
| Liver |  | HCC: Hepatocellular carcinoma |
| NAFLD: Non-alcoholic fatty liver disease | ||
| Oral Cavity | 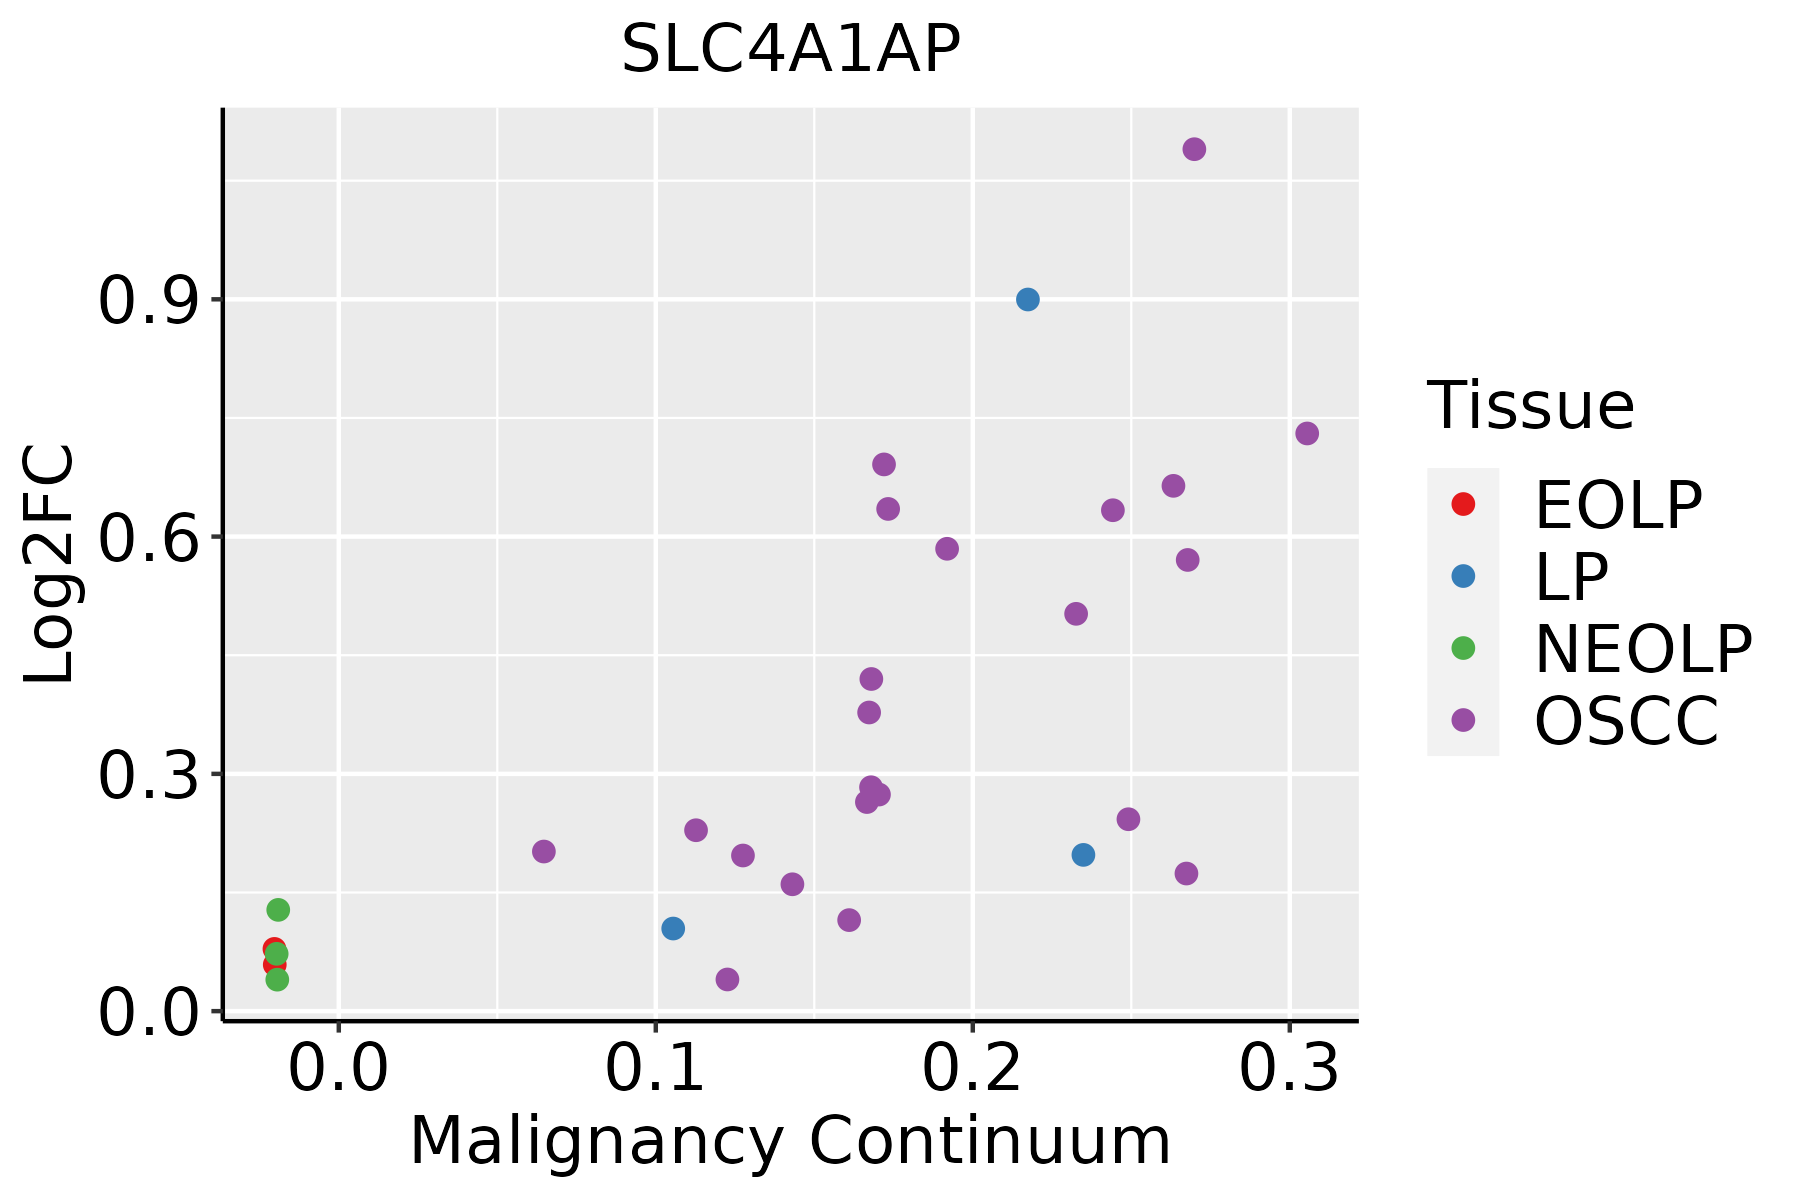 | EOLP: Erosive Oral lichen planus |
| LP: leukoplakia | ||
| NEOLP: Non-erosive oral lichen planus | ||
| OSCC: Oral squamous cell carcinoma | ||
| Skin | 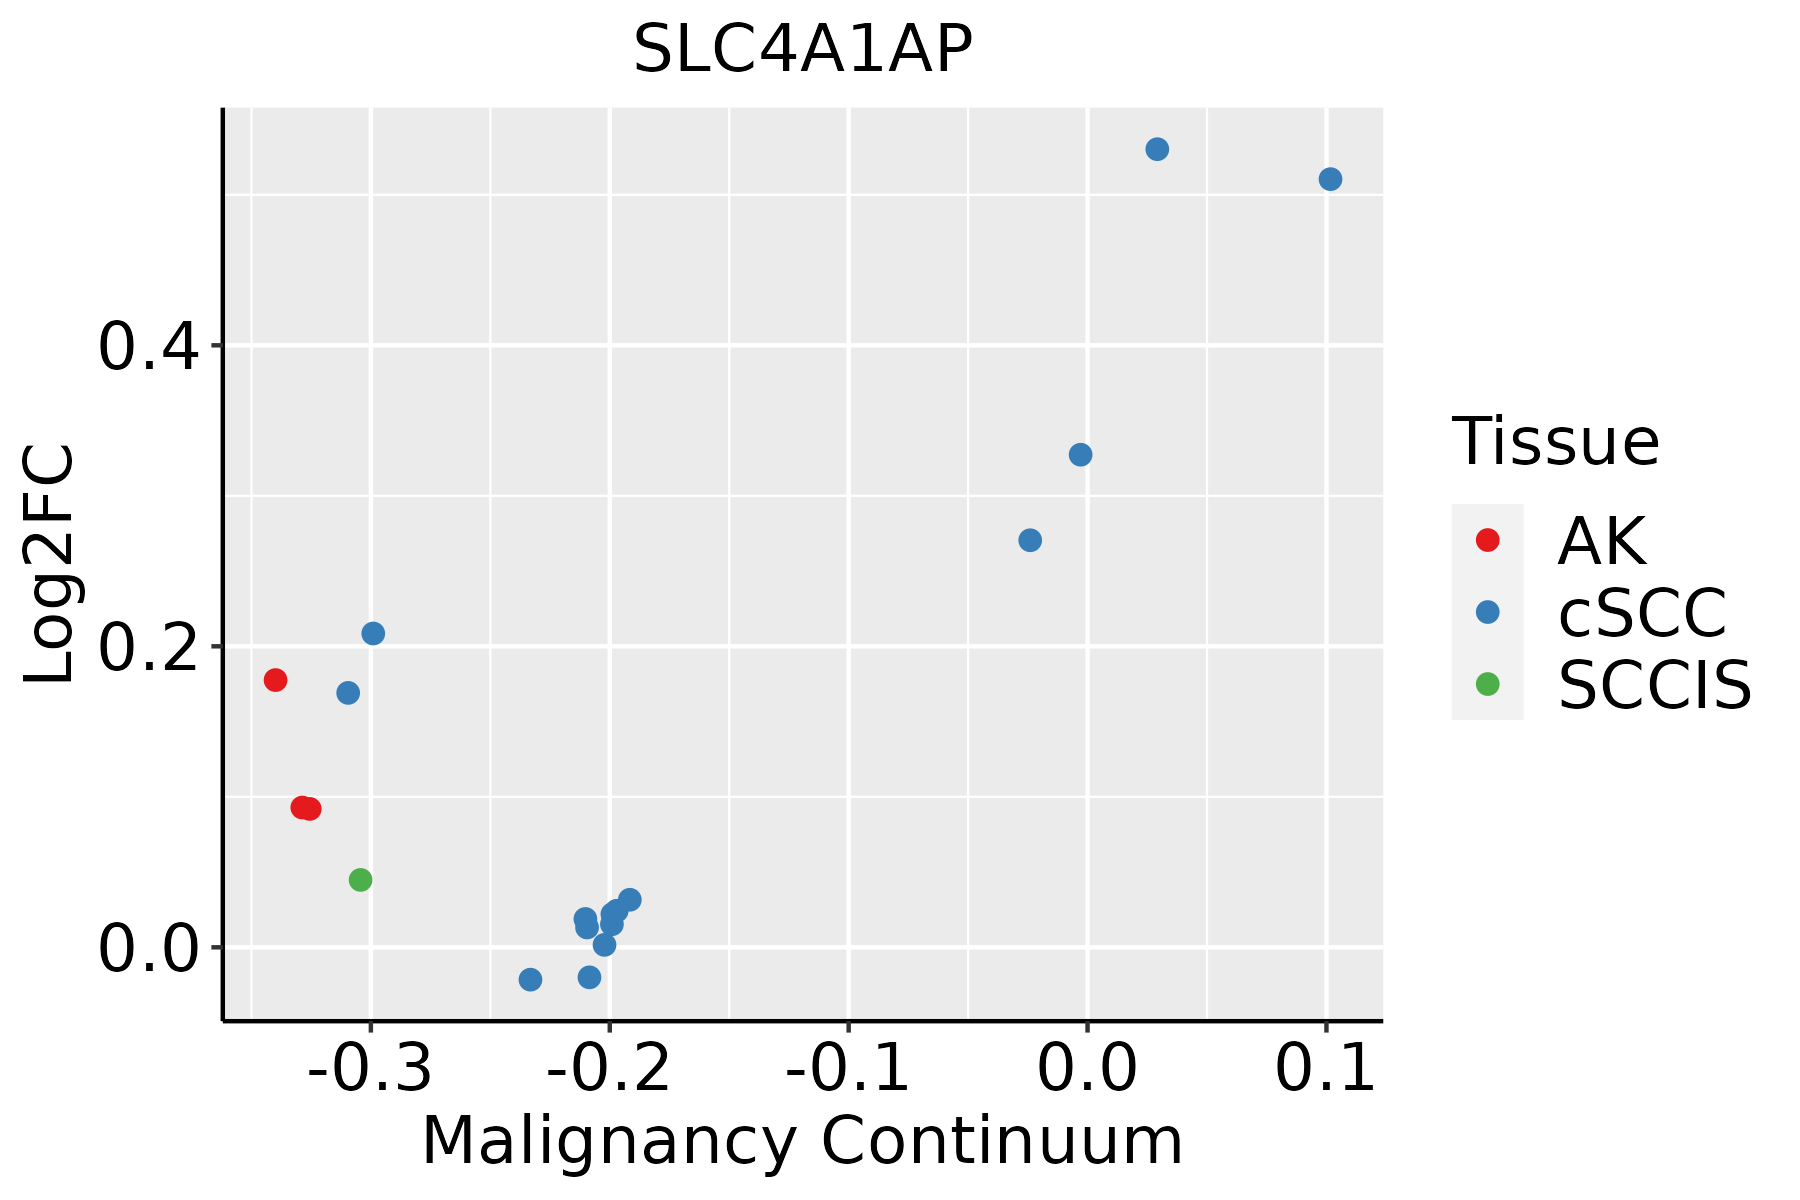 | AK: Actinic keratosis |
| cSCC: Cutaneous squamous cell carcinoma | ||
| SCCIS:squamous cell carcinoma in situ |
| ∗log2FC in expression of this searched gene in stem-like cells from each diseased tissue sample relative to stem-like cells in normal samples in each tissue plotted against the malignancy continuum. Samples are colored based on if they are from different disease stage. |
Top |
Malignant transformation related pathway analysis |
| Find out the enriched GO biological processes and KEGG pathways involved in transition from healthy to precancer to cancer |
| Tissue | Disease Stage | Enriched GO biological Processes |
| Colorectum | AD |  |
| Colorectum | SER |  |
| Colorectum | MSS |  |
| Colorectum | MSI-H |  |
| Colorectum | FAP |  |
| ∗Top 15 enriched GO BP terms are showed in the bar plot of each disease state in each tissue. Each row represents a significant GO biological process which is colored according to the -log10(p.adjust). |
| Page: 1 2 3 4 5 6 7 8 9 |
| GO ID | Tissue | Disease Stage | Description | Gene Ratio | Bg Ratio | pvalue | p.adjust | Count |
| Page: 1 |
| Pathway ID | Tissue | Disease Stage | Description | Gene Ratio | Bg Ratio | pvalue | p.adjust | qvalue | Count |
| Page: 1 |
Top |
Cell-cell communication analysis |
| Identification of potential cell-cell interactions between two cell types and their ligand-receptor pairs for different disease states |
| Ligand | Receptor | LRpair | Pathway | Tissue | Disease Stage |
| Page: 1 |
Top |
Single-cell gene regulatory network inference analysis |
| Find out the significant the regulons (TFs) and the target genes of each regulon across cell types for different disease states |
| TF | Cell Type | Tissue | Disease Stage | Target Gene | RSS | Regulon Activity |
| ∗The dot plots of a searched regulon are shown for all cell subpopulations in each disease state of each tissue based on the regulon specific score inferred using pySCENIC and by calculating the average expression. |
| Page: 1 |
Top |
Somatic mutation of malignant transformation related genes |
| Annotation of somatic variants for genes involved in malignant transformation |
| Hugo Symbol | Variant Class | Variant Classification | dbSNP RS | HGVSc | HGVSp | HGVSp Short | SWISSPROT | BIOTYPE | SIFT | PolyPhen | Tumor Sample Barcode | Tissue | Histology | Sex | Age | Stage | Therapy Types | Drugs | Outcome |
| SLC4A1AP | SNV | Missense_Mutation | novel | c.499N>A | p.Tyr167Asn | p.Y167N | Q9BWU0 | protein_coding | deleterious(0) | probably_damaging(0.973) | TCGA-AN-A049-01 | Breast | breast invasive carcinoma | Female | <65 | I/II | Unknown | Unknown | SD |
| SLC4A1AP | SNV | Missense_Mutation | c.1414N>T | p.Leu472Phe | p.L472F | Q9BWU0 | protein_coding | deleterious(0) | possibly_damaging(0.766) | TCGA-D8-A1JA-01 | Breast | breast invasive carcinoma | Female | <65 | III/IV | Chemotherapy | adriamycin | PD | |
| SLC4A1AP | SNV | Missense_Mutation | c.2353G>C | p.Asp785His | p.D785H | Q9BWU0 | protein_coding | deleterious(0) | probably_damaging(0.998) | TCGA-D8-A27G-01 | Breast | breast invasive carcinoma | Female | >=65 | I/II | Unknown | Unknown | SD | |
| SLC4A1AP | SNV | Missense_Mutation | rs746729357 | c.2170A>G | p.Ser724Gly | p.S724G | Q9BWU0 | protein_coding | tolerated(0.13) | benign(0) | TCGA-E2-A9RU-01 | Breast | breast invasive carcinoma | Female | >=65 | III/IV | Hormone Therapy | arimidex | SD |
| SLC4A1AP | SNV | Missense_Mutation | novel | c.53N>T | p.Ser18Leu | p.S18L | Q9BWU0 | protein_coding | deleterious_low_confidence(0.01) | benign(0) | TCGA-E9-A3QA-01 | Breast | breast invasive carcinoma | Female | <65 | I/II | Unknown | Unknown | SD |
| SLC4A1AP | insertion | Frame_Shift_Ins | novel | c.1754_1755insTAAAAGTC | p.Glu585AspfsTer5 | p.E585Dfs*5 | Q9BWU0 | protein_coding | TCGA-A7-A26I-01 | Breast | breast invasive carcinoma | Female | >=65 | I/II | Chemotherapy | cytoxan | SD | ||
| SLC4A1AP | insertion | Nonsense_Mutation | novel | c.500_501insGGGACCATTTCAAAACAGGGAAGT | p.Tyr167delinsTer | p.Y167delins* | Q9BWU0 | protein_coding | TCGA-AN-A049-01 | Breast | breast invasive carcinoma | Female | <65 | I/II | Unknown | Unknown | SD | ||
| SLC4A1AP | insertion | Frame_Shift_Ins | novel | c.164_165insCCTTACTTTACCGAAAGGAGCACGAAGAACA | p.Met55IlefsTer13 | p.M55Ifs*13 | Q9BWU0 | protein_coding | TCGA-AO-A0J9-01 | Breast | breast invasive carcinoma | Female | <65 | III/IV | Chemotherapy | cyclophosphamide | PD | ||
| SLC4A1AP | insertion | Frame_Shift_Ins | novel | c.1761_1762insGTCACTAACAT | p.Lys588ValfsTer28 | p.K588Vfs*28 | Q9BWU0 | protein_coding | TCGA-AR-A0U0-01 | Breast | breast invasive carcinoma | Female | >=65 | I/II | Unknown | Unknown | SD | ||
| SLC4A1AP | SNV | Missense_Mutation | c.111N>C | p.Lys37Asn | p.K37N | Q9BWU0 | protein_coding | tolerated_low_confidence(0.29) | benign(0.007) | TCGA-DR-A0ZM-01 | Cervix | cervical & endocervical cancer | Female | <65 | III/IV | Unspecific | Cisplatin | SD |
| Page: 1 2 3 4 5 6 |
Top |
Related drugs of malignant transformation related genes |
| Identification of chemicals and drugs interact with genes involved in malignant transfromation |
| (DGIdb 4.0) |
| Entrez ID | Symbol | Category | Interaction Types | Drug Claim Name | Drug Name | PMIDs |
| Page: 1 |

Copyright 2023-Present -The University of Texas Health Science Center at Houston |