
|
|||||
|
 | |
| |
| |
| |
| |
| |
|
Gene: SLC4A11 |
Gene summary for SLC4A11 |
| Gene information | Species | Human | Gene symbol | SLC4A11 | Gene ID | 83959 |
| Gene name | solute carrier family 4 member 11 | |
| Gene Alias | BTR1 | |
| Cytomap | 20p13 | |
| Gene Type | protein-coding | GO ID | GO:0006810 | UniProtAcc | Q8NBS3 |
Top |
Malignant transformation analysis |
| Identification of the aberrant gene expression in precancerous and cancerous lesions by comparing the gene expression of stem-like cells in diseased tissues with normal stem cells |
| Entrez ID | Symbol | Replicates | Species | Organ | Tissue | Adj P-value | Log2FC | Malignancy |
| 83959 | SLC4A11 | LZE7T | Human | Esophagus | ESCC | 6.67e-06 | 3.53e-01 | 0.0667 |
| 83959 | SLC4A11 | P2T-E | Human | Esophagus | ESCC | 5.76e-04 | -1.03e-01 | 0.1177 |
| 83959 | SLC4A11 | P4T-E | Human | Esophagus | ESCC | 9.57e-05 | 6.49e-03 | 0.1323 |
| 83959 | SLC4A11 | P8T-E | Human | Esophagus | ESCC | 4.58e-10 | 9.88e-02 | 0.0889 |
| 83959 | SLC4A11 | P9T-E | Human | Esophagus | ESCC | 1.25e-02 | -6.78e-02 | 0.1131 |
| 83959 | SLC4A11 | P10T-E | Human | Esophagus | ESCC | 6.48e-07 | -3.07e-02 | 0.116 |
| 83959 | SLC4A11 | P12T-E | Human | Esophagus | ESCC | 8.03e-12 | 2.30e-01 | 0.1122 |
| 83959 | SLC4A11 | P16T-E | Human | Esophagus | ESCC | 1.08e-07 | -1.16e-02 | 0.1153 |
| 83959 | SLC4A11 | P22T-E | Human | Esophagus | ESCC | 1.60e-04 | -1.20e-01 | 0.1236 |
| 83959 | SLC4A11 | P23T-E | Human | Esophagus | ESCC | 1.14e-05 | 1.47e-01 | 0.108 |
| 83959 | SLC4A11 | P24T-E | Human | Esophagus | ESCC | 4.92e-06 | -8.38e-02 | 0.1287 |
| 83959 | SLC4A11 | P26T-E | Human | Esophagus | ESCC | 2.01e-14 | 4.02e-01 | 0.1276 |
| 83959 | SLC4A11 | P27T-E | Human | Esophagus | ESCC | 6.84e-08 | 1.92e-01 | 0.1055 |
| 83959 | SLC4A11 | P28T-E | Human | Esophagus | ESCC | 5.02e-14 | 2.50e-01 | 0.1149 |
| 83959 | SLC4A11 | P30T-E | Human | Esophagus | ESCC | 4.22e-05 | 2.64e-01 | 0.137 |
| 83959 | SLC4A11 | P31T-E | Human | Esophagus | ESCC | 7.58e-05 | 1.36e-01 | 0.1251 |
| 83959 | SLC4A11 | P32T-E | Human | Esophagus | ESCC | 1.80e-02 | -1.30e-01 | 0.1666 |
| 83959 | SLC4A11 | P40T-E | Human | Esophagus | ESCC | 4.16e-02 | 3.57e-02 | 0.109 |
| 83959 | SLC4A11 | P42T-E | Human | Esophagus | ESCC | 4.34e-04 | -1.92e-02 | 0.1175 |
| 83959 | SLC4A11 | P47T-E | Human | Esophagus | ESCC | 2.16e-04 | -9.02e-02 | 0.1067 |
| Page: 1 2 |
| Tissue | Expression Dynamics | Abbreviation |
| Esophagus | 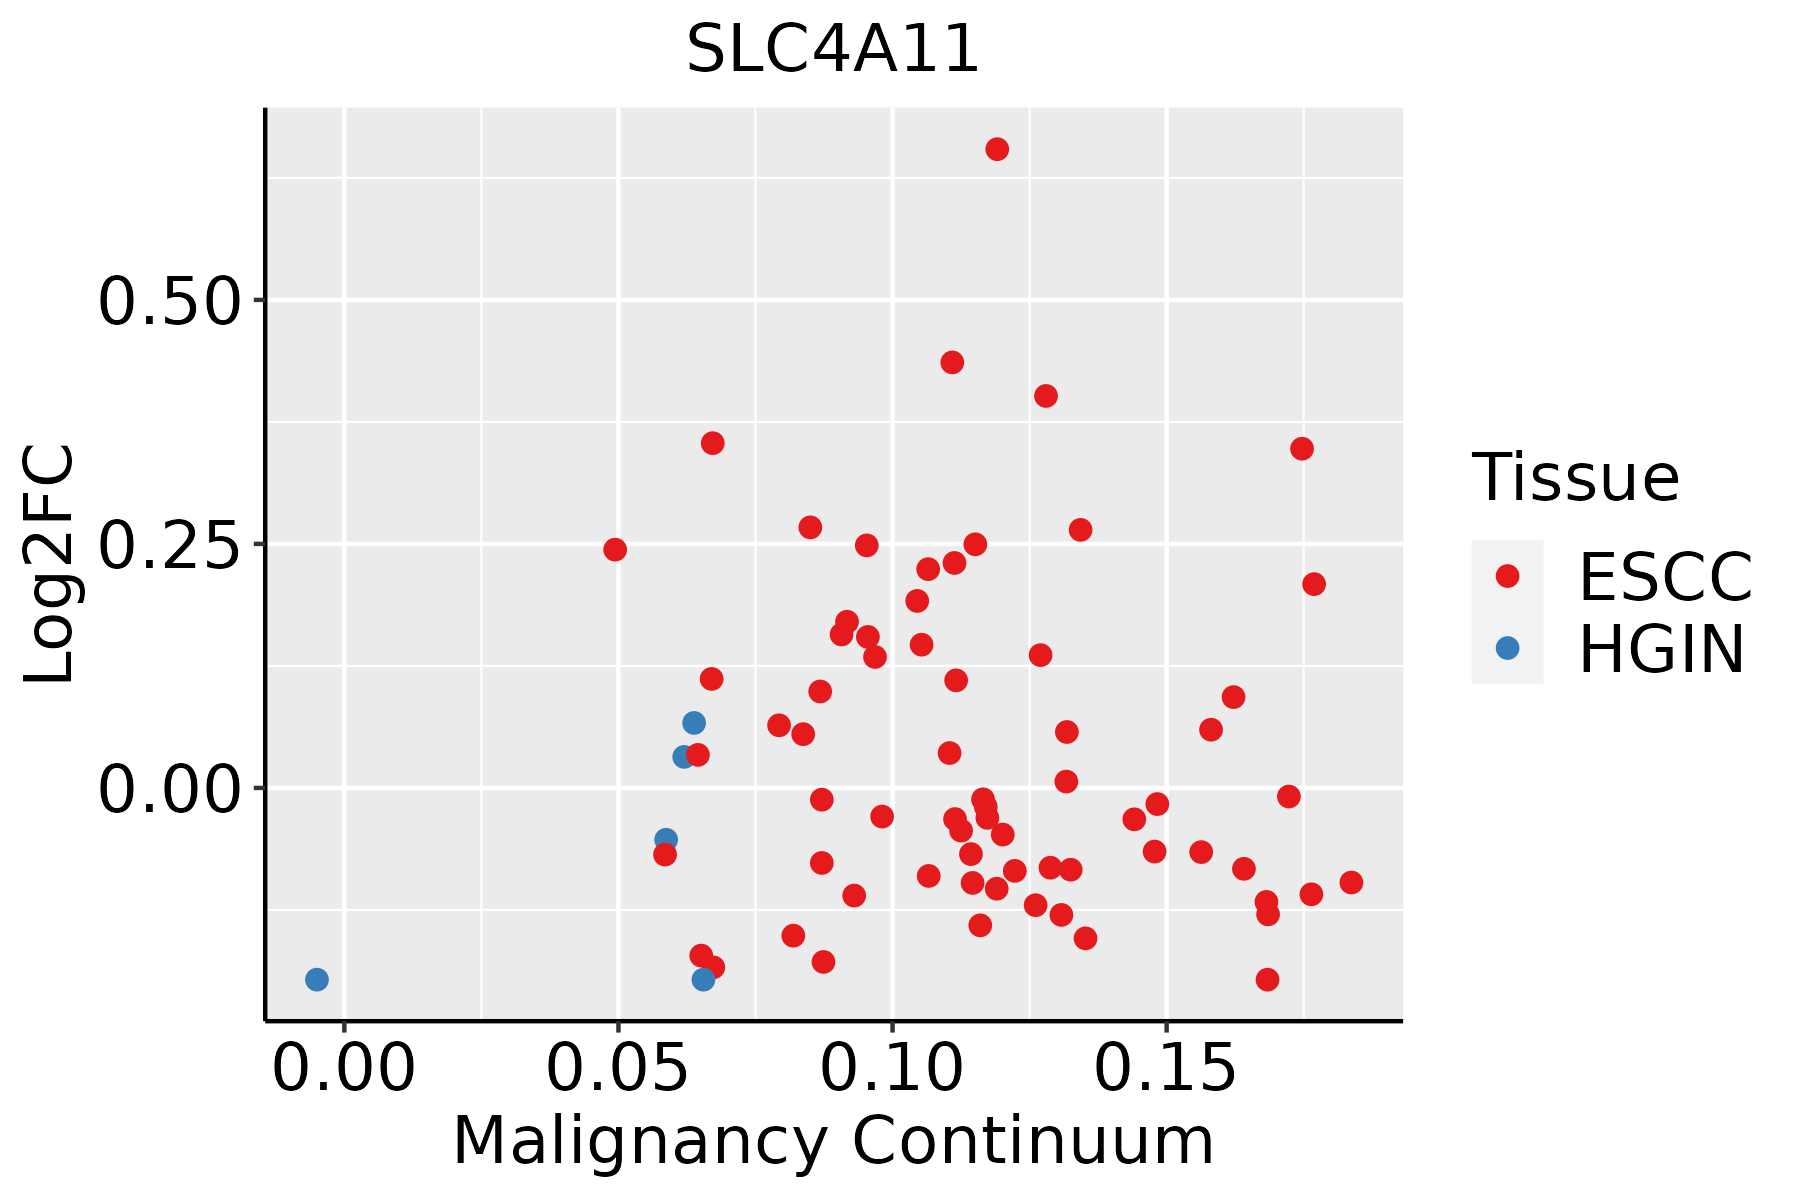 | ESCC: Esophageal squamous cell carcinoma |
| HGIN: High-grade intraepithelial neoplasias | ||
| LGIN: Low-grade intraepithelial neoplasias |
| ∗log2FC in expression of this searched gene in stem-like cells from each diseased tissue sample relative to stem-like cells in normal samples in each tissue plotted against the malignancy continuum. Samples are colored based on if they are from different disease stage. |
Top |
Malignant transformation related pathway analysis |
| Find out the enriched GO biological processes and KEGG pathways involved in transition from healthy to precancer to cancer |
| Tissue | Disease Stage | Enriched GO biological Processes |
| Colorectum | AD |  |
| Colorectum | SER |  |
| Colorectum | MSS |  |
| Colorectum | MSI-H |  |
| Colorectum | FAP |  |
| ∗Top 15 enriched GO BP terms are showed in the bar plot of each disease state in each tissue. Each row represents a significant GO biological process which is colored according to the -log10(p.adjust). |
| Page: 1 2 3 4 5 6 7 8 9 |
| GO ID | Tissue | Disease Stage | Description | Gene Ratio | Bg Ratio | pvalue | p.adjust | Count |
| GO:0006979111 | Esophagus | ESCC | response to oxidative stress | 303/8552 | 446/18723 | 7.15e-22 | 1.30e-19 | 303 |
| GO:0062197111 | Esophagus | ESCC | cellular response to chemical stress | 234/8552 | 337/18723 | 5.37e-19 | 5.97e-17 | 234 |
| GO:0034599111 | Esophagus | ESCC | cellular response to oxidative stress | 197/8552 | 288/18723 | 3.76e-15 | 2.15e-13 | 197 |
| GO:007121419 | Esophagus | ESCC | cellular response to abiotic stimulus | 206/8552 | 331/18723 | 7.52e-10 | 1.88e-08 | 206 |
| GO:010400419 | Esophagus | ESCC | cellular response to environmental stimulus | 206/8552 | 331/18723 | 7.52e-10 | 1.88e-08 | 206 |
| GO:00069707 | Esophagus | ESCC | response to osmotic stress | 57/8552 | 84/18723 | 3.26e-05 | 2.70e-04 | 57 |
| GO:005188110 | Esophagus | ESCC | regulation of mitochondrial membrane potential | 51/8552 | 74/18723 | 4.42e-05 | 3.51e-04 | 51 |
| GO:00488638 | Esophagus | ESCC | stem cell differentiation | 122/8552 | 206/18723 | 5.95e-05 | 4.59e-04 | 122 |
| GO:00714707 | Esophagus | ESCC | cellular response to osmotic stress | 31/8552 | 41/18723 | 9.32e-05 | 6.68e-04 | 31 |
| GO:200073614 | Esophagus | ESCC | regulation of stem cell differentiation | 39/8552 | 58/18723 | 7.43e-04 | 3.86e-03 | 39 |
| GO:0006971 | Esophagus | ESCC | hypotonic response | 10/8552 | 11/18723 | 2.54e-03 | 1.08e-02 | 10 |
| GO:190260018 | Esophagus | ESCC | proton transmembrane transport | 88/8552 | 157/18723 | 5.62e-03 | 2.10e-02 | 88 |
| Page: 1 |
| Pathway ID | Tissue | Disease Stage | Description | Gene Ratio | Bg Ratio | pvalue | p.adjust | qvalue | Count |
| Page: 1 |
Top |
Cell-cell communication analysis |
| Identification of potential cell-cell interactions between two cell types and their ligand-receptor pairs for different disease states |
| Ligand | Receptor | LRpair | Pathway | Tissue | Disease Stage |
| Page: 1 |
Top |
Single-cell gene regulatory network inference analysis |
| Find out the significant the regulons (TFs) and the target genes of each regulon across cell types for different disease states |
| TF | Cell Type | Tissue | Disease Stage | Target Gene | RSS | Regulon Activity |
| ∗The dot plots of a searched regulon are shown for all cell subpopulations in each disease state of each tissue based on the regulon specific score inferred using pySCENIC and by calculating the average expression. |
| Page: 1 |
Top |
Somatic mutation of malignant transformation related genes |
| Annotation of somatic variants for genes involved in malignant transformation |
| Hugo Symbol | Variant Class | Variant Classification | dbSNP RS | HGVSc | HGVSp | HGVSp Short | SWISSPROT | BIOTYPE | SIFT | PolyPhen | Tumor Sample Barcode | Tissue | Histology | Sex | Age | Stage | Therapy Types | Drugs | Outcome |
| SLC4A11 | SNV | Missense_Mutation | novel | c.279N>C | p.Glu93Asp | p.E93D | Q8NBS3 | protein_coding | tolerated(0.12) | benign(0.205) | TCGA-A7-A4SA-01 | Breast | breast invasive carcinoma | Female | <65 | I/II | Chemotherapy | doxorubicin | CR |
| SLC4A11 | SNV | Missense_Mutation | novel | c.1552G>C | p.Glu518Gln | p.E518Q | Q8NBS3 | protein_coding | deleterious(0) | probably_damaging(0.999) | TCGA-AN-A0XW-01 | Breast | breast invasive carcinoma | Female | <65 | III/IV | Unknown | Unknown | SD |
| SLC4A11 | SNV | Missense_Mutation | c.2657N>T | p.Pro886Leu | p.P886L | Q8NBS3 | protein_coding | deleterious(0) | probably_damaging(0.966) | TCGA-BH-A0BZ-01 | Breast | breast invasive carcinoma | Female | <65 | III/IV | Chemotherapy | doxorubicin | CR | |
| SLC4A11 | insertion | In_Frame_Ins | novel | c.2208_2209insGAGCATACATTGACCTTCCTTTATTTAAGAAAGCAGAGAGTAAGA | p.Gly736_Leu737insGluHisThrLeuThrPheLeuTyrLeuArgLysGlnArgValArg | p.G736_L737insEHTLTFLYLRKQRVR | Q8NBS3 | protein_coding | TCGA-B6-A0I8-01 | Breast | breast invasive carcinoma | Female | <65 | I/II | Unknown | Unknown | PD | ||
| SLC4A11 | SNV | Missense_Mutation | c.448N>C | p.Glu150Gln | p.E150Q | Q8NBS3 | protein_coding | deleterious(0) | probably_damaging(0.999) | TCGA-IR-A3LK-01 | Cervix | cervical & endocervical cancer | Female | >=65 | I/II | Chemotherapy | cisplatin | PD | |
| SLC4A11 | SNV | Missense_Mutation | novel | c.39N>C | p.Glu13Asp | p.E13D | Q8NBS3 | protein_coding | deleterious_low_confidence(0.04) | probably_damaging(0.987) | TCGA-VS-A958-01 | Cervix | cervical & endocervical cancer | Female | <65 | I/II | Chemotherapy | cisplatin | CR |
| SLC4A11 | SNV | Missense_Mutation | rs761571805 | c.925C>T | p.Arg309Cys | p.R309C | Q8NBS3 | protein_coding | deleterious(0) | probably_damaging(0.992) | TCGA-VS-A9UL-01 | Cervix | cervical & endocervical cancer | Female | >=65 | III/IV | Unknown | Unknown | PD |
| SLC4A11 | SNV | Missense_Mutation | c.560N>A | p.Ala187Asp | p.A187D | Q8NBS3 | protein_coding | tolerated(0.14) | possibly_damaging(0.804) | TCGA-AA-3492-01 | Colorectum | colon adenocarcinoma | Female | >=65 | I/II | Unknown | Unknown | SD | |
| SLC4A11 | SNV | Missense_Mutation | rs752287261 | c.559N>A | p.Ala187Thr | p.A187T | Q8NBS3 | protein_coding | tolerated(0.32) | benign(0.063) | TCGA-AA-3695-01 | Colorectum | colon adenocarcinoma | Female | <65 | III/IV | Unknown | Unknown | SD |
| SLC4A11 | SNV | Missense_Mutation | rs138917586 | c.2455G>A | p.Ala819Thr | p.A819T | Q8NBS3 | protein_coding | deleterious(0) | probably_damaging(0.999) | TCGA-AA-A010-01 | Colorectum | colon adenocarcinoma | Female | <65 | I/II | Chemotherapy | folinic | CR |
| Page: 1 2 3 4 5 6 7 8 9 10 11 12 |
Top |
Related drugs of malignant transformation related genes |
| Identification of chemicals and drugs interact with genes involved in malignant transfromation |
| (DGIdb 4.0) |
| Entrez ID | Symbol | Category | Interaction Types | Drug Claim Name | Drug Name | PMIDs |
| Page: 1 |

Copyright 2023-Present -The University of Texas Health Science Center at Houston |