
|
|||||
|
 | |
| |
| |
| |
| |
| |
|
Gene: SLC45A2 |
Gene summary for SLC45A2 |
| Gene information | Species | Human | Gene symbol | SLC45A2 | Gene ID | 51151 |
| Gene name | solute carrier family 45 member 2 | |
| Gene Alias | 1A1 | |
| Cytomap | 5p13.2 | |
| Gene Type | protein-coding | GO ID | GO:0003008 | UniProtAcc | Q9UMX9 |
Top |
Malignant transformation analysis |
| Identification of the aberrant gene expression in precancerous and cancerous lesions by comparing the gene expression of stem-like cells in diseased tissues with normal stem cells |
| Entrez ID | Symbol | Replicates | Species | Organ | Tissue | Adj P-value | Log2FC | Malignancy |
| 51151 | SLC45A2 | HCC1_Meng | Human | Liver | HCC | 1.89e-05 | -9.99e-04 | 0.0246 |
| 51151 | SLC45A2 | HCC1 | Human | Liver | HCC | 1.17e-09 | 2.02e+00 | 0.5336 |
| 51151 | SLC45A2 | S014 | Human | Liver | HCC | 4.58e-05 | 1.51e-01 | 0.2254 |
| 51151 | SLC45A2 | S015 | Human | Liver | HCC | 9.93e-11 | 2.72e-01 | 0.2375 |
| 51151 | SLC45A2 | S016 | Human | Liver | HCC | 4.66e-16 | 5.58e-01 | 0.2243 |
| Page: 1 |
| Tissue | Expression Dynamics | Abbreviation |
| Liver | 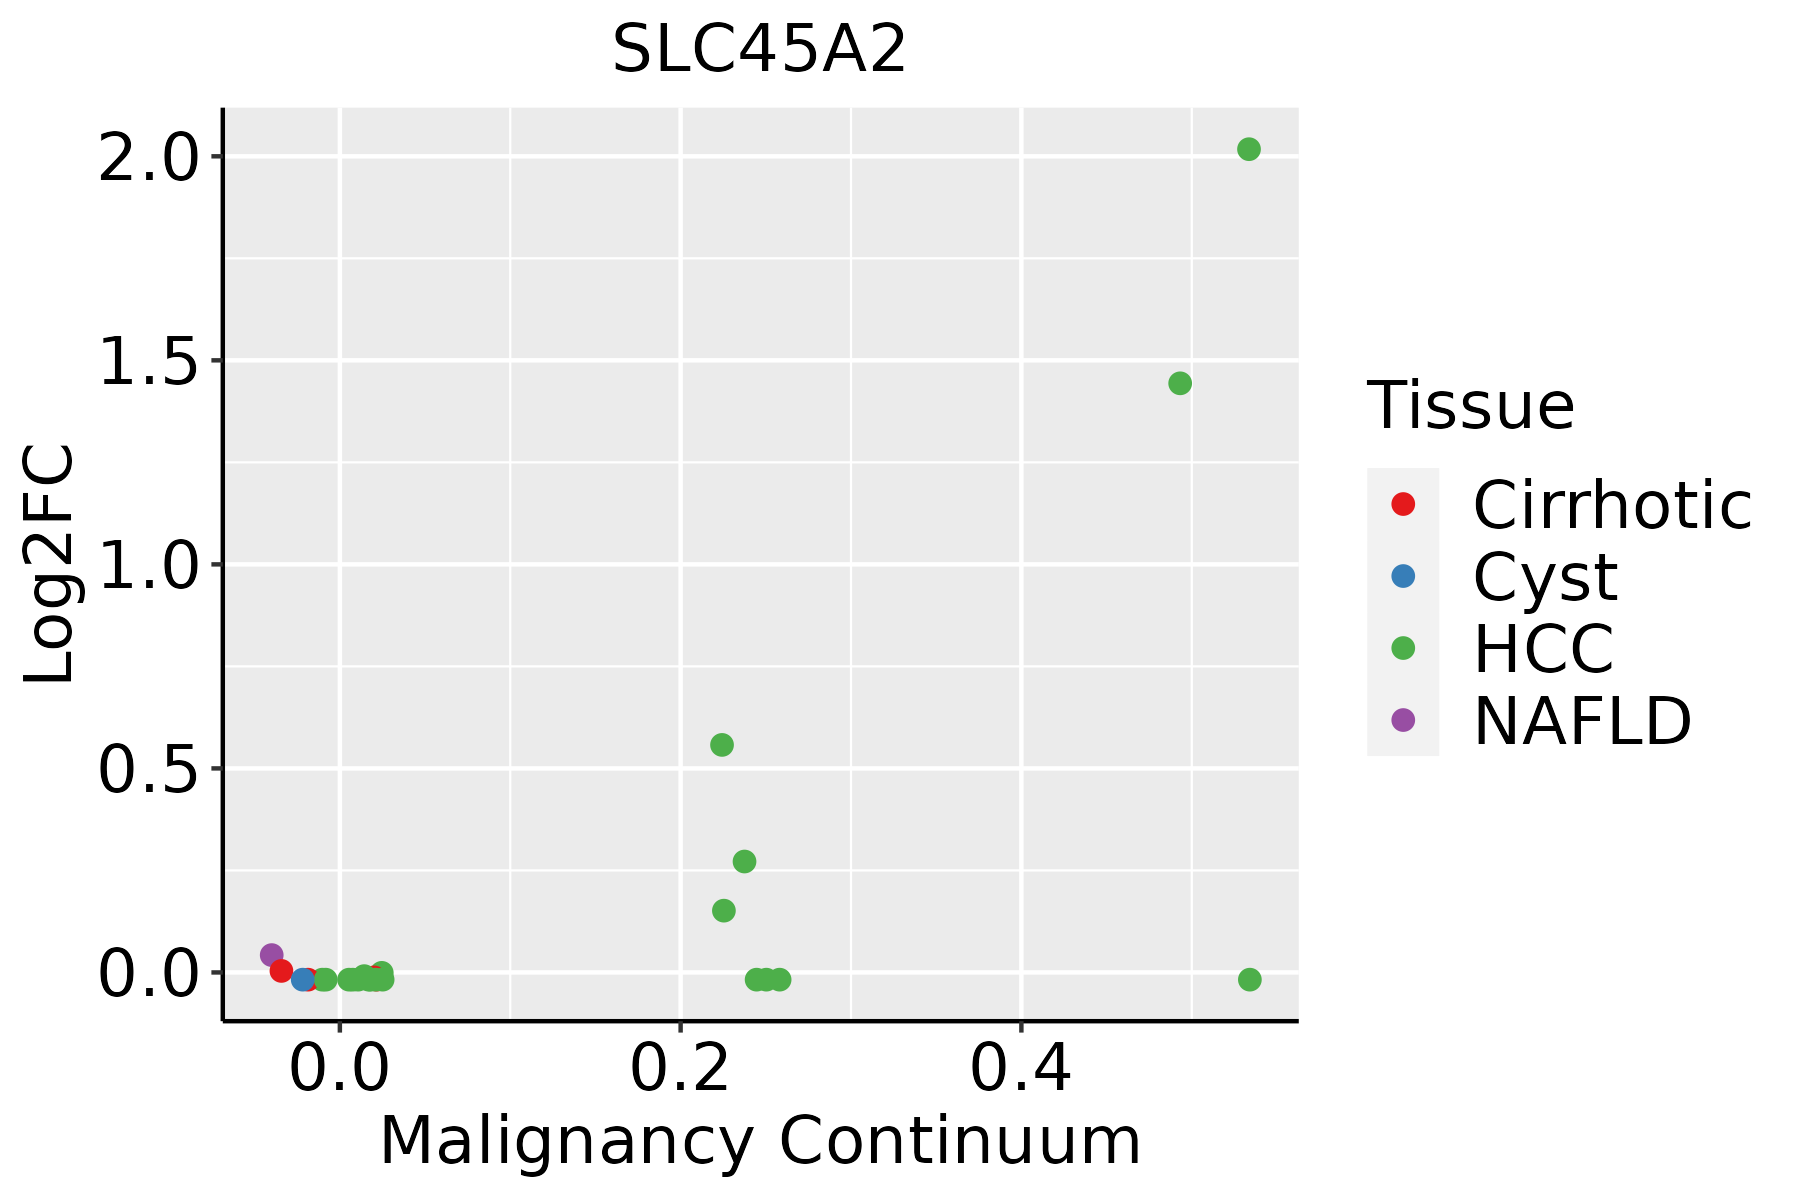 | HCC: Hepatocellular carcinoma |
| NAFLD: Non-alcoholic fatty liver disease |
| ∗log2FC in expression of this searched gene in stem-like cells from each diseased tissue sample relative to stem-like cells in normal samples in each tissue plotted against the malignancy continuum. Samples are colored based on if they are from different disease stage. |
Top |
Malignant transformation related pathway analysis |
| Find out the enriched GO biological processes and KEGG pathways involved in transition from healthy to precancer to cancer |
| Tissue | Disease Stage | Enriched GO biological Processes |
| Colorectum | AD |  |
| Colorectum | SER |  |
| Colorectum | MSS |  |
| Colorectum | MSI-H |  |
| Colorectum | FAP |  |
| ∗Top 15 enriched GO BP terms are showed in the bar plot of each disease state in each tissue. Each row represents a significant GO biological process which is colored according to the -log10(p.adjust). |
| Page: 1 2 3 4 5 6 7 8 9 |
| GO ID | Tissue | Disease Stage | Description | Gene Ratio | Bg Ratio | pvalue | p.adjust | Count |
| GO:19016172 | Liver | HCC | organic hydroxy compound biosynthetic process | 129/7958 | 237/18723 | 1.32e-04 | 1.08e-03 | 129 |
| GO:0042440 | Liver | HCC | pigment metabolic process | 51/7958 | 84/18723 | 5.74e-04 | 3.65e-03 | 51 |
| GO:0046148 | Liver | HCC | pigment biosynthetic process | 37/7958 | 62/18723 | 4.73e-03 | 2.02e-02 | 37 |
| GO:0008643 | Liver | HCC | carbohydrate transport | 80/7958 | 152/18723 | 7.34e-03 | 2.92e-02 | 80 |
| Page: 1 |
| Pathway ID | Tissue | Disease Stage | Description | Gene Ratio | Bg Ratio | pvalue | p.adjust | qvalue | Count |
| Page: 1 |
Top |
Cell-cell communication analysis |
| Identification of potential cell-cell interactions between two cell types and their ligand-receptor pairs for different disease states |
| Ligand | Receptor | LRpair | Pathway | Tissue | Disease Stage |
| Page: 1 |
Top |
Single-cell gene regulatory network inference analysis |
| Find out the significant the regulons (TFs) and the target genes of each regulon across cell types for different disease states |
| TF | Cell Type | Tissue | Disease Stage | Target Gene | RSS | Regulon Activity |
| ∗The dot plots of a searched regulon are shown for all cell subpopulations in each disease state of each tissue based on the regulon specific score inferred using pySCENIC and by calculating the average expression. |
| Page: 1 |
Top |
Somatic mutation of malignant transformation related genes |
| Annotation of somatic variants for genes involved in malignant transformation |
| Hugo Symbol | Variant Class | Variant Classification | dbSNP RS | HGVSc | HGVSp | HGVSp Short | SWISSPROT | BIOTYPE | SIFT | PolyPhen | Tumor Sample Barcode | Tissue | Histology | Sex | Age | Stage | Therapy Types | Drugs | Outcome |
| SLC45A2 | SNV | Missense_Mutation | rs756574797 | c.855N>A | p.Met285Ile | p.M285I | Q9UMX9 | protein_coding | tolerated(0.22) | benign(0) | TCGA-A2-A1FW-01 | Breast | breast invasive carcinoma | Female | <65 | III/IV | Chemotherapy | cytoxan | SD |
| SLC45A2 | SNV | Missense_Mutation | c.962N>C | p.Cys321Ser | p.C321S | Q9UMX9 | protein_coding | deleterious(0) | probably_damaging(0.91) | TCGA-A8-A07R-01 | Breast | breast invasive carcinoma | Female | >=65 | III/IV | Ancillary | zoledronic | SD | |
| SLC45A2 | SNV | Missense_Mutation | c.186N>G | p.Ser62Arg | p.S62R | Q9UMX9 | protein_coding | tolerated(0.07) | possibly_damaging(0.804) | TCGA-A8-A09Q-01 | Breast | breast invasive carcinoma | Female | >=65 | III/IV | Hormone Therapy | anastrozole | SD | |
| SLC45A2 | SNV | Missense_Mutation | c.428N>A | p.Ser143Asn | p.S143N | Q9UMX9 | protein_coding | deleterious(0) | benign(0.288) | TCGA-B6-A0IJ-01 | Breast | breast invasive carcinoma | Female | <65 | I/II | Unknown | Unknown | SD | |
| SLC45A2 | SNV | Missense_Mutation | novel | c.596N>G | p.Ala199Gly | p.A199G | Q9UMX9 | protein_coding | tolerated(1) | benign(0.105) | TCGA-B6-A40B-01 | Breast | breast invasive carcinoma | Female | >=65 | I/II | Unknown | Unknown | SD |
| SLC45A2 | SNV | Missense_Mutation | c.80C>T | p.Pro27Leu | p.P27L | Q9UMX9 | protein_coding | tolerated(0.07) | benign(0.005) | TCGA-D8-A1XK-01 | Breast | breast invasive carcinoma | Female | <65 | I/II | Chemotherapy | doxorubicine+cyclophosphamide | SD | |
| SLC45A2 | SNV | Missense_Mutation | novel | c.965N>A | p.Ile322Asn | p.I322N | Q9UMX9 | protein_coding | deleterious(0) | possibly_damaging(0.811) | TCGA-E2-A14N-01 | Breast | breast invasive carcinoma | Female | <65 | I/II | Chemotherapy | cyclophosphamide | SD |
| SLC45A2 | SNV | Missense_Mutation | rs121912621 | c.469G>A | p.Asp157Asn | p.D157N | Q9UMX9 | protein_coding | deleterious(0) | probably_damaging(1) | TCGA-2W-A8YY-01 | Cervix | cervical & endocervical cancer | Female | <65 | I/II | Chemotherapy | cisplatin | CR |
| SLC45A2 | SNV | Missense_Mutation | novel | c.259G>A | p.Val87Met | p.V87M | Q9UMX9 | protein_coding | deleterious(0) | benign(0.327) | TCGA-2W-A8YY-01 | Cervix | cervical & endocervical cancer | Female | <65 | I/II | Chemotherapy | cisplatin | CR |
| SLC45A2 | SNV | Missense_Mutation | novel | c.520N>G | p.Gln174Glu | p.Q174E | Q9UMX9 | protein_coding | tolerated(1) | benign(0.001) | TCGA-MA-AA3Z-01 | Cervix | cervical & endocervical cancer | Female | <65 | I/II | Unknown | Unknown | SD |
| Page: 1 2 3 4 5 6 7 8 9 |
Top |
Related drugs of malignant transformation related genes |
| Identification of chemicals and drugs interact with genes involved in malignant transfromation |
| (DGIdb 4.0) |
| Entrez ID | Symbol | Category | Interaction Types | Drug Claim Name | Drug Name | PMIDs |
| Page: 1 |

Copyright 2023-Present -The University of Texas Health Science Center at Houston |