
|
|||||
|
 | |
| |
| |
| |
| |
| |
|
Gene: SLC44A4 |
Gene summary for SLC44A4 |
| Gene information | Species | Human | Gene symbol | SLC44A4 | Gene ID | 80736 |
| Gene name | solute carrier family 44 member 4 | |
| Gene Alias | C6orf29 | |
| Cytomap | 6p21.33 | |
| Gene Type | protein-coding | GO ID | GO:0001505 | UniProtAcc | Q53GD3 |
Top |
Malignant transformation analysis |
| Identification of the aberrant gene expression in precancerous and cancerous lesions by comparing the gene expression of stem-like cells in diseased tissues with normal stem cells |
| Entrez ID | Symbol | Replicates | Species | Organ | Tissue | Adj P-value | Log2FC | Malignancy |
| 80736 | SLC44A4 | HTA11_2487_2000001011 | Human | Colorectum | SER | 2.32e-24 | 1.33e+00 | -0.1808 |
| 80736 | SLC44A4 | HTA11_1938_2000001011 | Human | Colorectum | AD | 3.49e-20 | 1.12e+00 | -0.0811 |
| 80736 | SLC44A4 | HTA11_78_2000001011 | Human | Colorectum | AD | 1.01e-13 | 9.37e-01 | -0.1088 |
| 80736 | SLC44A4 | HTA11_347_2000001011 | Human | Colorectum | AD | 4.30e-55 | 1.53e+00 | -0.1954 |
| 80736 | SLC44A4 | HTA11_411_2000001011 | Human | Colorectum | SER | 3.07e-16 | 2.09e+00 | -0.2602 |
| 80736 | SLC44A4 | HTA11_2112_2000001011 | Human | Colorectum | SER | 1.55e-16 | 1.52e+00 | -0.2196 |
| 80736 | SLC44A4 | HTA11_3361_2000001011 | Human | Colorectum | AD | 2.19e-17 | 9.55e-01 | -0.1207 |
| 80736 | SLC44A4 | HTA11_83_2000001011 | Human | Colorectum | SER | 4.96e-13 | 9.33e-01 | -0.1526 |
| 80736 | SLC44A4 | HTA11_696_2000001011 | Human | Colorectum | AD | 3.15e-47 | 1.46e+00 | -0.1464 |
| 80736 | SLC44A4 | HTA11_866_2000001011 | Human | Colorectum | AD | 3.34e-22 | 8.49e-01 | -0.1001 |
| 80736 | SLC44A4 | HTA11_1391_2000001011 | Human | Colorectum | AD | 2.20e-20 | 1.07e+00 | -0.059 |
| 80736 | SLC44A4 | HTA11_2992_2000001011 | Human | Colorectum | SER | 7.47e-11 | 1.15e+00 | -0.1706 |
| 80736 | SLC44A4 | HTA11_5212_2000001011 | Human | Colorectum | AD | 3.95e-09 | 9.81e-01 | -0.2061 |
| 80736 | SLC44A4 | HTA11_5216_2000001011 | Human | Colorectum | SER | 1.28e-05 | 9.66e-01 | -0.1462 |
| 80736 | SLC44A4 | HTA11_546_2000001011 | Human | Colorectum | AD | 3.58e-11 | 9.64e-01 | -0.0842 |
| 80736 | SLC44A4 | HTA11_7663_2000001011 | Human | Colorectum | SER | 3.07e-08 | 9.27e-01 | 0.0131 |
| 80736 | SLC44A4 | HTA11_10623_2000001011 | Human | Colorectum | AD | 5.70e-07 | 8.18e-01 | -0.0177 |
| 80736 | SLC44A4 | HTA11_10711_2000001011 | Human | Colorectum | AD | 2.79e-02 | 4.72e-01 | 0.0338 |
| 80736 | SLC44A4 | HTA11_7696_3000711011 | Human | Colorectum | AD | 1.67e-02 | 3.72e-01 | 0.0674 |
| 80736 | SLC44A4 | HTA11_6818_2000001011 | Human | Colorectum | AD | 9.69e-04 | 6.95e-01 | 0.0112 |
| Page: 1 2 3 4 |
| Tissue | Expression Dynamics | Abbreviation |
| Colorectum (GSE201348) |  | FAP: Familial adenomatous polyposis |
| CRC: Colorectal cancer | ||
| Colorectum (HTA11) |  | AD: Adenomas |
| SER: Sessile serrated lesions | ||
| MSI-H: Microsatellite-high colorectal cancer | ||
| MSS: Microsatellite stable colorectal cancer | ||
| Esophagus | 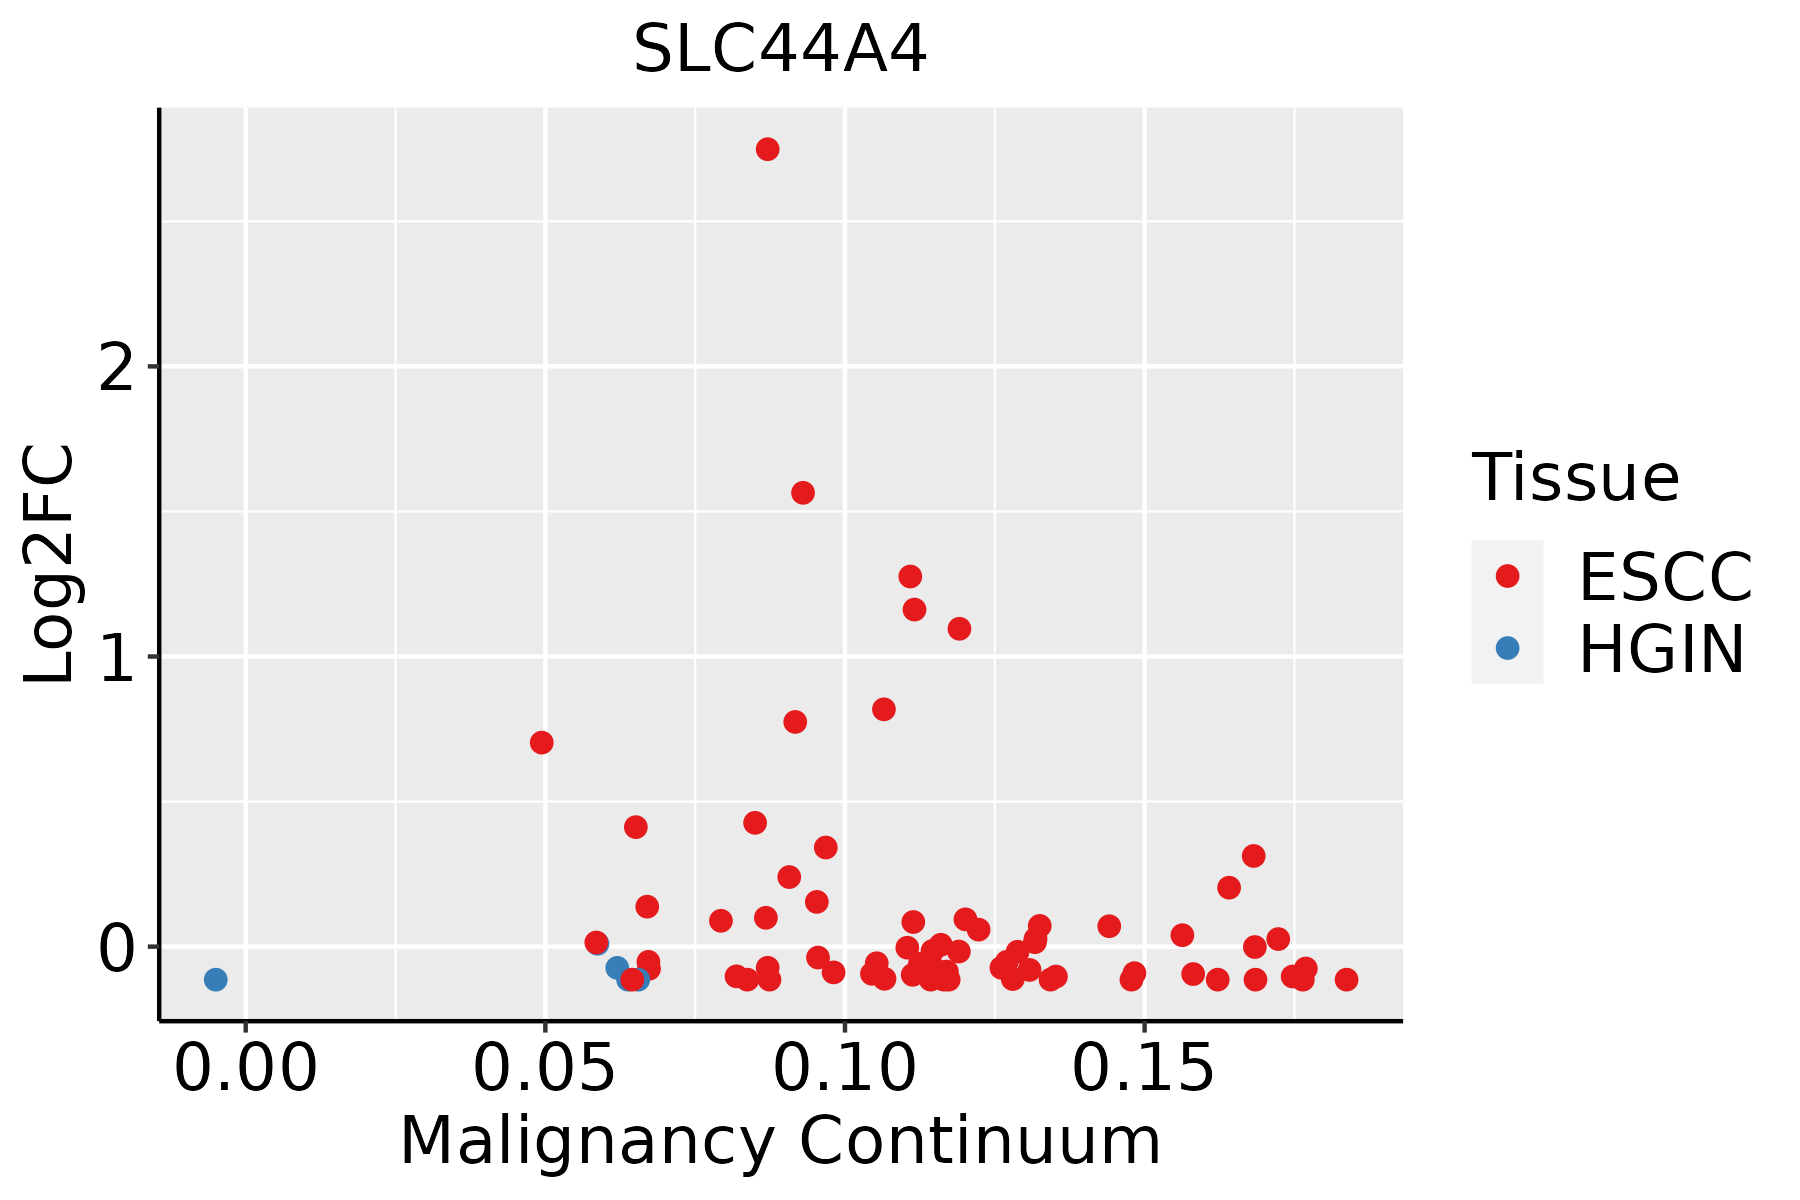 | ESCC: Esophageal squamous cell carcinoma |
| HGIN: High-grade intraepithelial neoplasias | ||
| LGIN: Low-grade intraepithelial neoplasias | ||
| Liver |  | HCC: Hepatocellular carcinoma |
| NAFLD: Non-alcoholic fatty liver disease | ||
| Prostate | 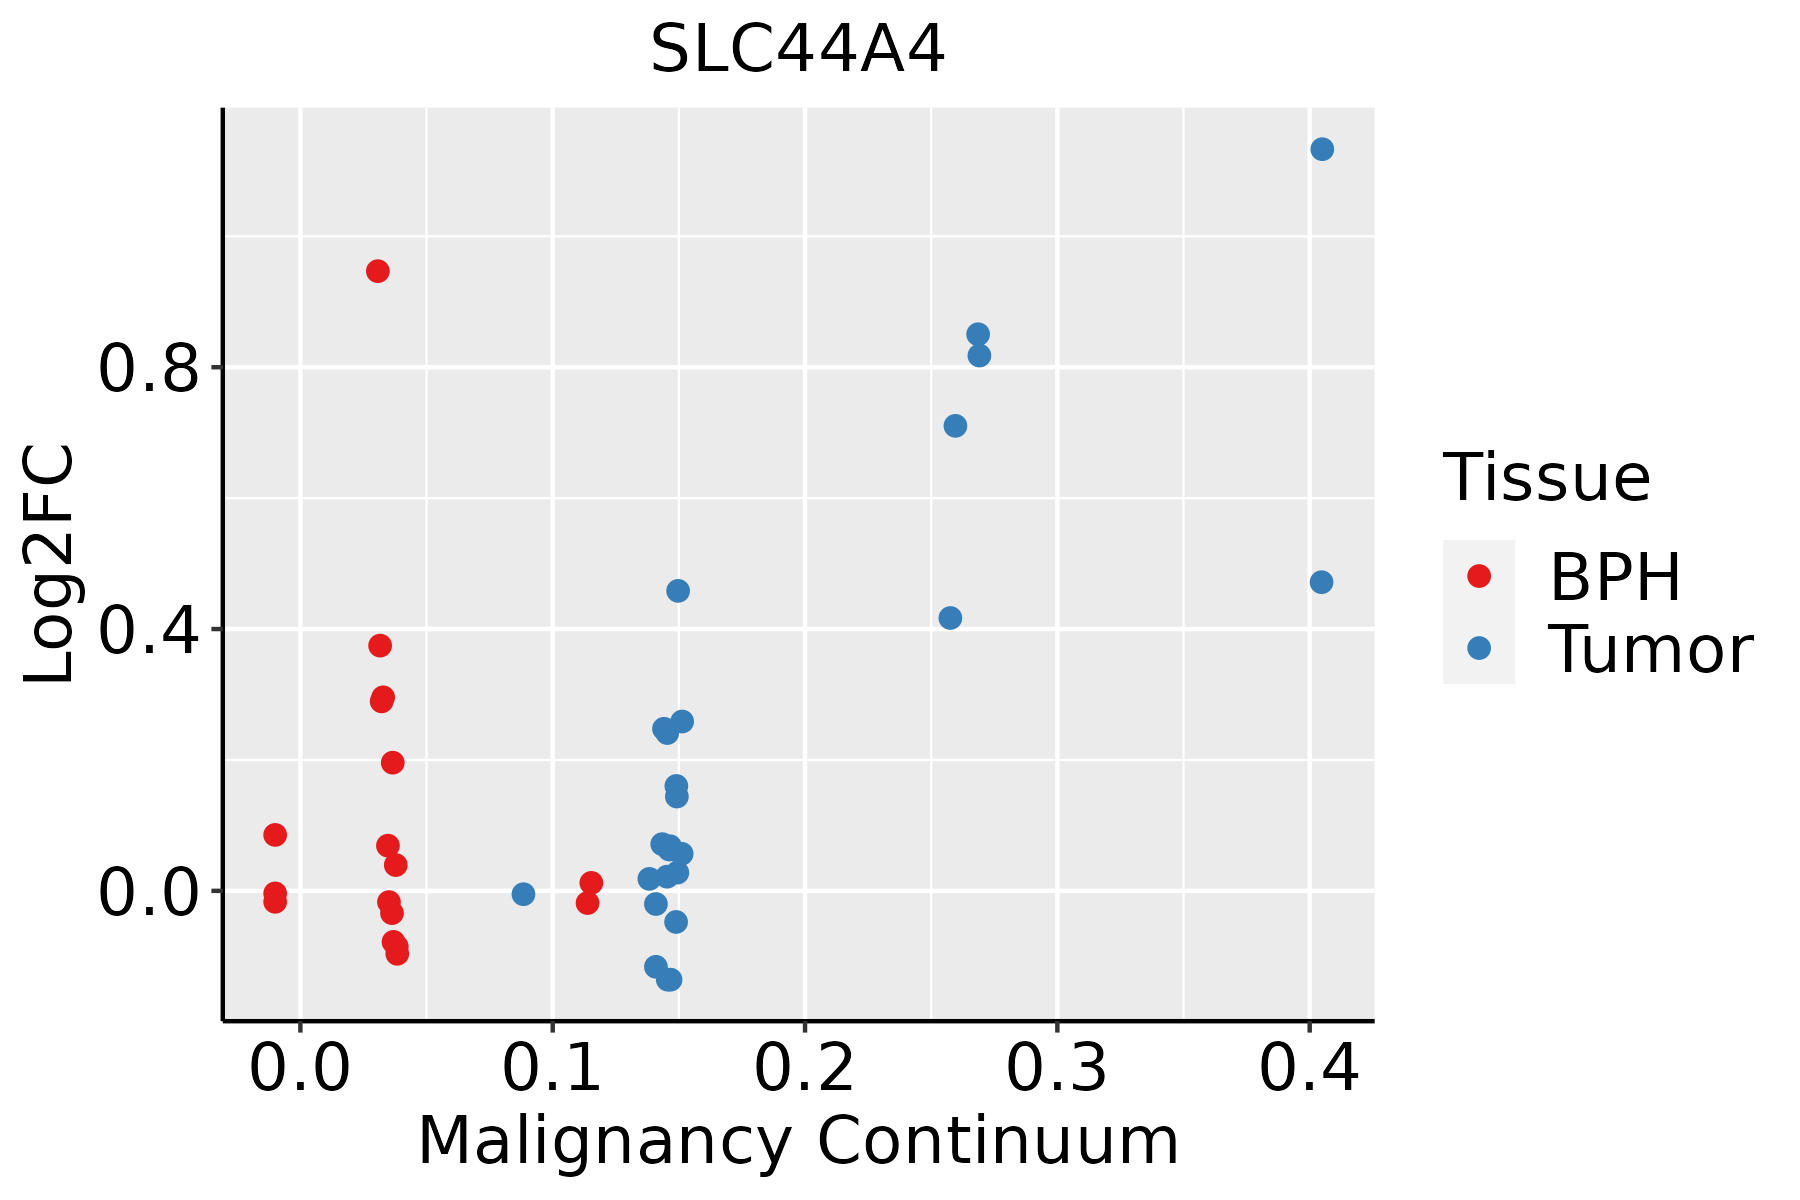 | BPH: Benign Prostatic Hyperplasia |
| ∗log2FC in expression of this searched gene in stem-like cells from each diseased tissue sample relative to stem-like cells in normal samples in each tissue plotted against the malignancy continuum. Samples are colored based on if they are from different disease stage. |
Top |
Malignant transformation related pathway analysis |
| Find out the enriched GO biological processes and KEGG pathways involved in transition from healthy to precancer to cancer |
| Tissue | Disease Stage | Enriched GO biological Processes |
| Colorectum | AD |  |
| Colorectum | SER |  |
| Colorectum | MSS |  |
| Colorectum | MSI-H |  |
| Colorectum | FAP |  |
| ∗Top 15 enriched GO BP terms are showed in the bar plot of each disease state in each tissue. Each row represents a significant GO biological process which is colored according to the -log10(p.adjust). |
| Page: 1 2 3 4 5 6 7 8 9 |
| GO ID | Tissue | Disease Stage | Description | Gene Ratio | Bg Ratio | pvalue | p.adjust | Count |
| GO:0016049 | Colorectum | AD | cell growth | 143/3918 | 482/18723 | 2.83e-06 | 8.09e-05 | 143 |
| GO:0001558 | Colorectum | AD | regulation of cell growth | 124/3918 | 414/18723 | 7.67e-06 | 1.86e-04 | 124 |
| GO:0035315 | Colorectum | AD | hair cell differentiation | 21/3918 | 47/18723 | 2.14e-04 | 2.82e-03 | 21 |
| GO:0030307 | Colorectum | AD | positive regulation of cell growth | 54/3918 | 166/18723 | 3.08e-04 | 3.69e-03 | 54 |
| GO:0045927 | Colorectum | AD | positive regulation of growth | 77/3918 | 259/18723 | 4.82e-04 | 5.27e-03 | 77 |
| GO:0042490 | Colorectum | AD | mechanoreceptor differentiation | 24/3918 | 67/18723 | 3.48e-03 | 2.52e-02 | 24 |
| GO:0048568 | Colorectum | AD | embryonic organ development | 112/3918 | 427/18723 | 4.60e-03 | 3.14e-02 | 112 |
| GO:0009913 | Colorectum | AD | epidermal cell differentiation | 58/3918 | 202/18723 | 5.16e-03 | 3.42e-02 | 58 |
| GO:0006650 | Colorectum | AD | glycerophospholipid metabolic process | 83/3918 | 306/18723 | 5.40e-03 | 3.55e-02 | 83 |
| GO:0006644 | Colorectum | AD | phospholipid metabolic process | 101/3918 | 383/18723 | 5.80e-03 | 3.67e-02 | 101 |
| GO:0008544 | Colorectum | AD | epidermis development | 87/3918 | 324/18723 | 5.99e-03 | 3.76e-02 | 87 |
| GO:0015748 | Colorectum | AD | organophosphate ester transport | 42/3918 | 140/18723 | 7.04e-03 | 4.31e-02 | 42 |
| GO:0045017 | Colorectum | AD | glycerolipid biosynthetic process | 69/3918 | 252/18723 | 8.33e-03 | 4.88e-02 | 69 |
| GO:00015581 | Colorectum | SER | regulation of cell growth | 90/2897 | 414/18723 | 4.00e-04 | 6.02e-03 | 90 |
| GO:00160491 | Colorectum | SER | cell growth | 100/2897 | 482/18723 | 1.07e-03 | 1.24e-02 | 100 |
| GO:0046486 | Colorectum | SER | glycerolipid metabolic process | 82/2897 | 392/18723 | 2.26e-03 | 2.17e-02 | 82 |
| GO:00353151 | Colorectum | SER | hair cell differentiation | 15/2897 | 47/18723 | 3.68e-03 | 3.07e-02 | 15 |
| GO:00066441 | Colorectum | SER | phospholipid metabolic process | 79/2897 | 383/18723 | 3.94e-03 | 3.24e-02 | 79 |
| GO:00303071 | Colorectum | SER | positive regulation of cell growth | 39/2897 | 166/18723 | 4.25e-03 | 3.45e-02 | 39 |
| GO:00450171 | Colorectum | SER | glycerolipid biosynthetic process | 55/2897 | 252/18723 | 4.47e-03 | 3.56e-02 | 55 |
| Page: 1 2 3 4 5 |
| Pathway ID | Tissue | Disease Stage | Description | Gene Ratio | Bg Ratio | pvalue | p.adjust | qvalue | Count |
| hsa05231 | Colorectum | MSS | Choline metabolism in cancer | 34/1875 | 98/8465 | 2.90e-03 | 1.39e-02 | 8.50e-03 | 34 |
| hsa052311 | Colorectum | MSS | Choline metabolism in cancer | 34/1875 | 98/8465 | 2.90e-03 | 1.39e-02 | 8.50e-03 | 34 |
| hsa052312 | Colorectum | FAP | Choline metabolism in cancer | 29/1404 | 98/8465 | 9.03e-04 | 5.20e-03 | 3.16e-03 | 29 |
| hsa052313 | Colorectum | FAP | Choline metabolism in cancer | 29/1404 | 98/8465 | 9.03e-04 | 5.20e-03 | 3.16e-03 | 29 |
| hsa052314 | Colorectum | CRC | Choline metabolism in cancer | 24/1091 | 98/8465 | 1.21e-03 | 9.84e-03 | 6.67e-03 | 24 |
| hsa052315 | Colorectum | CRC | Choline metabolism in cancer | 24/1091 | 98/8465 | 1.21e-03 | 9.84e-03 | 6.67e-03 | 24 |
| hsa052319 | Esophagus | ESCC | Choline metabolism in cancer | 61/4205 | 98/8465 | 7.97e-03 | 1.92e-02 | 9.84e-03 | 61 |
| hsa0523114 | Esophagus | ESCC | Choline metabolism in cancer | 61/4205 | 98/8465 | 7.97e-03 | 1.92e-02 | 9.84e-03 | 61 |
| hsa052316 | Liver | HCC | Choline metabolism in cancer | 57/4020 | 98/8465 | 2.14e-02 | 4.90e-02 | 2.72e-02 | 57 |
| hsa0523111 | Liver | HCC | Choline metabolism in cancer | 57/4020 | 98/8465 | 2.14e-02 | 4.90e-02 | 2.72e-02 | 57 |
| Page: 1 |
Top |
Cell-cell communication analysis |
| Identification of potential cell-cell interactions between two cell types and their ligand-receptor pairs for different disease states |
| Ligand | Receptor | LRpair | Pathway | Tissue | Disease Stage |
| Page: 1 |
Top |
Single-cell gene regulatory network inference analysis |
| Find out the significant the regulons (TFs) and the target genes of each regulon across cell types for different disease states |
| TF | Cell Type | Tissue | Disease Stage | Target Gene | RSS | Regulon Activity |
| ∗The dot plots of a searched regulon are shown for all cell subpopulations in each disease state of each tissue based on the regulon specific score inferred using pySCENIC and by calculating the average expression. |
| Page: 1 |
Top |
Somatic mutation of malignant transformation related genes |
| Annotation of somatic variants for genes involved in malignant transformation |
| Hugo Symbol | Variant Class | Variant Classification | dbSNP RS | HGVSc | HGVSp | HGVSp Short | SWISSPROT | BIOTYPE | SIFT | PolyPhen | Tumor Sample Barcode | Tissue | Histology | Sex | Age | Stage | Therapy Types | Drugs | Outcome |
| SLC44A4 | SNV | Missense_Mutation | rs780198573 | c.538C>A | p.Arg180Ser | p.R180S | Q53GD3 | protein_coding | deleterious(0) | probably_damaging(0.933) | TCGA-E9-A1R4-01 | Breast | breast invasive carcinoma | Female | >=65 | I/II | Chemotherapy | 5-fluorouracil | SD |
| SLC44A4 | SNV | Missense_Mutation | rs372077719 | c.1747N>G | p.Arg583Gly | p.R583G | Q53GD3 | protein_coding | deleterious(0) | probably_damaging(0.999) | TCGA-EW-A1J5-01 | Breast | breast invasive carcinoma | Female | <65 | I/II | Chemotherapy | adriamycin | SD |
| SLC44A4 | SNV | Missense_Mutation | rs200350113 | c.569N>T | p.Pro190Leu | p.P190L | Q53GD3 | protein_coding | tolerated(0.15) | benign(0.003) | TCGA-C5-A8XH-01 | Cervix | cervical & endocervical cancer | Female | <65 | I/II | Unknown | Unknown | SD |
| SLC44A4 | SNV | Missense_Mutation | c.2023N>C | p.Glu675Gln | p.E675Q | Q53GD3 | protein_coding | deleterious(0) | probably_damaging(0.999) | TCGA-FU-A23K-01 | Cervix | cervical & endocervical cancer | Female | <65 | III/IV | Unknown | Unknown | SD | |
| SLC44A4 | SNV | Missense_Mutation | rs11551744 | c.31N>A | p.Glu11Lys | p.E11K | Q53GD3 | protein_coding | tolerated(0.62) | benign(0.003) | TCGA-VS-A958-01 | Cervix | cervical & endocervical cancer | Female | <65 | I/II | Chemotherapy | cisplatin | CR |
| SLC44A4 | SNV | Missense_Mutation | novel | c.839N>G | p.Tyr280Cys | p.Y280C | Q53GD3 | protein_coding | deleterious(0) | benign(0.365) | TCGA-XS-A8TJ-01 | Cervix | cervical & endocervical cancer | Female | <65 | I/II | Chemotherapy | cisplatin | SD |
| SLC44A4 | SNV | Missense_Mutation | c.1304N>G | p.Ile435Ser | p.I435S | Q53GD3 | protein_coding | deleterious(0.01) | benign(0.065) | TCGA-AA-A010-01 | Colorectum | colon adenocarcinoma | Female | <65 | I/II | Chemotherapy | folinic | CR | |
| SLC44A4 | SNV | Missense_Mutation | c.1940N>T | p.Gly647Val | p.G647V | Q53GD3 | protein_coding | deleterious(0) | probably_damaging(0.927) | TCGA-AZ-6598-01 | Colorectum | colon adenocarcinoma | Female | >=65 | I/II | Unknown | Unknown | SD | |
| SLC44A4 | SNV | Missense_Mutation | novel | c.484N>A | p.Leu162Met | p.L162M | Q53GD3 | protein_coding | tolerated(0.06) | benign(0.415) | TCGA-AG-A002-01 | Colorectum | rectum adenocarcinoma | Male | <65 | I/II | Unknown | Unknown | SD |
| SLC44A4 | SNV | Missense_Mutation | novel | c.803N>G | p.Val268Gly | p.V268G | Q53GD3 | protein_coding | deleterious(0) | benign(0.127) | TCGA-AG-A023-01 | Colorectum | rectum adenocarcinoma | Female | <65 | III/IV | Unknown | Unknown | PD |
| Page: 1 2 3 4 5 6 7 |
Top |
Related drugs of malignant transformation related genes |
| Identification of chemicals and drugs interact with genes involved in malignant transfromation |
| (DGIdb 4.0) |
| Entrez ID | Symbol | Category | Interaction Types | Drug Claim Name | Drug Name | PMIDs |
| 80736 | SLC44A4 | TRANSPORTER, DRUGGABLE GENOME | ASG-5ME | ASG-5ME |
| Page: 1 |

Copyright 2023-Present -The University of Texas Health Science Center at Houston |