
|
|||||
|
 | |
| |
| |
| |
| |
| |
|
Gene: SLC44A2 |
Gene summary for SLC44A2 |
| Gene information | Species | Human | Gene symbol | SLC44A2 | Gene ID | 57153 |
| Gene name | solute carrier family 44 member 2 | |
| Gene Alias | CTL2 | |
| Cytomap | 19p13.2 | |
| Gene Type | protein-coding | GO ID | GO:0006629 | UniProtAcc | A0A088QCU6 |
Top |
Malignant transformation analysis |
| Identification of the aberrant gene expression in precancerous and cancerous lesions by comparing the gene expression of stem-like cells in diseased tissues with normal stem cells |
| Entrez ID | Symbol | Replicates | Species | Organ | Tissue | Adj P-value | Log2FC | Malignancy |
| 57153 | SLC44A2 | HTA11_3410_2000001011 | Human | Colorectum | AD | 1.64e-04 | 9.06e-02 | 0.0155 |
| 57153 | SLC44A2 | HTA11_2487_2000001011 | Human | Colorectum | SER | 1.84e-12 | 4.93e-01 | -0.1808 |
| 57153 | SLC44A2 | HTA11_2951_2000001011 | Human | Colorectum | AD | 4.05e-02 | 3.92e-01 | 0.0216 |
| 57153 | SLC44A2 | HTA11_1938_2000001011 | Human | Colorectum | AD | 6.38e-05 | 4.50e-01 | -0.0811 |
| 57153 | SLC44A2 | HTA11_347_2000001011 | Human | Colorectum | AD | 2.11e-26 | 6.21e-01 | -0.1954 |
| 57153 | SLC44A2 | HTA11_3361_2000001011 | Human | Colorectum | AD | 1.35e-06 | 4.41e-01 | -0.1207 |
| 57153 | SLC44A2 | HTA11_83_2000001011 | Human | Colorectum | SER | 5.49e-03 | 3.66e-01 | -0.1526 |
| 57153 | SLC44A2 | HTA11_696_2000001011 | Human | Colorectum | AD | 4.80e-16 | 6.02e-01 | -0.1464 |
| 57153 | SLC44A2 | HTA11_866_2000001011 | Human | Colorectum | AD | 3.13e-06 | 2.96e-01 | -0.1001 |
| 57153 | SLC44A2 | HTA11_1391_2000001011 | Human | Colorectum | AD | 6.91e-11 | 4.36e-01 | -0.059 |
| 57153 | SLC44A2 | HTA11_2992_2000001011 | Human | Colorectum | SER | 1.35e-03 | 4.82e-01 | -0.1706 |
| 57153 | SLC44A2 | HTA11_5212_2000001011 | Human | Colorectum | AD | 2.76e-09 | 5.62e-01 | -0.2061 |
| 57153 | SLC44A2 | HTA11_546_2000001011 | Human | Colorectum | AD | 1.23e-02 | 2.79e-01 | -0.0842 |
| 57153 | SLC44A2 | HTA11_866_3004761011 | Human | Colorectum | AD | 2.51e-03 | 1.97e-01 | 0.096 |
| 57153 | SLC44A2 | HTA11_10623_2000001011 | Human | Colorectum | AD | 2.27e-03 | 2.31e-01 | -0.0177 |
| 57153 | SLC44A2 | HTA11_7696_3000711011 | Human | Colorectum | AD | 8.57e-07 | 3.13e-01 | 0.0674 |
| 57153 | SLC44A2 | HTA11_7469_2000001011 | Human | Colorectum | AD | 5.32e-04 | 4.45e-01 | -0.0124 |
| 57153 | SLC44A2 | HTA11_6818_2000001021 | Human | Colorectum | AD | 4.01e-04 | 3.47e-01 | 0.0588 |
| 57153 | SLC44A2 | LZE4T | Human | Esophagus | ESCC | 2.40e-06 | 1.08e-01 | 0.0811 |
| 57153 | SLC44A2 | LZE5T | Human | Esophagus | ESCC | 2.98e-05 | 7.60e-01 | 0.0514 |
| Page: 1 2 3 4 5 6 7 |
| Tissue | Expression Dynamics | Abbreviation |
| Colorectum (GSE201348) | 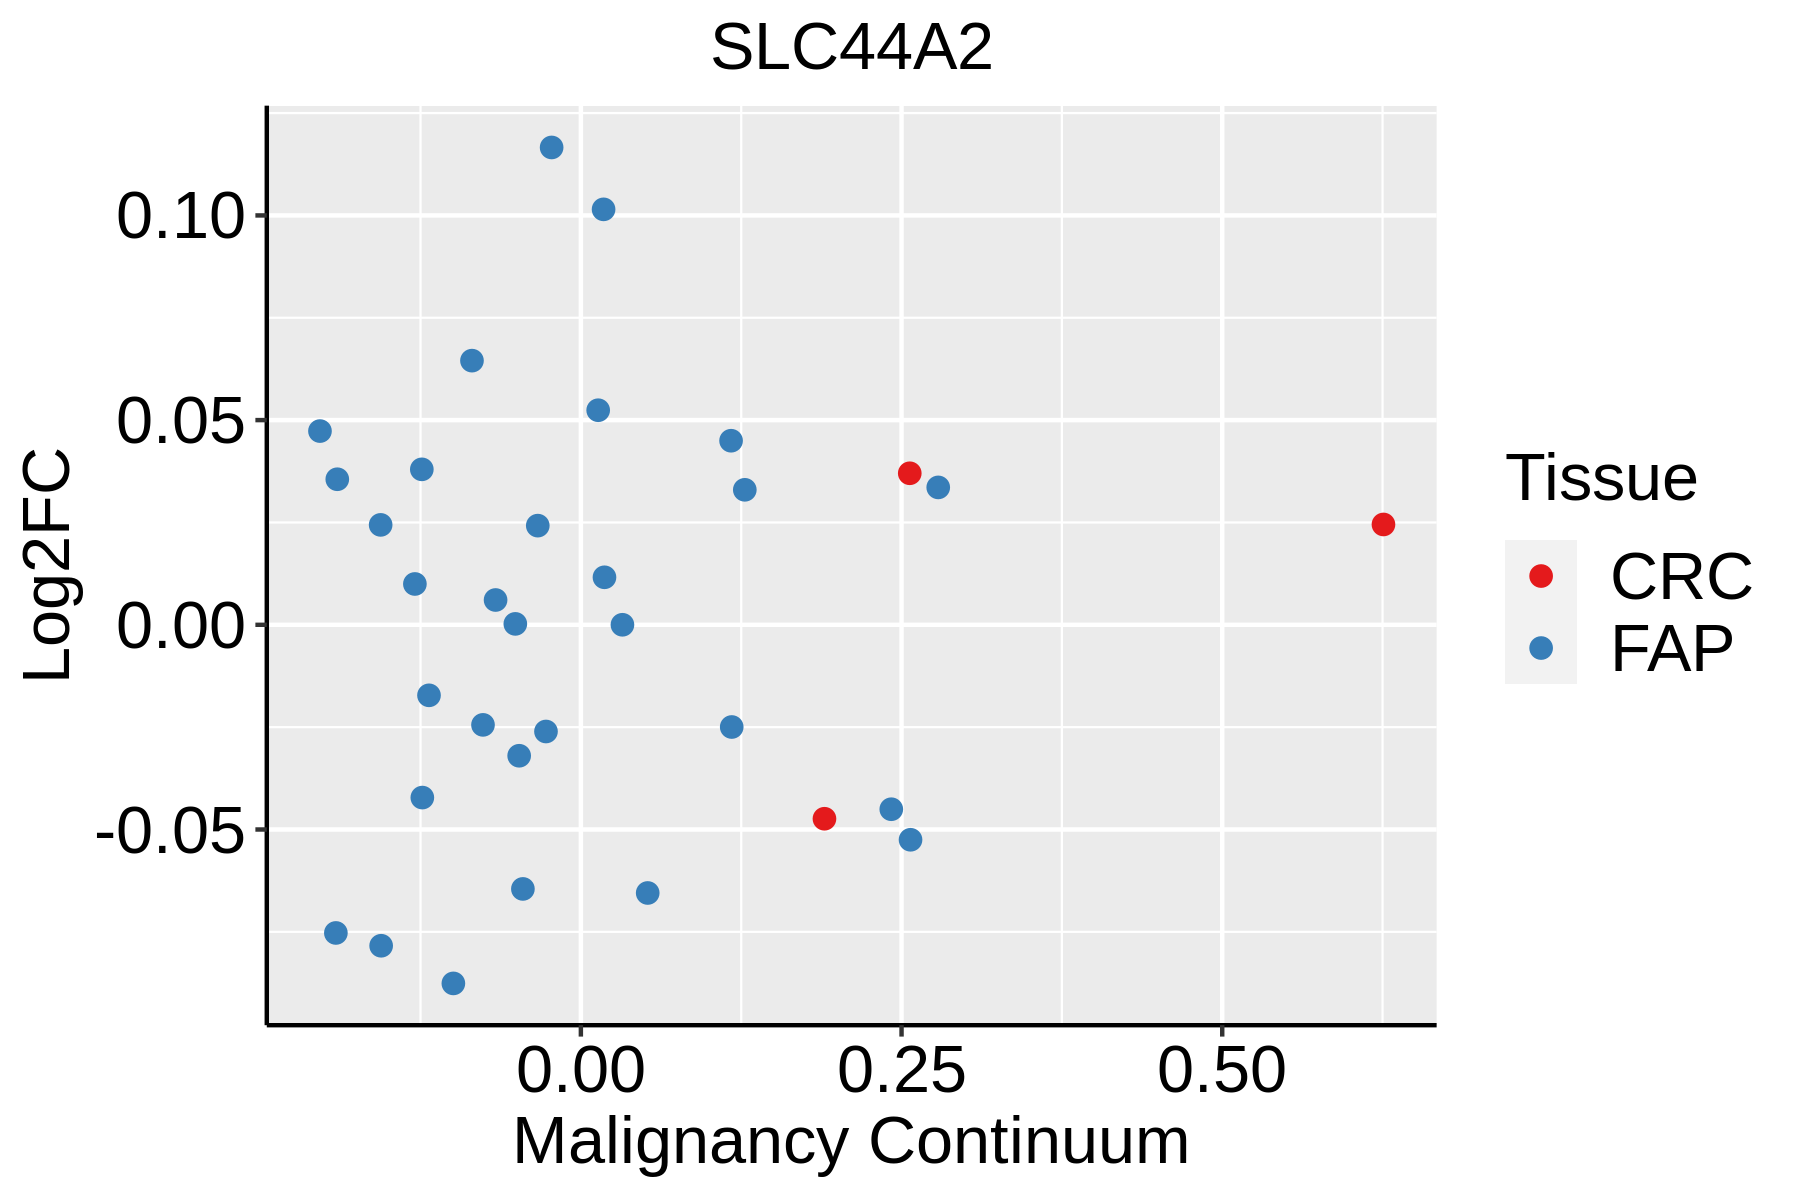 | FAP: Familial adenomatous polyposis |
| CRC: Colorectal cancer | ||
| Colorectum (HTA11) |  | AD: Adenomas |
| SER: Sessile serrated lesions | ||
| MSI-H: Microsatellite-high colorectal cancer | ||
| MSS: Microsatellite stable colorectal cancer | ||
| Esophagus | 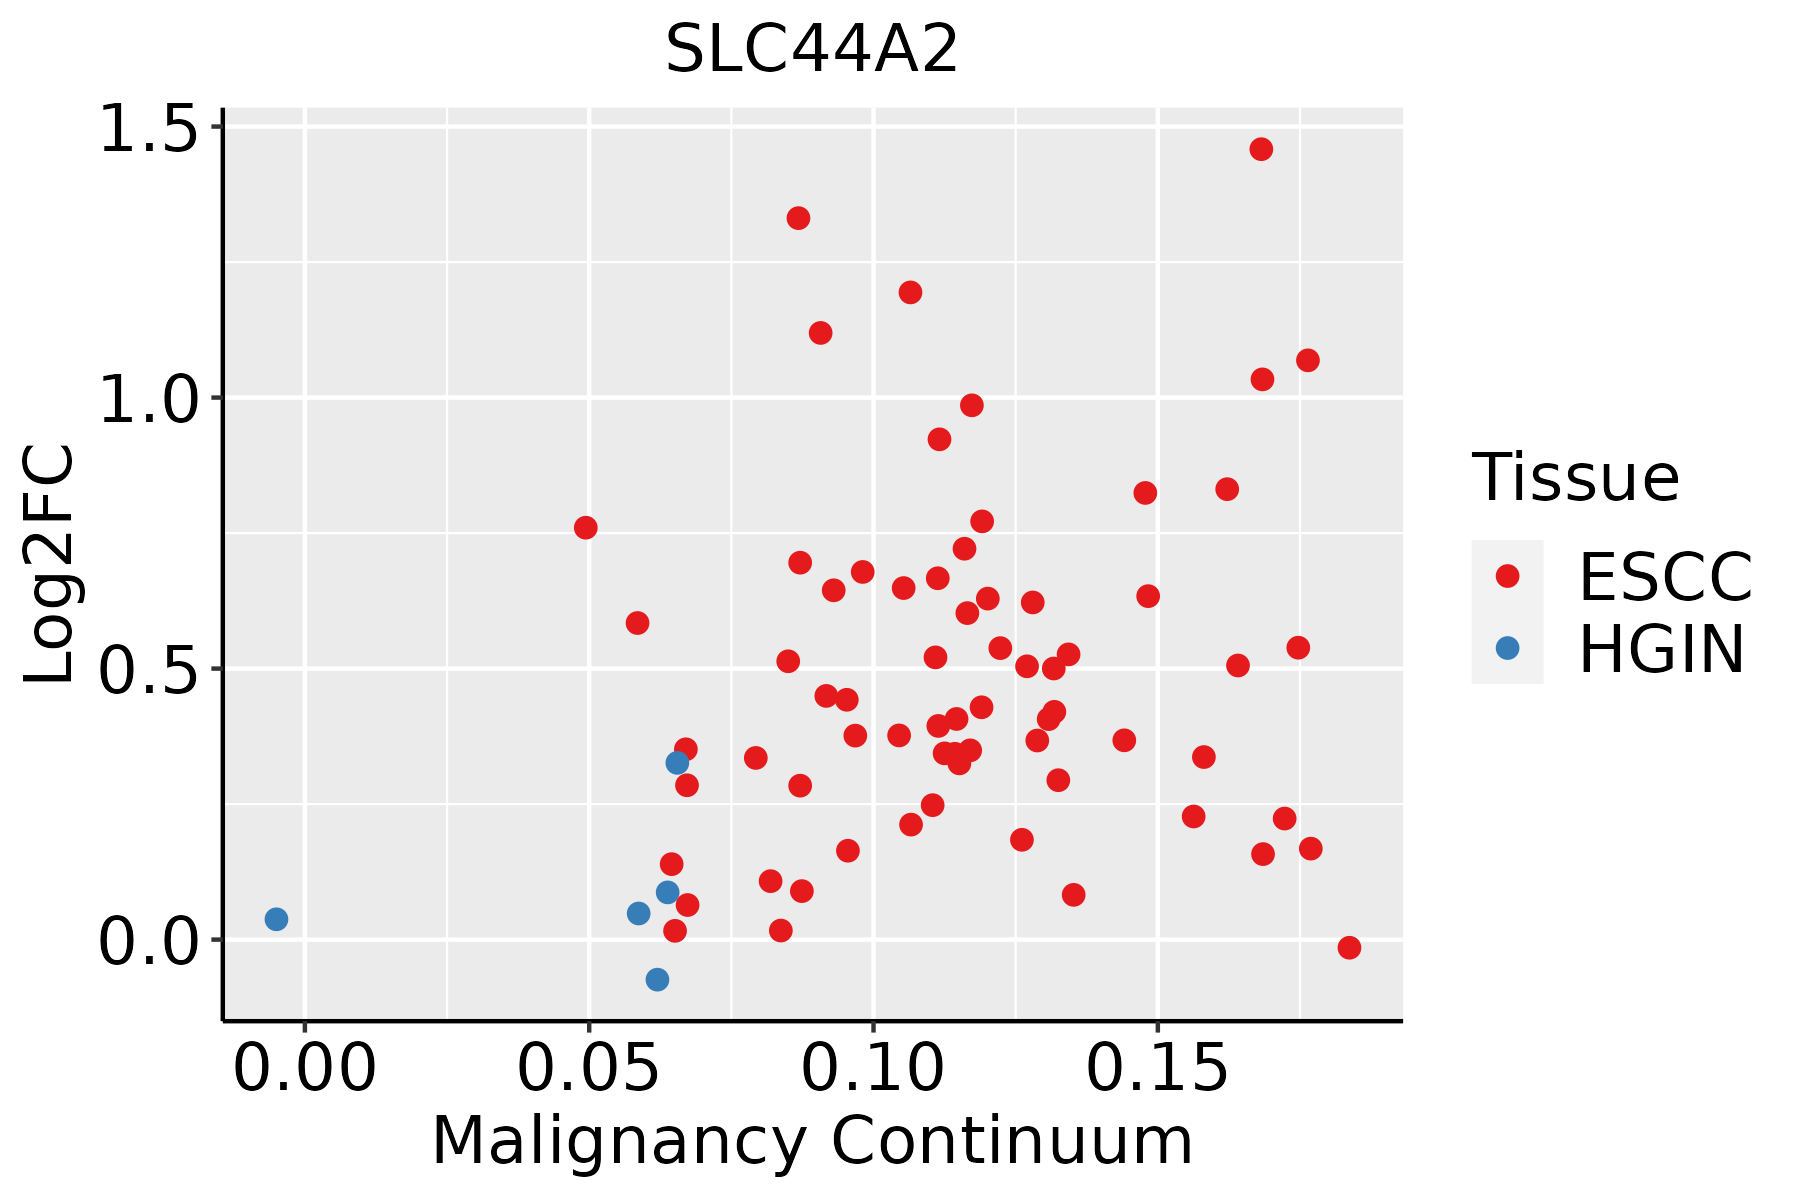 | ESCC: Esophageal squamous cell carcinoma |
| HGIN: High-grade intraepithelial neoplasias | ||
| LGIN: Low-grade intraepithelial neoplasias | ||
| Oral Cavity |  | EOLP: Erosive Oral lichen planus |
| LP: leukoplakia | ||
| NEOLP: Non-erosive oral lichen planus | ||
| OSCC: Oral squamous cell carcinoma | ||
| Prostate |  | BPH: Benign Prostatic Hyperplasia |
| Thyroid |  | ATC: Anaplastic thyroid cancer |
| HT: Hashimoto's thyroiditis | ||
| PTC: Papillary thyroid cancer |
| ∗log2FC in expression of this searched gene in stem-like cells from each diseased tissue sample relative to stem-like cells in normal samples in each tissue plotted against the malignancy continuum. Samples are colored based on if they are from different disease stage. |
Top |
Malignant transformation related pathway analysis |
| Find out the enriched GO biological processes and KEGG pathways involved in transition from healthy to precancer to cancer |
| Tissue | Disease Stage | Enriched GO biological Processes |
| Colorectum | AD |  |
| Colorectum | SER |  |
| Colorectum | MSS |  |
| Colorectum | MSI-H |  |
| Colorectum | FAP |  |
| ∗Top 15 enriched GO BP terms are showed in the bar plot of each disease state in each tissue. Each row represents a significant GO biological process which is colored according to the -log10(p.adjust). |
| Page: 1 2 3 4 5 6 7 8 9 |
| GO ID | Tissue | Disease Stage | Description | Gene Ratio | Bg Ratio | pvalue | p.adjust | Count |
| GO:0043123 | Colorectum | AD | positive regulation of I-kappaB kinase/NF-kappaB signaling | 60/3918 | 186/18723 | 1.91e-04 | 2.56e-03 | 60 |
| GO:0043122 | Colorectum | AD | regulation of I-kappaB kinase/NF-kappaB signaling | 76/3918 | 249/18723 | 2.17e-04 | 2.85e-03 | 76 |
| GO:0007249 | Colorectum | AD | I-kappaB kinase/NF-kappaB signaling | 82/3918 | 281/18723 | 6.09e-04 | 6.40e-03 | 82 |
| GO:0006650 | Colorectum | AD | glycerophospholipid metabolic process | 83/3918 | 306/18723 | 5.40e-03 | 3.55e-02 | 83 |
| GO:0006644 | Colorectum | AD | phospholipid metabolic process | 101/3918 | 383/18723 | 5.80e-03 | 3.67e-02 | 101 |
| GO:0045017 | Colorectum | AD | glycerolipid biosynthetic process | 69/3918 | 252/18723 | 8.33e-03 | 4.88e-02 | 69 |
| GO:0046486 | Colorectum | SER | glycerolipid metabolic process | 82/2897 | 392/18723 | 2.26e-03 | 2.17e-02 | 82 |
| GO:00066441 | Colorectum | SER | phospholipid metabolic process | 79/2897 | 383/18723 | 3.94e-03 | 3.24e-02 | 79 |
| GO:00450171 | Colorectum | SER | glycerolipid biosynthetic process | 55/2897 | 252/18723 | 4.47e-03 | 3.56e-02 | 55 |
| GO:00066501 | Colorectum | SER | glycerophospholipid metabolic process | 64/2897 | 306/18723 | 6.41e-03 | 4.60e-02 | 64 |
| GO:004312318 | Esophagus | ESCC | positive regulation of I-kappaB kinase/NF-kappaB signaling | 132/8552 | 186/18723 | 2.07e-12 | 8.58e-11 | 132 |
| GO:0043122110 | Esophagus | ESCC | regulation of I-kappaB kinase/NF-kappaB signaling | 167/8552 | 249/18723 | 6.11e-12 | 2.32e-10 | 167 |
| GO:000724919 | Esophagus | ESCC | I-kappaB kinase/NF-kappaB signaling | 183/8552 | 281/18723 | 3.02e-11 | 1.01e-09 | 183 |
| GO:00086544 | Esophagus | ESCC | phospholipid biosynthetic process | 162/8552 | 253/18723 | 2.59e-09 | 5.73e-08 | 162 |
| GO:00464744 | Esophagus | ESCC | glycerophospholipid biosynthetic process | 135/8552 | 211/18723 | 5.75e-08 | 1.02e-06 | 135 |
| GO:00450175 | Esophagus | ESCC | glycerolipid biosynthetic process | 154/8552 | 252/18723 | 5.20e-07 | 6.96e-06 | 154 |
| GO:00066446 | Esophagus | ESCC | phospholipid metabolic process | 218/8552 | 383/18723 | 5.37e-06 | 5.59e-05 | 218 |
| GO:00066561 | Esophagus | ESCC | phosphatidylcholine biosynthetic process | 24/8552 | 29/18723 | 4.50e-05 | 3.55e-04 | 24 |
| GO:00066505 | Esophagus | ESCC | glycerophospholipid metabolic process | 174/8552 | 306/18723 | 4.92e-05 | 3.85e-04 | 174 |
| GO:00464864 | Esophagus | ESCC | glycerolipid metabolic process | 211/8552 | 392/18723 | 6.51e-04 | 3.46e-03 | 211 |
| Page: 1 2 3 |
| Pathway ID | Tissue | Disease Stage | Description | Gene Ratio | Bg Ratio | pvalue | p.adjust | qvalue | Count |
| hsa052319 | Esophagus | ESCC | Choline metabolism in cancer | 61/4205 | 98/8465 | 7.97e-03 | 1.92e-02 | 9.84e-03 | 61 |
| hsa0523114 | Esophagus | ESCC | Choline metabolism in cancer | 61/4205 | 98/8465 | 7.97e-03 | 1.92e-02 | 9.84e-03 | 61 |
| hsa052318 | Oral cavity | EOLP | Choline metabolism in cancer | 25/1218 | 98/8465 | 2.49e-03 | 8.14e-03 | 4.80e-03 | 25 |
| hsa0523113 | Oral cavity | EOLP | Choline metabolism in cancer | 25/1218 | 98/8465 | 2.49e-03 | 8.14e-03 | 4.80e-03 | 25 |
| Page: 1 |
Top |
Cell-cell communication analysis |
| Identification of potential cell-cell interactions between two cell types and their ligand-receptor pairs for different disease states |
| Ligand | Receptor | LRpair | Pathway | Tissue | Disease Stage |
| Page: 1 |
Top |
Single-cell gene regulatory network inference analysis |
| Find out the significant the regulons (TFs) and the target genes of each regulon across cell types for different disease states |
| TF | Cell Type | Tissue | Disease Stage | Target Gene | RSS | Regulon Activity |
| ∗The dot plots of a searched regulon are shown for all cell subpopulations in each disease state of each tissue based on the regulon specific score inferred using pySCENIC and by calculating the average expression. |
| Page: 1 |
Top |
Somatic mutation of malignant transformation related genes |
| Annotation of somatic variants for genes involved in malignant transformation |
| Hugo Symbol | Variant Class | Variant Classification | dbSNP RS | HGVSc | HGVSp | HGVSp Short | SWISSPROT | BIOTYPE | SIFT | PolyPhen | Tumor Sample Barcode | Tissue | Histology | Sex | Age | Stage | Therapy Types | Drugs | Outcome |
| SLC44A2 | SNV | Missense_Mutation | novel | c.617A>G | p.Glu206Gly | p.E206G | Q8IWA5 | protein_coding | tolerated(0.06) | benign(0.006) | TCGA-AN-A0XS-01 | Breast | breast invasive carcinoma | Female | <65 | III/IV | Unknown | Unknown | SD |
| SLC44A2 | SNV | Missense_Mutation | c.824N>T | p.Gly275Val | p.G275V | Q8IWA5 | protein_coding | deleterious(0) | probably_damaging(0.967) | TCGA-GM-A2DO-01 | Breast | breast invasive carcinoma | Female | <65 | I/II | Hormone Therapy | tamoxiphen | CR | |
| SLC44A2 | insertion | In_Frame_Ins | novel | c.495_502+28dupCAAACCCTGTGAGTCAGGGGATCCCAGGAGGCTCAG | Q8IWA5 | protein_coding | TCGA-E2-A1IH-01 | Breast | breast invasive carcinoma | Female | >=65 | I/II | Hormone Therapy | aromasin | SD | ||||
| SLC44A2 | insertion | Frame_Shift_Ins | novel | c.1350dupC | p.Phe451LeufsTer109 | p.F451Lfs*109 | Q8IWA5 | protein_coding | TCGA-OL-A5S0-01 | Breast | breast invasive carcinoma | Female | >=65 | I/II | Chemotherapy | taxol | CR | ||
| SLC44A2 | SNV | Missense_Mutation | novel | c.1754N>C | p.Met585Thr | p.M585T | Q8IWA5 | protein_coding | deleterious(0) | benign(0.062) | TCGA-2W-A8YY-01 | Cervix | cervical & endocervical cancer | Female | <65 | I/II | Chemotherapy | cisplatin | CR |
| SLC44A2 | SNV | Missense_Mutation | novel | c.398N>G | p.Glu133Gly | p.E133G | Q8IWA5 | protein_coding | tolerated(0.06) | benign(0) | TCGA-C5-A902-01 | Cervix | cervical & endocervical cancer | Female | <65 | I/II | Chemotherapy | cisplatin | SD |
| SLC44A2 | SNV | Missense_Mutation | c.312C>G | p.Phe104Leu | p.F104L | Q8IWA5 | protein_coding | tolerated(1) | benign(0.006) | TCGA-EK-A3GN-01 | Cervix | cervical & endocervical cancer | Female | <65 | III/IV | Unknown | Unknown | SD | |
| SLC44A2 | SNV | Missense_Mutation | rs774891025 | c.1623N>A | p.Met541Ile | p.M541I | Q8IWA5 | protein_coding | tolerated(0.11) | benign(0.015) | TCGA-MY-A5BD-01 | Cervix | cervical & endocervical cancer | Female | <65 | I/II | Chemotherapy | cisplatin | CR |
| SLC44A2 | SNV | Missense_Mutation | novel | c.987C>G | p.Ile329Met | p.I329M | Q8IWA5 | protein_coding | deleterious(0.03) | probably_damaging(0.951) | TCGA-MY-A913-01 | Cervix | cervical & endocervical cancer | Female | <65 | I/II | Chemotherapy | cisplatin | CR |
| SLC44A2 | SNV | Missense_Mutation | rs752432975 | c.2047N>A | p.Glu683Lys | p.E683K | Q8IWA5 | protein_coding | deleterious(0.02) | benign(0.324) | TCGA-R2-A69V-01 | Cervix | cervical & endocervical cancer | Female | <65 | I/II | Chemotherapy | cisplatin | SD |
| Page: 1 2 3 4 5 6 7 8 |
Top |
Related drugs of malignant transformation related genes |
| Identification of chemicals and drugs interact with genes involved in malignant transfromation |
| (DGIdb 4.0) |
| Entrez ID | Symbol | Category | Interaction Types | Drug Claim Name | Drug Name | PMIDs |
| Page: 1 |

Copyright 2023-Present -The University of Texas Health Science Center at Houston |