
|
|||||
|
 | |
| |
| |
| |
| |
| |
|
Gene: SLC44A1 |
Gene summary for SLC44A1 |
| Gene information | Species | Human | Gene symbol | SLC44A1 | Gene ID | 23446 |
| Gene name | solute carrier family 44 member 1 | |
| Gene Alias | CD92 | |
| Cytomap | 9q31.1-q31.2 | |
| Gene Type | protein-coding | GO ID | GO:0003008 | UniProtAcc | Q8WWI5 |
Top |
Malignant transformation analysis |
| Identification of the aberrant gene expression in precancerous and cancerous lesions by comparing the gene expression of stem-like cells in diseased tissues with normal stem cells |
| Entrez ID | Symbol | Replicates | Species | Organ | Tissue | Adj P-value | Log2FC | Malignancy |
| 23446 | SLC44A1 | HTA11_1938_2000001011 | Human | Colorectum | AD | 1.19e-03 | 4.84e-01 | -0.0811 |
| 23446 | SLC44A1 | HTA11_78_2000001011 | Human | Colorectum | AD | 5.93e-10 | 8.42e-01 | -0.1088 |
| 23446 | SLC44A1 | HTA11_347_2000001011 | Human | Colorectum | AD | 1.60e-40 | 1.25e+00 | -0.1954 |
| 23446 | SLC44A1 | HTA11_411_2000001011 | Human | Colorectum | SER | 7.28e-07 | 8.36e-01 | -0.2602 |
| 23446 | SLC44A1 | HTA11_83_2000001011 | Human | Colorectum | SER | 1.45e-02 | 5.07e-01 | -0.1526 |
| 23446 | SLC44A1 | HTA11_2992_2000001011 | Human | Colorectum | SER | 2.14e-05 | 7.77e-01 | -0.1706 |
| 23446 | SLC44A1 | HTA11_5212_2000001011 | Human | Colorectum | AD | 1.49e-03 | 6.85e-01 | -0.2061 |
| 23446 | SLC44A1 | HTA11_7862_2000001011 | Human | Colorectum | AD | 4.79e-02 | 5.46e-01 | -0.0179 |
| 23446 | SLC44A1 | HTA11_99999965062_69753 | Human | Colorectum | MSI-H | 1.56e-03 | 9.04e-01 | 0.3487 |
| 23446 | SLC44A1 | HTA11_99999965104_69814 | Human | Colorectum | MSS | 2.59e-09 | 8.05e-01 | 0.281 |
| 23446 | SLC44A1 | HTA11_99999974143_84620 | Human | Colorectum | MSS | 4.02e-07 | -4.07e-01 | 0.3005 |
| 23446 | SLC44A1 | F007 | Human | Colorectum | FAP | 9.82e-06 | -3.79e-01 | 0.1176 |
| 23446 | SLC44A1 | A001-C-207 | Human | Colorectum | FAP | 2.56e-06 | -3.29e-01 | 0.1278 |
| 23446 | SLC44A1 | A015-C-203 | Human | Colorectum | FAP | 1.47e-25 | -3.96e-01 | -0.1294 |
| 23446 | SLC44A1 | A015-C-204 | Human | Colorectum | FAP | 5.50e-07 | -2.80e-01 | -0.0228 |
| 23446 | SLC44A1 | A014-C-040 | Human | Colorectum | FAP | 5.48e-05 | -3.54e-01 | -0.1184 |
| 23446 | SLC44A1 | A002-C-201 | Human | Colorectum | FAP | 6.04e-16 | -3.90e-01 | 0.0324 |
| 23446 | SLC44A1 | A002-C-203 | Human | Colorectum | FAP | 1.10e-04 | -1.65e-01 | 0.2786 |
| 23446 | SLC44A1 | A001-C-119 | Human | Colorectum | FAP | 1.95e-12 | -5.96e-01 | -0.1557 |
| 23446 | SLC44A1 | A001-C-108 | Human | Colorectum | FAP | 2.44e-19 | -4.62e-01 | -0.0272 |
| Page: 1 2 3 4 5 6 7 8 |
| Tissue | Expression Dynamics | Abbreviation |
| Colorectum (GSE201348) |  | FAP: Familial adenomatous polyposis |
| CRC: Colorectal cancer | ||
| Colorectum (HTA11) | 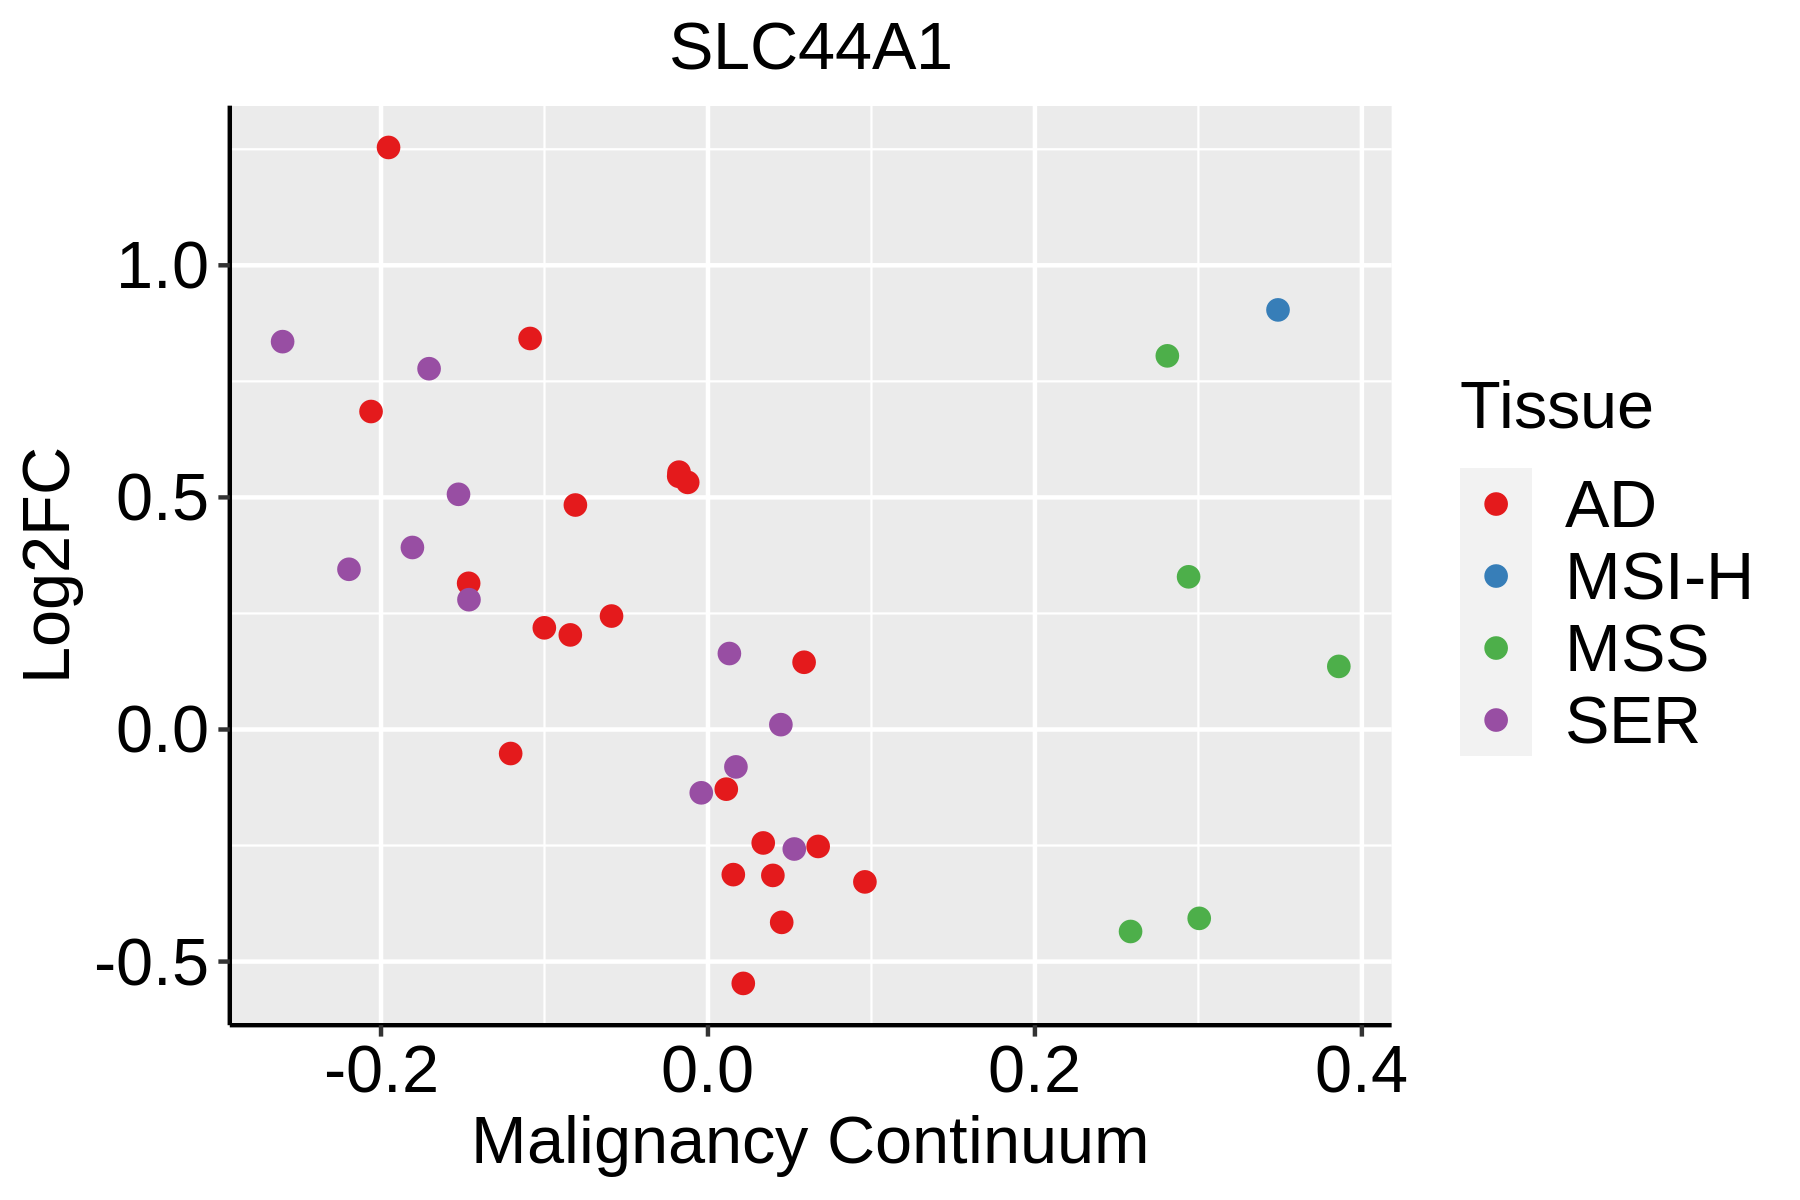 | AD: Adenomas |
| SER: Sessile serrated lesions | ||
| MSI-H: Microsatellite-high colorectal cancer | ||
| MSS: Microsatellite stable colorectal cancer | ||
| Esophagus |  | ESCC: Esophageal squamous cell carcinoma |
| HGIN: High-grade intraepithelial neoplasias | ||
| LGIN: Low-grade intraepithelial neoplasias | ||
| Liver |  | HCC: Hepatocellular carcinoma |
| NAFLD: Non-alcoholic fatty liver disease | ||
| Oral Cavity | 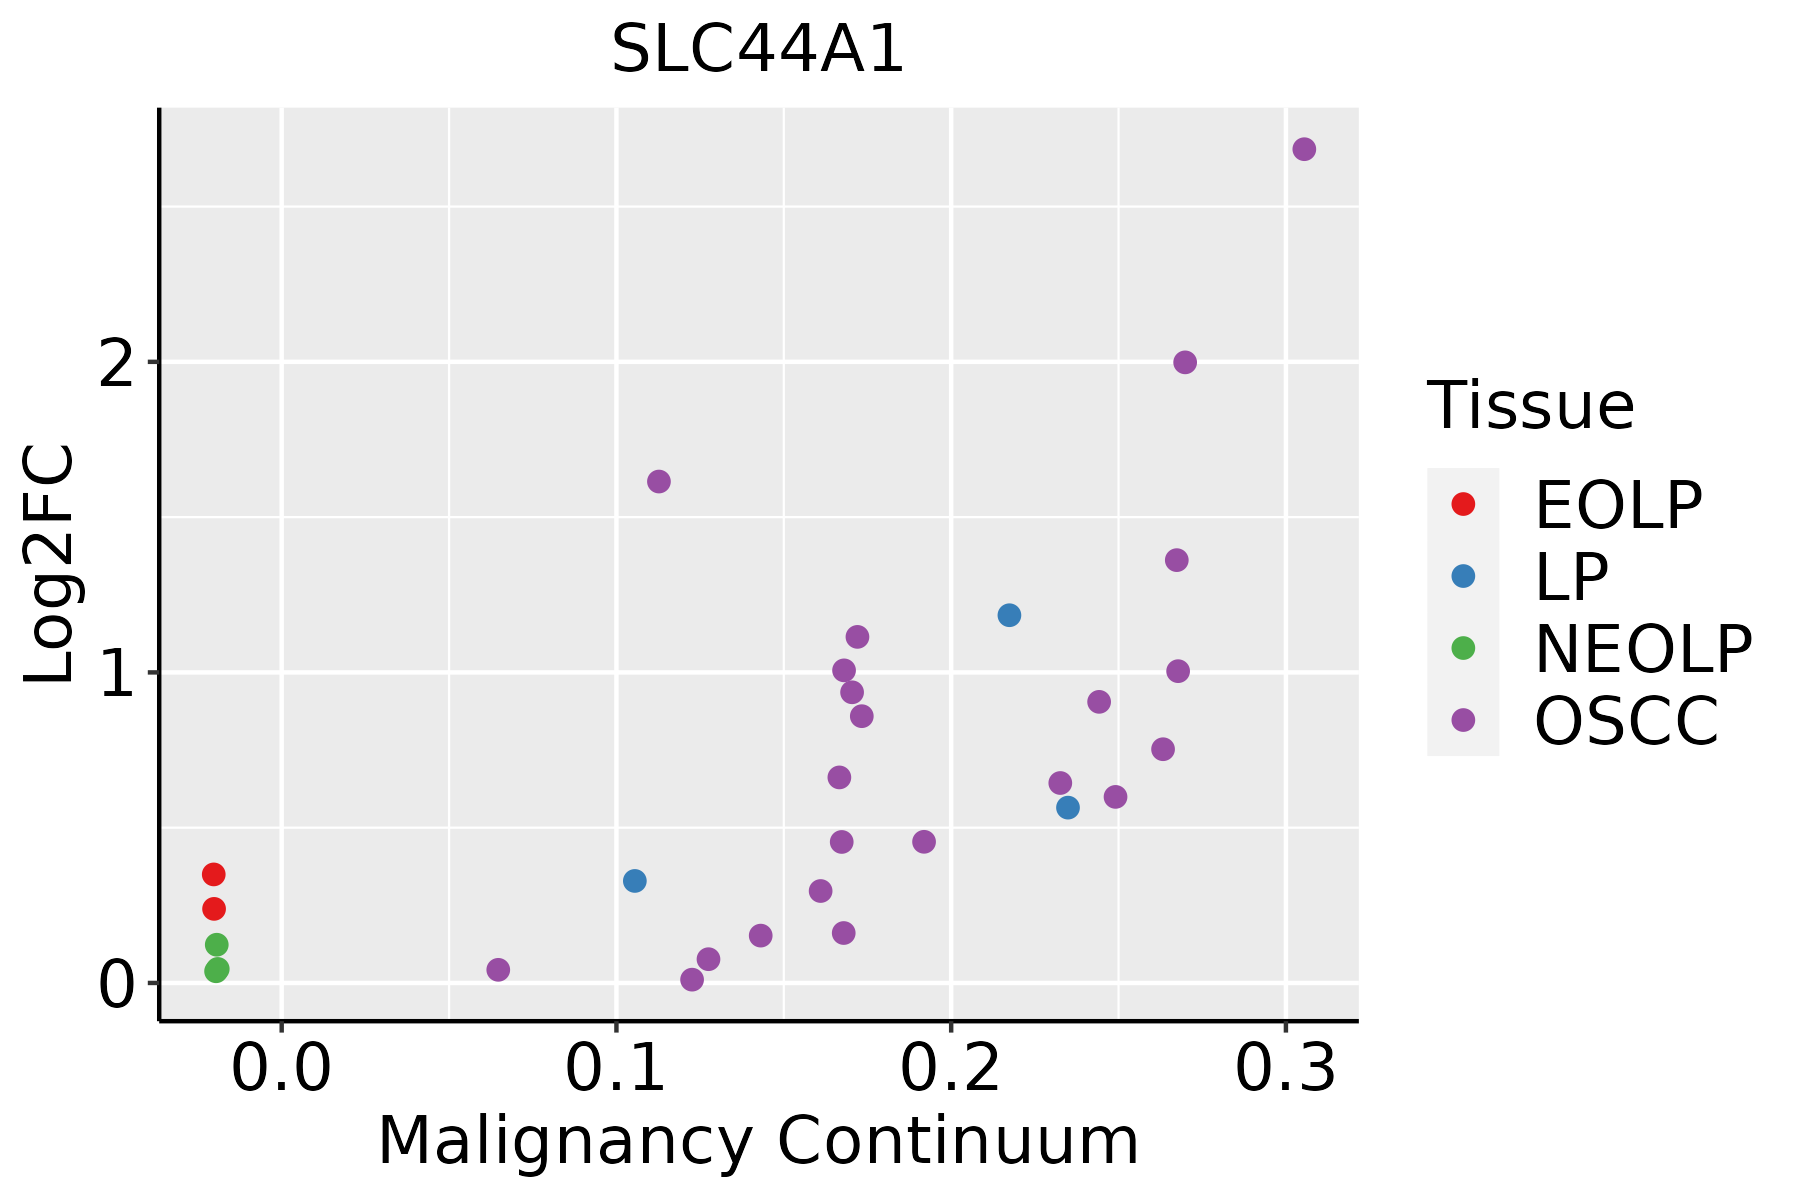 | EOLP: Erosive Oral lichen planus |
| LP: leukoplakia | ||
| NEOLP: Non-erosive oral lichen planus | ||
| OSCC: Oral squamous cell carcinoma | ||
| Skin | 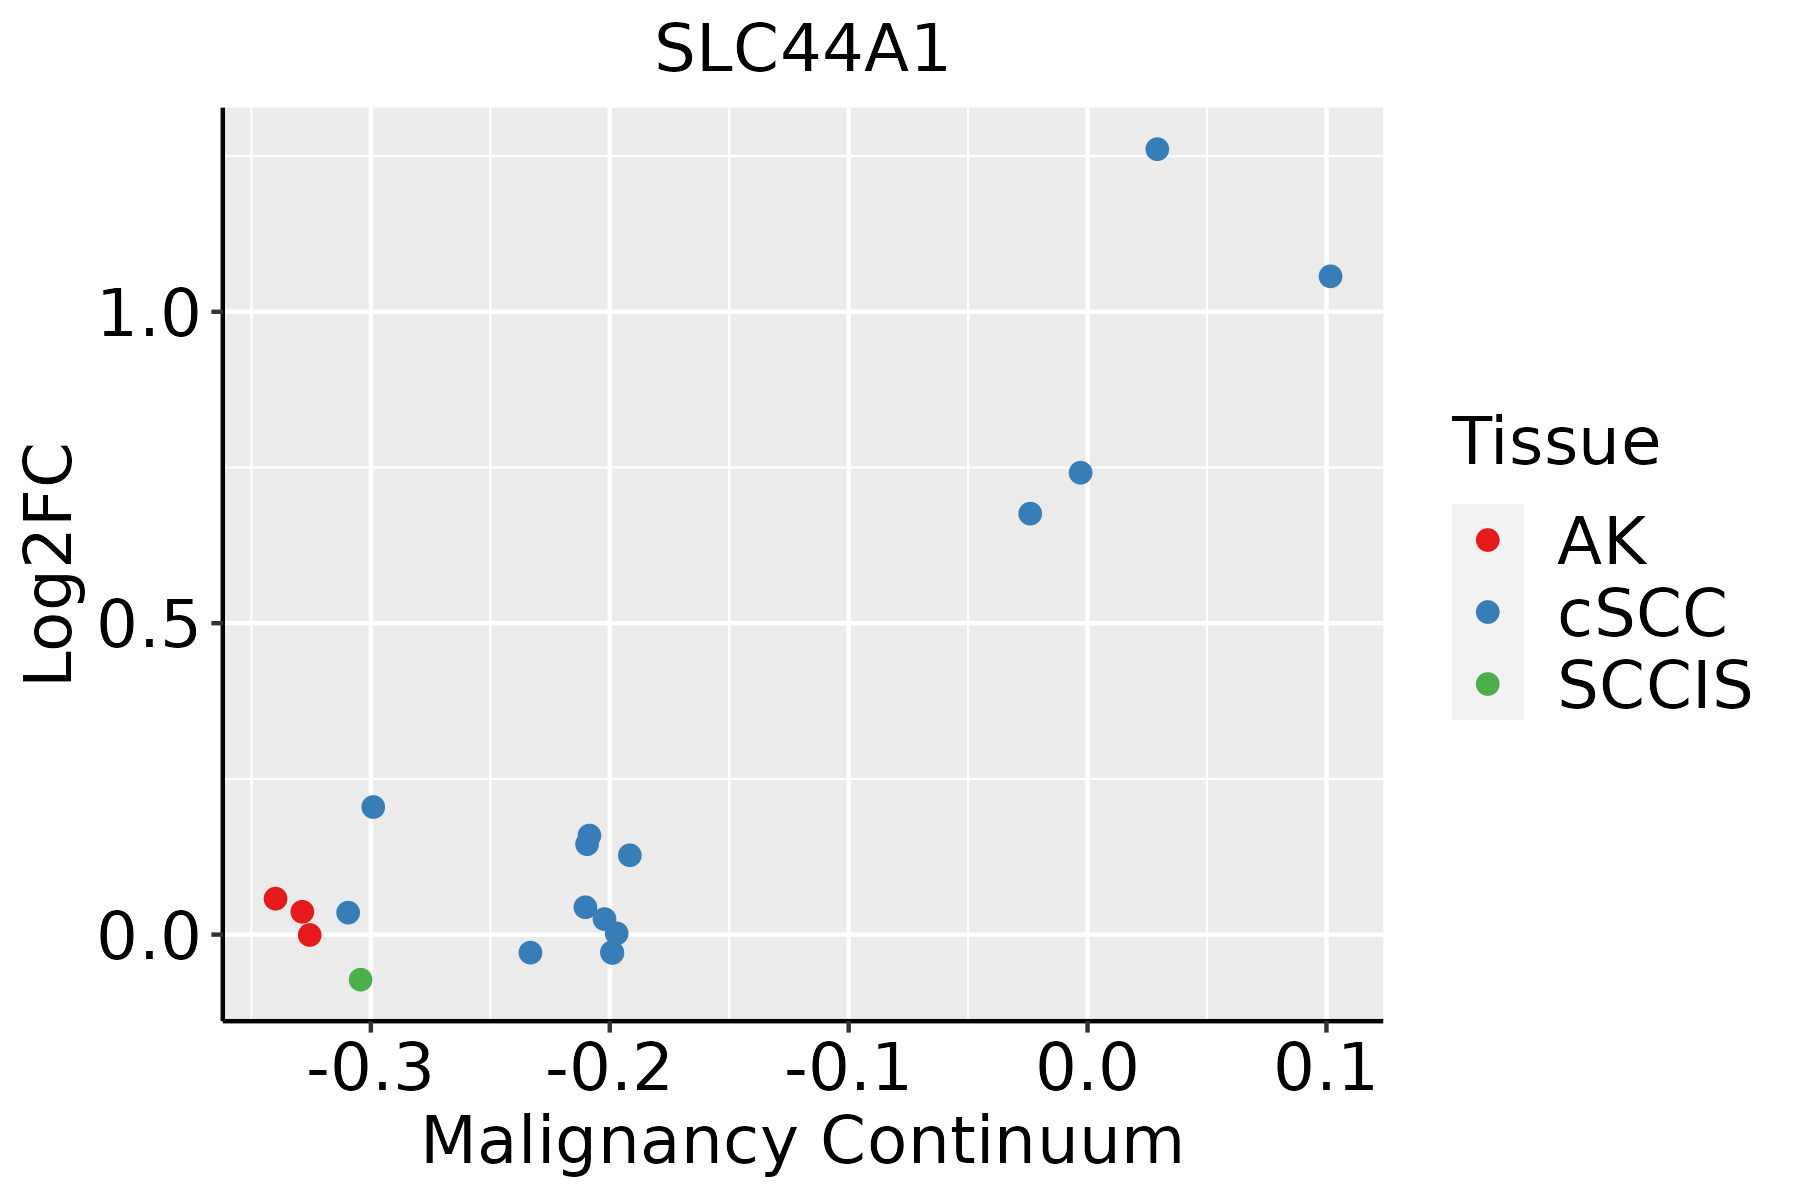 | AK: Actinic keratosis |
| cSCC: Cutaneous squamous cell carcinoma | ||
| SCCIS:squamous cell carcinoma in situ | ||
| Thyroid | 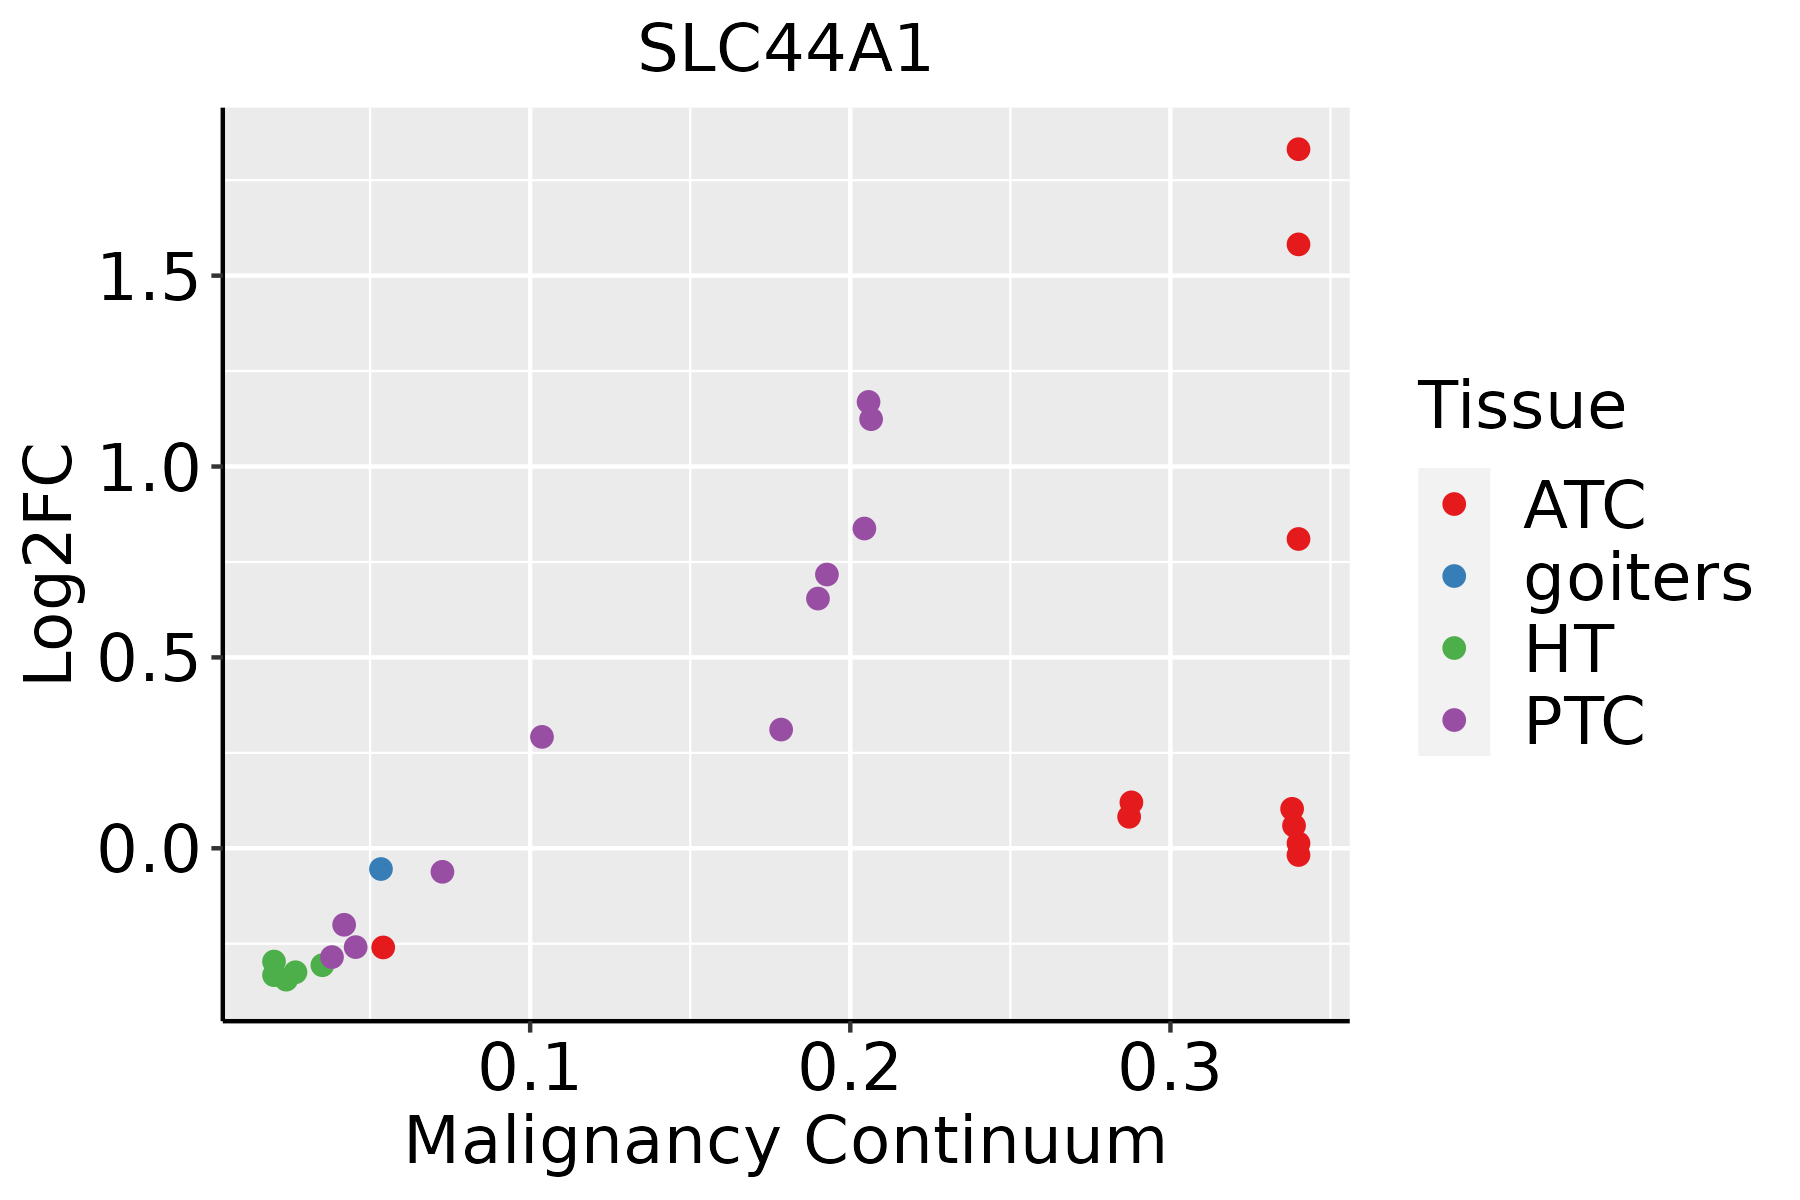 | ATC: Anaplastic thyroid cancer |
| HT: Hashimoto's thyroiditis | ||
| PTC: Papillary thyroid cancer |
| ∗log2FC in expression of this searched gene in stem-like cells from each diseased tissue sample relative to stem-like cells in normal samples in each tissue plotted against the malignancy continuum. Samples are colored based on if they are from different disease stage. |
Top |
Malignant transformation related pathway analysis |
| Find out the enriched GO biological processes and KEGG pathways involved in transition from healthy to precancer to cancer |
| Tissue | Disease Stage | Enriched GO biological Processes |
| Colorectum | AD |  |
| Colorectum | SER |  |
| Colorectum | MSS |  |
| Colorectum | MSI-H |  |
| Colorectum | FAP |  |
| ∗Top 15 enriched GO BP terms are showed in the bar plot of each disease state in each tissue. Each row represents a significant GO biological process which is colored according to the -log10(p.adjust). |
| Page: 1 2 3 4 5 6 7 8 9 |
| GO ID | Tissue | Disease Stage | Description | Gene Ratio | Bg Ratio | pvalue | p.adjust | Count |
| GO:0006650 | Colorectum | AD | glycerophospholipid metabolic process | 83/3918 | 306/18723 | 5.40e-03 | 3.55e-02 | 83 |
| GO:0006644 | Colorectum | AD | phospholipid metabolic process | 101/3918 | 383/18723 | 5.80e-03 | 3.67e-02 | 101 |
| GO:0045017 | Colorectum | AD | glycerolipid biosynthetic process | 69/3918 | 252/18723 | 8.33e-03 | 4.88e-02 | 69 |
| GO:0046486 | Colorectum | SER | glycerolipid metabolic process | 82/2897 | 392/18723 | 2.26e-03 | 2.17e-02 | 82 |
| GO:00066441 | Colorectum | SER | phospholipid metabolic process | 79/2897 | 383/18723 | 3.94e-03 | 3.24e-02 | 79 |
| GO:00450171 | Colorectum | SER | glycerolipid biosynthetic process | 55/2897 | 252/18723 | 4.47e-03 | 3.56e-02 | 55 |
| GO:00066501 | Colorectum | SER | glycerophospholipid metabolic process | 64/2897 | 306/18723 | 6.41e-03 | 4.60e-02 | 64 |
| GO:0150104 | Colorectum | MSS | transport across blood-brain barrier | 28/3467 | 87/18723 | 1.54e-03 | 1.41e-02 | 28 |
| GO:0010232 | Colorectum | MSS | vascular transport | 28/3467 | 88/18723 | 1.87e-03 | 1.64e-02 | 28 |
| GO:01501041 | Colorectum | FAP | transport across blood-brain barrier | 25/2622 | 87/18723 | 2.63e-04 | 3.59e-03 | 25 |
| GO:00102321 | Colorectum | FAP | vascular transport | 25/2622 | 88/18723 | 3.19e-04 | 4.12e-03 | 25 |
| GO:0003018 | Colorectum | FAP | vascular process in circulatory system | 56/2622 | 263/18723 | 7.67e-04 | 8.12e-03 | 56 |
| GO:0008654 | Colorectum | FAP | phospholipid biosynthetic process | 54/2622 | 253/18723 | 8.88e-04 | 9.08e-03 | 54 |
| GO:00066502 | Colorectum | FAP | glycerophospholipid metabolic process | 62/2622 | 306/18723 | 1.54e-03 | 1.38e-02 | 62 |
| GO:00066442 | Colorectum | FAP | phospholipid metabolic process | 74/2622 | 383/18723 | 2.24e-03 | 1.83e-02 | 74 |
| GO:0046474 | Colorectum | FAP | glycerophospholipid biosynthetic process | 44/2622 | 211/18723 | 3.98e-03 | 2.76e-02 | 44 |
| GO:00450172 | Colorectum | FAP | glycerolipid biosynthetic process | 50/2622 | 252/18723 | 6.32e-03 | 3.95e-02 | 50 |
| GO:00086541 | Colorectum | CRC | phospholipid biosynthetic process | 49/2078 | 253/18723 | 7.07e-05 | 1.51e-03 | 49 |
| GO:00066503 | Colorectum | CRC | glycerophospholipid metabolic process | 55/2078 | 306/18723 | 2.10e-04 | 3.55e-03 | 55 |
| GO:00450173 | Colorectum | CRC | glycerolipid biosynthetic process | 47/2078 | 252/18723 | 2.47e-04 | 4.06e-03 | 47 |
| Page: 1 2 3 |
| Pathway ID | Tissue | Disease Stage | Description | Gene Ratio | Bg Ratio | pvalue | p.adjust | qvalue | Count |
| hsa05231 | Colorectum | MSS | Choline metabolism in cancer | 34/1875 | 98/8465 | 2.90e-03 | 1.39e-02 | 8.50e-03 | 34 |
| hsa052311 | Colorectum | MSS | Choline metabolism in cancer | 34/1875 | 98/8465 | 2.90e-03 | 1.39e-02 | 8.50e-03 | 34 |
| hsa052312 | Colorectum | FAP | Choline metabolism in cancer | 29/1404 | 98/8465 | 9.03e-04 | 5.20e-03 | 3.16e-03 | 29 |
| hsa052313 | Colorectum | FAP | Choline metabolism in cancer | 29/1404 | 98/8465 | 9.03e-04 | 5.20e-03 | 3.16e-03 | 29 |
| hsa052319 | Esophagus | ESCC | Choline metabolism in cancer | 61/4205 | 98/8465 | 7.97e-03 | 1.92e-02 | 9.84e-03 | 61 |
| hsa0523114 | Esophagus | ESCC | Choline metabolism in cancer | 61/4205 | 98/8465 | 7.97e-03 | 1.92e-02 | 9.84e-03 | 61 |
| hsa052316 | Liver | HCC | Choline metabolism in cancer | 57/4020 | 98/8465 | 2.14e-02 | 4.90e-02 | 2.72e-02 | 57 |
| hsa0523111 | Liver | HCC | Choline metabolism in cancer | 57/4020 | 98/8465 | 2.14e-02 | 4.90e-02 | 2.72e-02 | 57 |
| Page: 1 |
Top |
Cell-cell communication analysis |
| Identification of potential cell-cell interactions between two cell types and their ligand-receptor pairs for different disease states |
| Ligand | Receptor | LRpair | Pathway | Tissue | Disease Stage |
| Page: 1 |
Top |
Single-cell gene regulatory network inference analysis |
| Find out the significant the regulons (TFs) and the target genes of each regulon across cell types for different disease states |
| TF | Cell Type | Tissue | Disease Stage | Target Gene | RSS | Regulon Activity |
| ∗The dot plots of a searched regulon are shown for all cell subpopulations in each disease state of each tissue based on the regulon specific score inferred using pySCENIC and by calculating the average expression. |
| Page: 1 |
Top |
Somatic mutation of malignant transformation related genes |
| Annotation of somatic variants for genes involved in malignant transformation |
| Hugo Symbol | Variant Class | Variant Classification | dbSNP RS | HGVSc | HGVSp | HGVSp Short | SWISSPROT | BIOTYPE | SIFT | PolyPhen | Tumor Sample Barcode | Tissue | Histology | Sex | Age | Stage | Therapy Types | Drugs | Outcome |
| SLC44A1 | SNV | Missense_Mutation | rs775962181 | c.847G>C | p.Glu283Gln | p.E283Q | Q8WWI5 | protein_coding | tolerated(0.26) | benign(0.01) | TCGA-A8-A06Q-01 | Breast | breast invasive carcinoma | Female | <65 | III/IV | Unknown | Unknown | SD |
| SLC44A1 | SNV | Missense_Mutation | c.1553C>T | p.Ala518Val | p.A518V | Q8WWI5 | protein_coding | deleterious(0.03) | probably_damaging(0.999) | TCGA-A8-A09Z-01 | Breast | breast invasive carcinoma | Female | >=65 | I/II | Unknown | Unknown | SD | |
| SLC44A1 | SNV | Missense_Mutation | novel | c.136T>C | p.Cys46Arg | p.C46R | Q8WWI5 | protein_coding | deleterious(0.01) | probably_damaging(0.994) | TCGA-AC-A5EH-01 | Breast | breast invasive carcinoma | Female | >=65 | I/II | Unknown | Unknown | SD |
| SLC44A1 | SNV | Missense_Mutation | rs201488869 | c.1955N>T | p.Ser652Leu | p.S652L | Q8WWI5 | protein_coding | tolerated(0.27) | benign(0.012) | TCGA-AN-A046-01 | Breast | breast invasive carcinoma | Female | >=65 | I/II | Unknown | Unknown | SD |
| SLC44A1 | SNV | Missense_Mutation | rs759502338 | c.70N>T | p.Arg24Cys | p.R24C | Q8WWI5 | protein_coding | deleterious(0) | possibly_damaging(0.635) | TCGA-BH-A18G-01 | Breast | breast invasive carcinoma | Female | >=65 | I/II | Unknown | Unknown | SD |
| SLC44A1 | SNV | Missense_Mutation | rs748507423 | c.1309C>T | p.Arg437Cys | p.R437C | Q8WWI5 | protein_coding | tolerated(0.35) | benign(0.018) | TCGA-C8-A1HM-01 | Breast | breast invasive carcinoma | Female | >=65 | I/II | Chemotherapy | doxorubicin | CR |
| SLC44A1 | SNV | Missense_Mutation | rs749635231 | c.1073N>C | p.Phe358Ser | p.F358S | Q8WWI5 | protein_coding | tolerated(0.57) | benign(0.018) | TCGA-E2-A14S-01 | Breast | breast invasive carcinoma | Female | >=65 | I/II | Chemotherapy | cytoxan | SD |
| SLC44A1 | SNV | Missense_Mutation | c.1735N>T | p.Ala579Ser | p.A579S | Q8WWI5 | protein_coding | tolerated(0.19) | benign(0.166) | TCGA-OL-A6VQ-01 | Breast | breast invasive carcinoma | Female | <65 | I/II | Unknown | Unknown | SD | |
| SLC44A1 | SNV | Missense_Mutation | rs768207933 | c.524N>A | p.Arg175His | p.R175H | Q8WWI5 | protein_coding | deleterious(0) | probably_damaging(0.926) | TCGA-2W-A8YY-01 | Cervix | cervical & endocervical cancer | Female | <65 | I/II | Chemotherapy | cisplatin | CR |
| SLC44A1 | SNV | Missense_Mutation | novel | c.440N>T | p.Ser147Phe | p.S147F | Q8WWI5 | protein_coding | tolerated(0.32) | benign(0.031) | TCGA-C5-A7CG-01 | Cervix | cervical & endocervical cancer | Female | <65 | I/II | Unknown | Unknown | SD |
| Page: 1 2 3 4 5 6 7 8 |
Top |
Related drugs of malignant transformation related genes |
| Identification of chemicals and drugs interact with genes involved in malignant transfromation |
| (DGIdb 4.0) |
| Entrez ID | Symbol | Category | Interaction Types | Drug Claim Name | Drug Name | PMIDs |
| 23446 | SLC44A1 | TRANSPORTER, DRUGGABLE GENOME | inhibitor | 178101222 | HEMICHOLINIUM-3 |
| Page: 1 |

Copyright 2023-Present -The University of Texas Health Science Center at Houston |