
|
|||||
|
 | |
| |
| |
| |
| |
| |
|
Gene: SLC39A8 |
Gene summary for SLC39A8 |
| Gene information | Species | Human | Gene symbol | SLC39A8 | Gene ID | 64116 |
| Gene name | solute carrier family 39 member 8 | |
| Gene Alias | BIGM103 | |
| Cytomap | 4q24 | |
| Gene Type | protein-coding | GO ID | GO:0000041 | UniProtAcc | A0A024RDG0 |
Top |
Malignant transformation analysis |
| Identification of the aberrant gene expression in precancerous and cancerous lesions by comparing the gene expression of stem-like cells in diseased tissues with normal stem cells |
| Entrez ID | Symbol | Replicates | Species | Organ | Tissue | Adj P-value | Log2FC | Malignancy |
| 64116 | SLC39A8 | HTA11_3410_2000001011 | Human | Colorectum | AD | 2.74e-17 | -6.90e-01 | 0.0155 |
| 64116 | SLC39A8 | HTA11_2487_2000001011 | Human | Colorectum | SER | 4.05e-07 | -5.97e-01 | -0.1808 |
| 64116 | SLC39A8 | HTA11_1938_2000001011 | Human | Colorectum | AD | 1.88e-02 | -5.45e-01 | -0.0811 |
| 64116 | SLC39A8 | HTA11_3361_2000001011 | Human | Colorectum | AD | 1.62e-06 | -6.66e-01 | -0.1207 |
| 64116 | SLC39A8 | HTA11_83_2000001011 | Human | Colorectum | SER | 3.57e-02 | -5.19e-01 | -0.1526 |
| 64116 | SLC39A8 | HTA11_696_2000001011 | Human | Colorectum | AD | 2.42e-10 | -5.12e-01 | -0.1464 |
| 64116 | SLC39A8 | HTA11_866_2000001011 | Human | Colorectum | AD | 3.97e-07 | -4.22e-01 | -0.1001 |
| 64116 | SLC39A8 | HTA11_866_3004761011 | Human | Colorectum | AD | 3.03e-10 | -6.11e-01 | 0.096 |
| 64116 | SLC39A8 | HTA11_10711_2000001011 | Human | Colorectum | AD | 6.34e-05 | -5.94e-01 | 0.0338 |
| 64116 | SLC39A8 | HTA11_7696_3000711011 | Human | Colorectum | AD | 2.90e-16 | -5.89e-01 | 0.0674 |
| 64116 | SLC39A8 | HTA11_6818_2000001021 | Human | Colorectum | AD | 1.69e-06 | -6.70e-01 | 0.0588 |
| 64116 | SLC39A8 | HTA11_99999970781_79442 | Human | Colorectum | MSS | 4.26e-13 | -5.09e-01 | 0.294 |
| 64116 | SLC39A8 | HTA11_99999971662_82457 | Human | Colorectum | MSS | 2.55e-23 | -6.62e-01 | 0.3859 |
| 64116 | SLC39A8 | HTA11_99999973899_84307 | Human | Colorectum | MSS | 6.36e-09 | -7.61e-01 | 0.2585 |
| 64116 | SLC39A8 | HTA11_99999974143_84620 | Human | Colorectum | MSS | 1.12e-33 | -7.59e-01 | 0.3005 |
| 64116 | SLC39A8 | A001-C-207 | Human | Colorectum | FAP | 2.09e-06 | -4.89e-01 | 0.1278 |
| 64116 | SLC39A8 | A015-C-203 | Human | Colorectum | FAP | 2.92e-23 | -4.96e-01 | -0.1294 |
| 64116 | SLC39A8 | A015-C-204 | Human | Colorectum | FAP | 5.73e-09 | -5.40e-01 | -0.0228 |
| 64116 | SLC39A8 | A014-C-040 | Human | Colorectum | FAP | 6.67e-03 | -4.07e-01 | -0.1184 |
| 64116 | SLC39A8 | A002-C-201 | Human | Colorectum | FAP | 2.42e-13 | -4.45e-01 | 0.0324 |
| Page: 1 2 3 4 |
| Tissue | Expression Dynamics | Abbreviation |
| Colorectum (GSE201348) |  | FAP: Familial adenomatous polyposis |
| CRC: Colorectal cancer | ||
| Colorectum (HTA11) |  | AD: Adenomas |
| SER: Sessile serrated lesions | ||
| MSI-H: Microsatellite-high colorectal cancer | ||
| MSS: Microsatellite stable colorectal cancer | ||
| Liver | 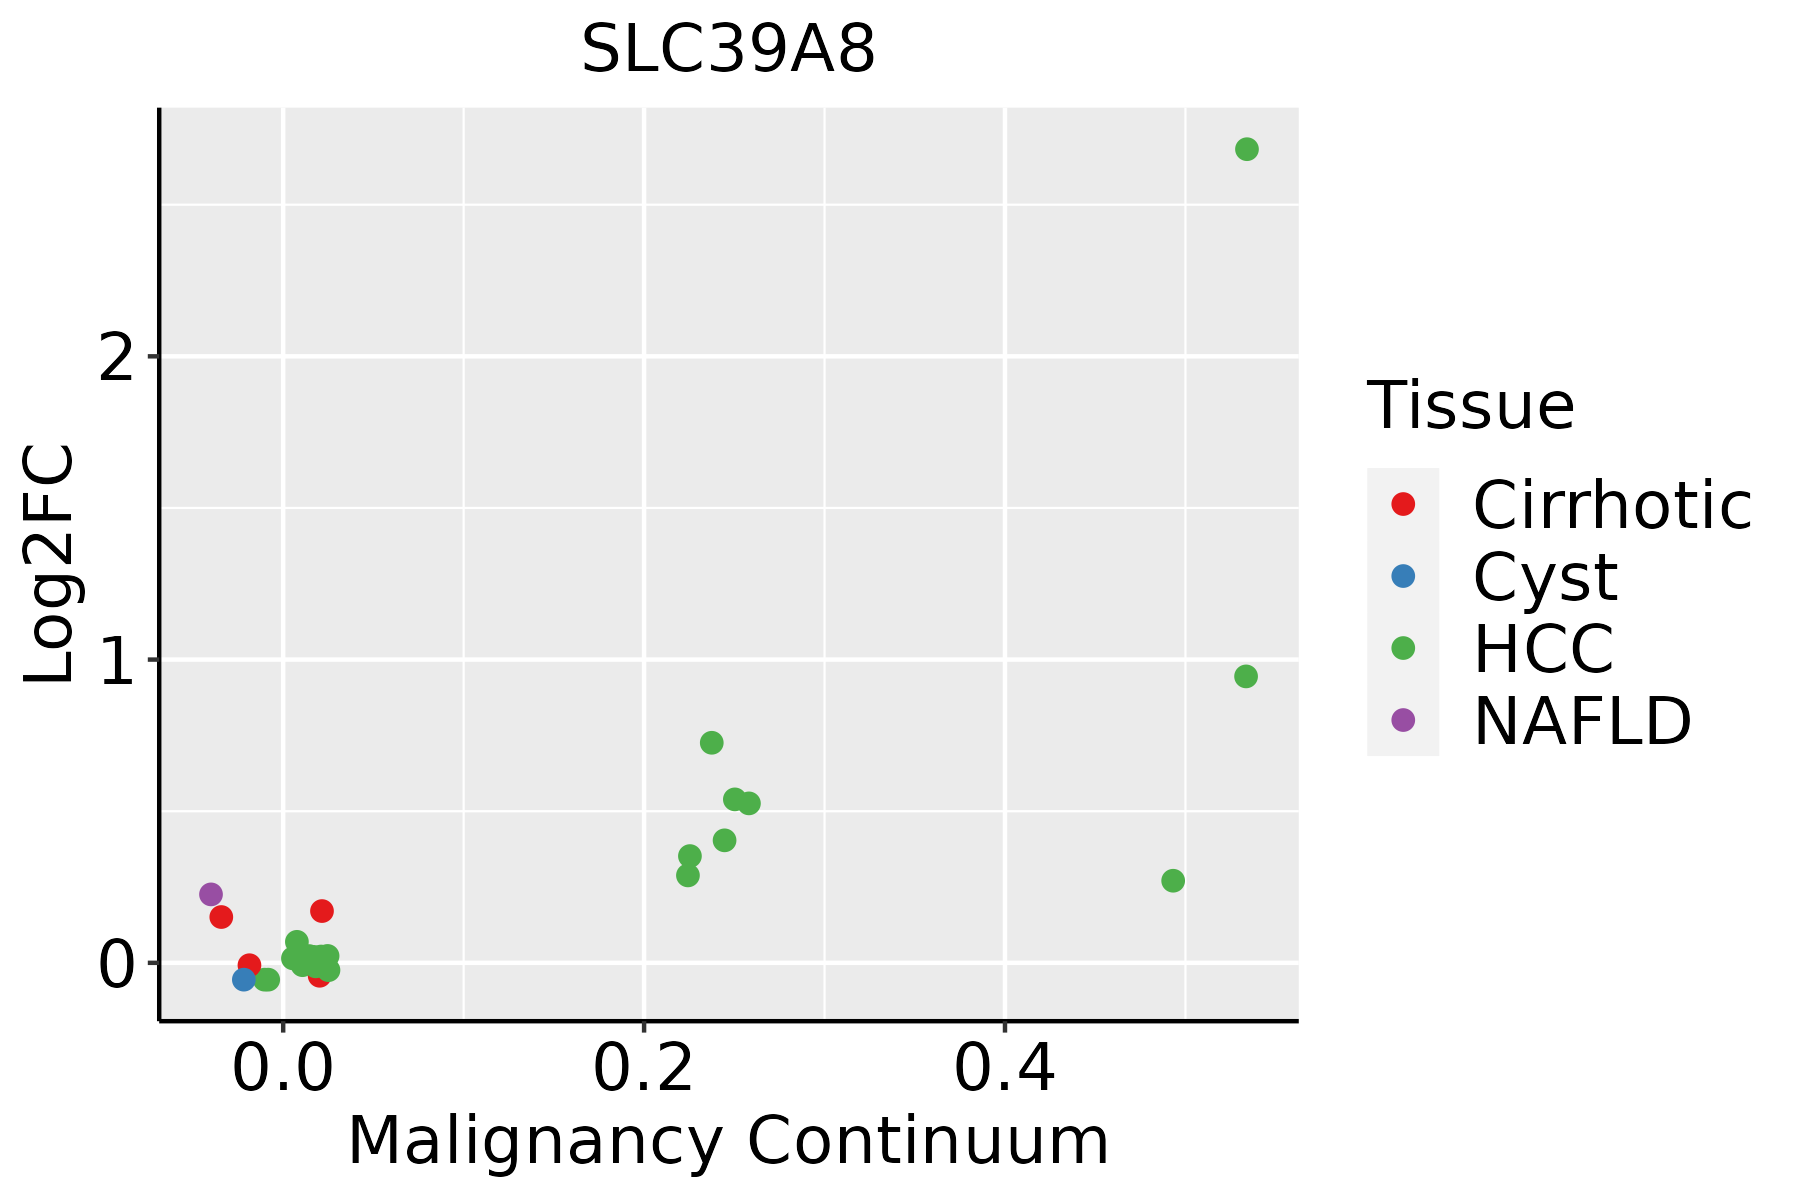 | HCC: Hepatocellular carcinoma |
| NAFLD: Non-alcoholic fatty liver disease | ||
| Lung | 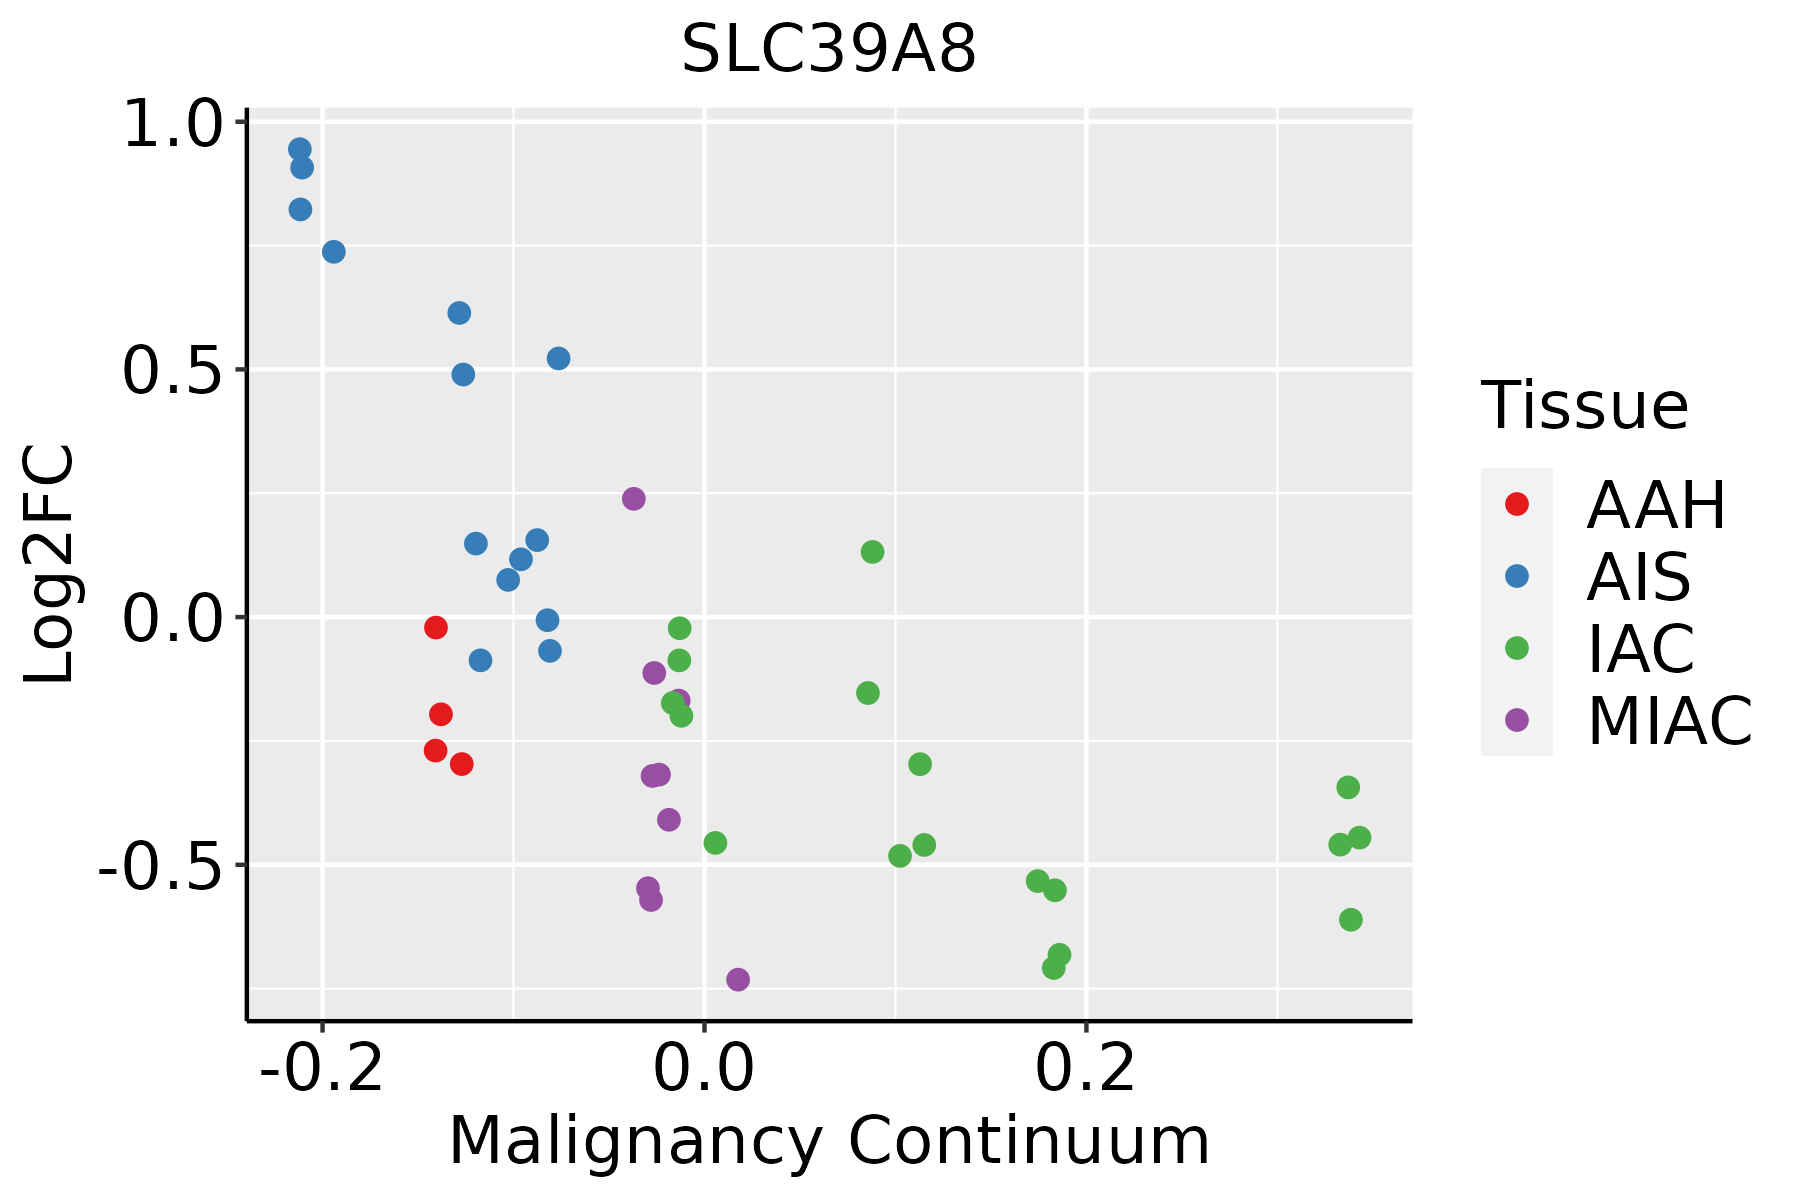 | AAH: Atypical adenomatous hyperplasia |
| AIS: Adenocarcinoma in situ | ||
| IAC: Invasive lung adenocarcinoma | ||
| MIA: Minimally invasive adenocarcinoma | ||
| Prostate |  | BPH: Benign Prostatic Hyperplasia |
| ∗log2FC in expression of this searched gene in stem-like cells from each diseased tissue sample relative to stem-like cells in normal samples in each tissue plotted against the malignancy continuum. Samples are colored based on if they are from different disease stage. |
Top |
Malignant transformation related pathway analysis |
| Find out the enriched GO biological processes and KEGG pathways involved in transition from healthy to precancer to cancer |
| Tissue | Disease Stage | Enriched GO biological Processes |
| Colorectum | AD |  |
| Colorectum | SER |  |
| Colorectum | MSS |  |
| Colorectum | MSI-H |  |
| Colorectum | FAP |  |
| ∗Top 15 enriched GO BP terms are showed in the bar plot of each disease state in each tissue. Each row represents a significant GO biological process which is colored according to the -log10(p.adjust). |
| Page: 1 2 3 4 5 6 7 8 9 |
| GO ID | Tissue | Disease Stage | Description | Gene Ratio | Bg Ratio | pvalue | p.adjust | Count |
| GO:0006839 | Colorectum | AD | mitochondrial transport | 102/3918 | 254/18723 | 1.87e-12 | 3.08e-10 | 102 |
| GO:1990542 | Colorectum | AD | mitochondrial transmembrane transport | 47/3918 | 102/18723 | 1.09e-08 | 6.52e-07 | 47 |
| GO:0055076 | Colorectum | AD | transition metal ion homeostasis | 53/3918 | 138/18723 | 1.89e-06 | 5.65e-05 | 53 |
| GO:0046916 | Colorectum | AD | cellular transition metal ion homeostasis | 43/3918 | 115/18723 | 3.62e-05 | 6.56e-04 | 43 |
| GO:0060249 | Colorectum | AD | anatomical structure homeostasis | 94/3918 | 314/18723 | 9.37e-05 | 1.42e-03 | 94 |
| GO:0001894 | Colorectum | AD | tissue homeostasis | 81/3918 | 268/18723 | 1.96e-04 | 2.62e-03 | 81 |
| GO:0055072 | Colorectum | AD | iron ion homeostasis | 32/3918 | 85/18723 | 2.97e-04 | 3.60e-03 | 32 |
| GO:0055069 | Colorectum | AD | zinc ion homeostasis | 18/3918 | 40/18723 | 5.36e-04 | 5.74e-03 | 18 |
| GO:0006882 | Colorectum | AD | cellular zinc ion homeostasis | 17/3918 | 38/18723 | 8.26e-04 | 8.13e-03 | 17 |
| GO:0006487 | Colorectum | AD | protein N-linked glycosylation | 25/3918 | 65/18723 | 9.12e-04 | 8.71e-03 | 25 |
| GO:0006520 | Colorectum | AD | cellular amino acid metabolic process | 81/3918 | 284/18723 | 1.37e-03 | 1.19e-02 | 81 |
| GO:0006879 | Colorectum | AD | cellular iron ion homeostasis | 25/3918 | 67/18723 | 1.51e-03 | 1.27e-02 | 25 |
| GO:0006486 | Colorectum | AD | protein glycosylation | 64/3918 | 226/18723 | 4.86e-03 | 3.27e-02 | 64 |
| GO:0043413 | Colorectum | AD | macromolecule glycosylation | 64/3918 | 226/18723 | 4.86e-03 | 3.27e-02 | 64 |
| GO:0070085 | Colorectum | AD | glycosylation | 67/3918 | 240/18723 | 5.78e-03 | 3.67e-02 | 67 |
| GO:0015698 | Colorectum | AD | inorganic anion transport | 52/3918 | 180/18723 | 6.83e-03 | 4.22e-02 | 52 |
| GO:0071421 | Colorectum | AD | manganese ion transmembrane transport | 6/3918 | 10/18723 | 8.03e-03 | 4.73e-02 | 6 |
| GO:00068391 | Colorectum | SER | mitochondrial transport | 87/2897 | 254/18723 | 7.91e-14 | 3.03e-11 | 87 |
| GO:19905421 | Colorectum | SER | mitochondrial transmembrane transport | 42/2897 | 102/18723 | 3.65e-10 | 4.77e-08 | 42 |
| GO:00550761 | Colorectum | SER | transition metal ion homeostasis | 41/2897 | 138/18723 | 1.66e-05 | 5.05e-04 | 41 |
| Page: 1 2 3 4 5 |
| Pathway ID | Tissue | Disease Stage | Description | Gene Ratio | Bg Ratio | pvalue | p.adjust | qvalue | Count |
| hsa05012 | Colorectum | AD | Parkinson disease | 147/2092 | 266/8465 | 2.53e-27 | 8.48e-25 | 5.41e-25 | 147 |
| hsa05010 | Colorectum | AD | Alzheimer disease | 174/2092 | 384/8465 | 1.82e-19 | 9.26e-18 | 5.91e-18 | 174 |
| hsa04216 | Colorectum | AD | Ferroptosis | 21/2092 | 41/8465 | 2.23e-04 | 1.78e-03 | 1.13e-03 | 21 |
| hsa050121 | Colorectum | AD | Parkinson disease | 147/2092 | 266/8465 | 2.53e-27 | 8.48e-25 | 5.41e-25 | 147 |
| hsa050101 | Colorectum | AD | Alzheimer disease | 174/2092 | 384/8465 | 1.82e-19 | 9.26e-18 | 5.91e-18 | 174 |
| hsa042161 | Colorectum | AD | Ferroptosis | 21/2092 | 41/8465 | 2.23e-04 | 1.78e-03 | 1.13e-03 | 21 |
| hsa050122 | Colorectum | SER | Parkinson disease | 132/1580 | 266/8465 | 2.72e-31 | 9.03e-29 | 6.55e-29 | 132 |
| hsa050102 | Colorectum | SER | Alzheimer disease | 146/1580 | 384/8465 | 6.52e-20 | 2.40e-18 | 1.75e-18 | 146 |
| hsa050123 | Colorectum | SER | Parkinson disease | 132/1580 | 266/8465 | 2.72e-31 | 9.03e-29 | 6.55e-29 | 132 |
| hsa050103 | Colorectum | SER | Alzheimer disease | 146/1580 | 384/8465 | 6.52e-20 | 2.40e-18 | 1.75e-18 | 146 |
| hsa050124 | Colorectum | MSS | Parkinson disease | 140/1875 | 266/8465 | 2.32e-28 | 7.79e-26 | 4.77e-26 | 140 |
| hsa050104 | Colorectum | MSS | Alzheimer disease | 169/1875 | 384/8465 | 1.21e-22 | 1.01e-20 | 6.21e-21 | 169 |
| hsa042162 | Colorectum | MSS | Ferroptosis | 18/1875 | 41/8465 | 1.53e-03 | 8.53e-03 | 5.23e-03 | 18 |
| hsa050125 | Colorectum | MSS | Parkinson disease | 140/1875 | 266/8465 | 2.32e-28 | 7.79e-26 | 4.77e-26 | 140 |
| hsa050105 | Colorectum | MSS | Alzheimer disease | 169/1875 | 384/8465 | 1.21e-22 | 1.01e-20 | 6.21e-21 | 169 |
| hsa042163 | Colorectum | MSS | Ferroptosis | 18/1875 | 41/8465 | 1.53e-03 | 8.53e-03 | 5.23e-03 | 18 |
| hsa050128 | Colorectum | FAP | Parkinson disease | 80/1404 | 266/8465 | 2.04e-08 | 6.20e-07 | 3.77e-07 | 80 |
| hsa050108 | Colorectum | FAP | Alzheimer disease | 105/1404 | 384/8465 | 3.74e-08 | 1.04e-06 | 6.33e-07 | 105 |
| hsa042164 | Colorectum | FAP | Ferroptosis | 18/1404 | 41/8465 | 3.49e-05 | 3.65e-04 | 2.22e-04 | 18 |
| hsa050129 | Colorectum | FAP | Parkinson disease | 80/1404 | 266/8465 | 2.04e-08 | 6.20e-07 | 3.77e-07 | 80 |
| Page: 1 2 3 |
Top |
Cell-cell communication analysis |
| Identification of potential cell-cell interactions between two cell types and their ligand-receptor pairs for different disease states |
| Ligand | Receptor | LRpair | Pathway | Tissue | Disease Stage |
| Page: 1 |
Top |
Single-cell gene regulatory network inference analysis |
| Find out the significant the regulons (TFs) and the target genes of each regulon across cell types for different disease states |
| TF | Cell Type | Tissue | Disease Stage | Target Gene | RSS | Regulon Activity |
| ∗The dot plots of a searched regulon are shown for all cell subpopulations in each disease state of each tissue based on the regulon specific score inferred using pySCENIC and by calculating the average expression. |
| Page: 1 |
Top |
Somatic mutation of malignant transformation related genes |
| Annotation of somatic variants for genes involved in malignant transformation |
| Hugo Symbol | Variant Class | Variant Classification | dbSNP RS | HGVSc | HGVSp | HGVSp Short | SWISSPROT | BIOTYPE | SIFT | PolyPhen | Tumor Sample Barcode | Tissue | Histology | Sex | Age | Stage | Therapy Types | Drugs | Outcome |
| SLC39A8 | SNV | Missense_Mutation | c.589G>C | p.Glu197Gln | p.E197Q | Q9C0K1 | protein_coding | tolerated(0.22) | possibly_damaging(0.53) | TCGA-Q1-A73O-01 | Cervix | cervical & endocervical cancer | Female | <65 | I/II | Chemotherapy | cisplatin | CR | |
| SLC39A8 | SNV | Missense_Mutation | novel | c.560N>T | p.Gly187Val | p.G187V | Q9C0K1 | protein_coding | deleterious(0) | probably_damaging(0.999) | TCGA-AZ-4315-01 | Colorectum | colon adenocarcinoma | Male | <65 | I/II | Unknown | Unknown | SD |
| SLC39A8 | SNV | Missense_Mutation | c.389N>A | p.Gly130Glu | p.G130E | Q9C0K1 | protein_coding | deleterious(0.03) | probably_damaging(0.998) | TCGA-D5-6535-01 | Colorectum | colon adenocarcinoma | Female | >=65 | III/IV | Unknown | Unknown | SD | |
| SLC39A8 | deletion | Frame_Shift_Del | c.852delN | p.Glu285SerfsTer8 | p.E285Sfs*8 | Q9C0K1 | protein_coding | TCGA-CM-4743-01 | Colorectum | colon adenocarcinoma | Male | >=65 | I/II | Chemotherapy | capecitabine | SD | |||
| SLC39A8 | deletion | Frame_Shift_Del | c.852delN | p.Glu285SerfsTer8 | p.E285Sfs*8 | Q9C0K1 | protein_coding | TCGA-G4-6309-01 | Colorectum | colon adenocarcinoma | Female | <65 | III/IV | Chemotherapy | xeloda | PD | |||
| SLC39A8 | deletion | Frame_Shift_Del | c.852delA | p.Glu285SerfsTer8 | p.E285Sfs*8 | Q9C0K1 | protein_coding | TCGA-G4-6628-01 | Colorectum | colon adenocarcinoma | Male | >=65 | I/II | Unknown | Unknown | SD | |||
| SLC39A8 | SNV | Missense_Mutation | novel | c.743N>C | p.Leu248Ser | p.L248S | Q9C0K1 | protein_coding | tolerated(0.58) | benign(0.021) | TCGA-A5-A1OF-01 | Endometrium | uterine corpus endometrioid carcinoma | Female | <65 | I/II | Unknown | Unknown | SD |
| SLC39A8 | SNV | Missense_Mutation | rs772759492 | c.962N>T | p.Ala321Val | p.A321V | Q9C0K1 | protein_coding | deleterious(0.01) | probably_damaging(0.997) | TCGA-A5-A2K5-01 | Endometrium | uterine corpus endometrioid carcinoma | Female | >=65 | I/II | Unknown | Unknown | SD |
| SLC39A8 | SNV | Missense_Mutation | novel | c.1336G>A | p.Ala446Thr | p.A446T | Q9C0K1 | protein_coding | deleterious(0.05) | benign(0.243) | TCGA-A5-A7WJ-01 | Endometrium | uterine corpus endometrioid carcinoma | Female | <65 | I/II | Unknown | Unknown | SD |
| SLC39A8 | SNV | Missense_Mutation | novel | c.859N>G | p.Ser287Gly | p.S287G | Q9C0K1 | protein_coding | tolerated(0.39) | benign(0.02) | TCGA-AJ-A5DW-01 | Endometrium | uterine corpus endometrioid carcinoma | Female | <65 | I/II | Unknown | Unknown | SD |
| Page: 1 2 3 4 5 |
Top |
Related drugs of malignant transformation related genes |
| Identification of chemicals and drugs interact with genes involved in malignant transfromation |
| (DGIdb 4.0) |
| Entrez ID | Symbol | Category | Interaction Types | Drug Claim Name | Drug Name | PMIDs |
| 64116 | SLC39A8 | TRANSPORTER | ethanol | ALCOHOL | 32451486 |
| Page: 1 |

Copyright 2023-Present -The University of Texas Health Science Center at Houston |