
|
|||||
|
 | |
| |
| |
| |
| |
| |
|
Gene: SLC39A7 |
Gene summary for SLC39A7 |
| Gene information | Species | Human | Gene symbol | SLC39A7 | Gene ID | 7922 |
| Gene name | solute carrier family 39 member 7 | |
| Gene Alias | D6S115E | |
| Cytomap | 6p21.32 | |
| Gene Type | protein-coding | GO ID | GO:0000041 | UniProtAcc | A0A024RCX7 |
Top |
Malignant transformation analysis |
| Identification of the aberrant gene expression in precancerous and cancerous lesions by comparing the gene expression of stem-like cells in diseased tissues with normal stem cells |
| Entrez ID | Symbol | Replicates | Species | Organ | Tissue | Adj P-value | Log2FC | Malignancy |
| 7922 | SLC39A7 | HTA11_347_2000001011 | Human | Colorectum | AD | 9.14e-12 | 2.47e-01 | -0.1954 |
| 7922 | SLC39A7 | HTA11_411_2000001011 | Human | Colorectum | SER | 1.22e-04 | 4.41e-01 | -0.2602 |
| 7922 | SLC39A7 | HTA11_2112_2000001011 | Human | Colorectum | SER | 1.67e-05 | 4.69e-01 | -0.2196 |
| 7922 | SLC39A7 | HTA11_3361_2000001011 | Human | Colorectum | AD | 1.37e-02 | 1.38e-01 | -0.1207 |
| 7922 | SLC39A7 | HTA11_83_2000001011 | Human | Colorectum | SER | 1.87e-03 | 2.06e-01 | -0.1526 |
| 7922 | SLC39A7 | HTA11_696_2000001011 | Human | Colorectum | AD | 7.93e-13 | 4.12e-01 | -0.1464 |
| 7922 | SLC39A7 | HTA11_866_2000001011 | Human | Colorectum | AD | 2.95e-03 | 1.44e-01 | -0.1001 |
| 7922 | SLC39A7 | HTA11_1391_2000001011 | Human | Colorectum | AD | 7.82e-09 | 2.96e-01 | -0.059 |
| 7922 | SLC39A7 | HTA11_2992_2000001011 | Human | Colorectum | SER | 9.09e-05 | 4.00e-01 | -0.1706 |
| 7922 | SLC39A7 | HTA11_6801_2000001011 | Human | Colorectum | SER | 2.39e-05 | 4.58e-01 | 0.0171 |
| 7922 | SLC39A7 | HTA11_7696_3000711011 | Human | Colorectum | AD | 1.56e-02 | 1.77e-01 | 0.0674 |
| 7922 | SLC39A7 | HTA11_99999965104_69814 | Human | Colorectum | MSS | 5.85e-06 | 2.75e-01 | 0.281 |
| 7922 | SLC39A7 | LZE4T | Human | Esophagus | ESCC | 3.22e-13 | 3.11e-01 | 0.0811 |
| 7922 | SLC39A7 | LZE5T | Human | Esophagus | ESCC | 8.16e-03 | 4.83e-01 | 0.0514 |
| 7922 | SLC39A7 | LZE7T | Human | Esophagus | ESCC | 8.52e-06 | 5.52e-01 | 0.0667 |
| 7922 | SLC39A7 | LZE8T | Human | Esophagus | ESCC | 3.19e-08 | 1.29e-01 | 0.067 |
| 7922 | SLC39A7 | LZE20T | Human | Esophagus | ESCC | 3.86e-06 | 3.53e-01 | 0.0662 |
| 7922 | SLC39A7 | LZE22T | Human | Esophagus | ESCC | 4.15e-05 | 8.01e-01 | 0.068 |
| 7922 | SLC39A7 | LZE24T | Human | Esophagus | ESCC | 4.02e-15 | 6.32e-01 | 0.0596 |
| 7922 | SLC39A7 | P2T-E | Human | Esophagus | ESCC | 2.76e-61 | 1.03e+00 | 0.1177 |
| Page: 1 2 3 4 5 6 7 |
| Tissue | Expression Dynamics | Abbreviation |
| Colorectum (GSE201348) |  | FAP: Familial adenomatous polyposis |
| CRC: Colorectal cancer | ||
| Colorectum (HTA11) |  | AD: Adenomas |
| SER: Sessile serrated lesions | ||
| MSI-H: Microsatellite-high colorectal cancer | ||
| MSS: Microsatellite stable colorectal cancer | ||
| Esophagus |  | ESCC: Esophageal squamous cell carcinoma |
| HGIN: High-grade intraepithelial neoplasias | ||
| LGIN: Low-grade intraepithelial neoplasias | ||
| Liver | 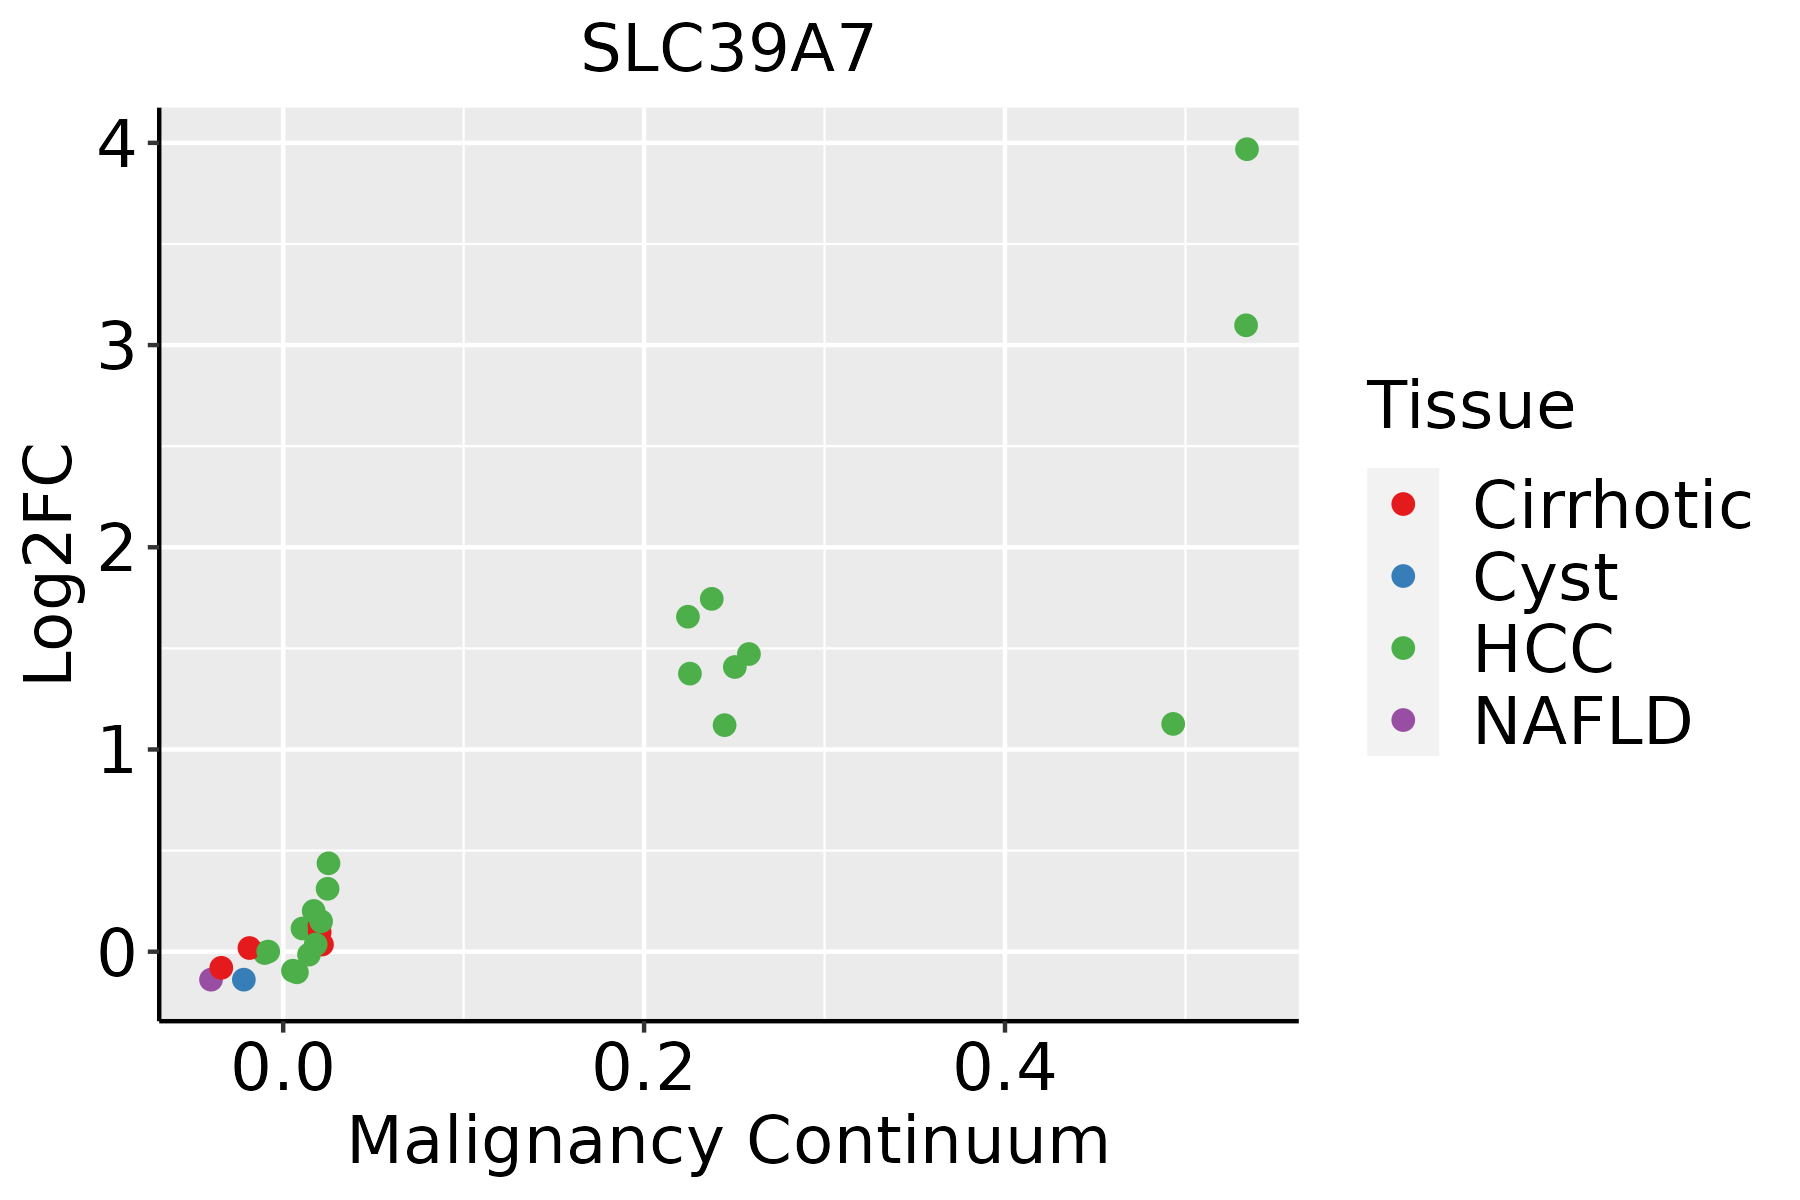 | HCC: Hepatocellular carcinoma |
| NAFLD: Non-alcoholic fatty liver disease | ||
| Oral Cavity |  | EOLP: Erosive Oral lichen planus |
| LP: leukoplakia | ||
| NEOLP: Non-erosive oral lichen planus | ||
| OSCC: Oral squamous cell carcinoma | ||
| Prostate | 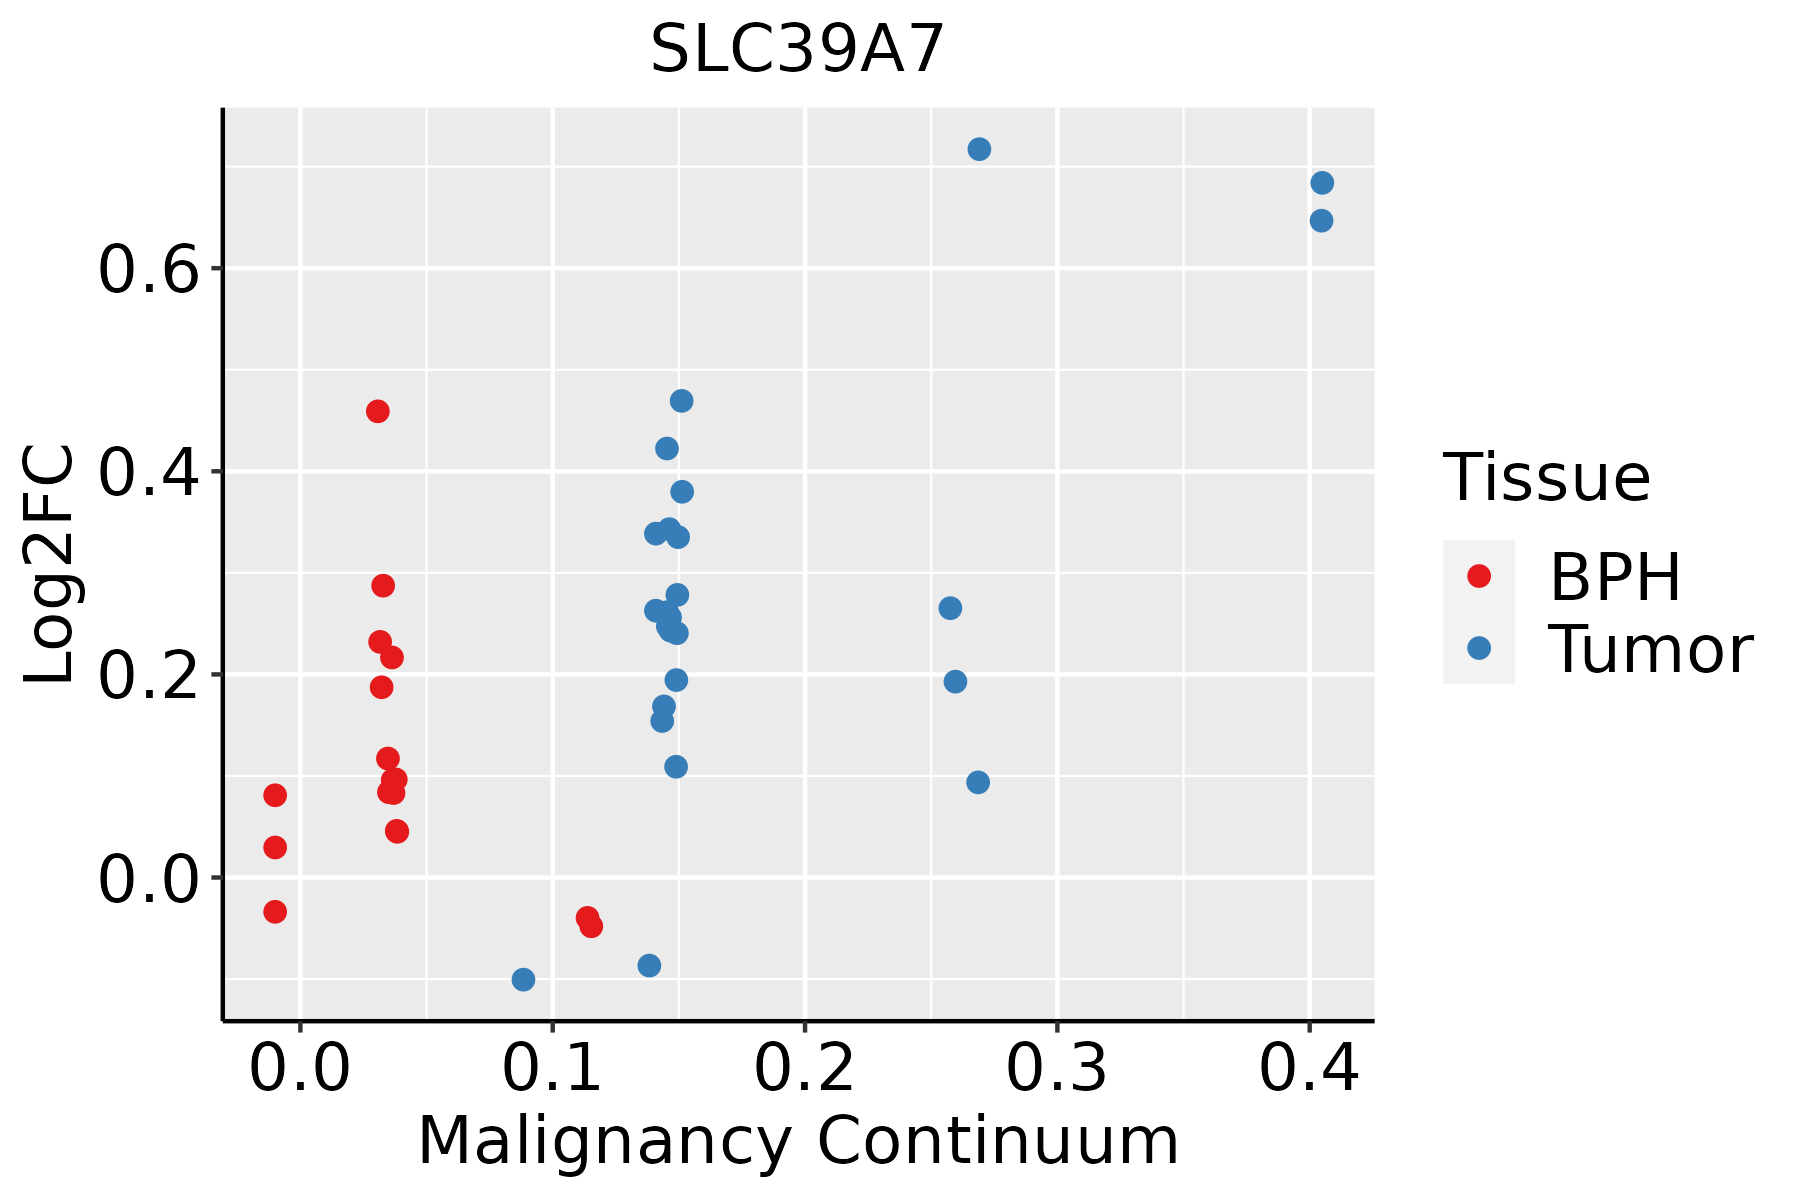 | BPH: Benign Prostatic Hyperplasia |
| Skin | 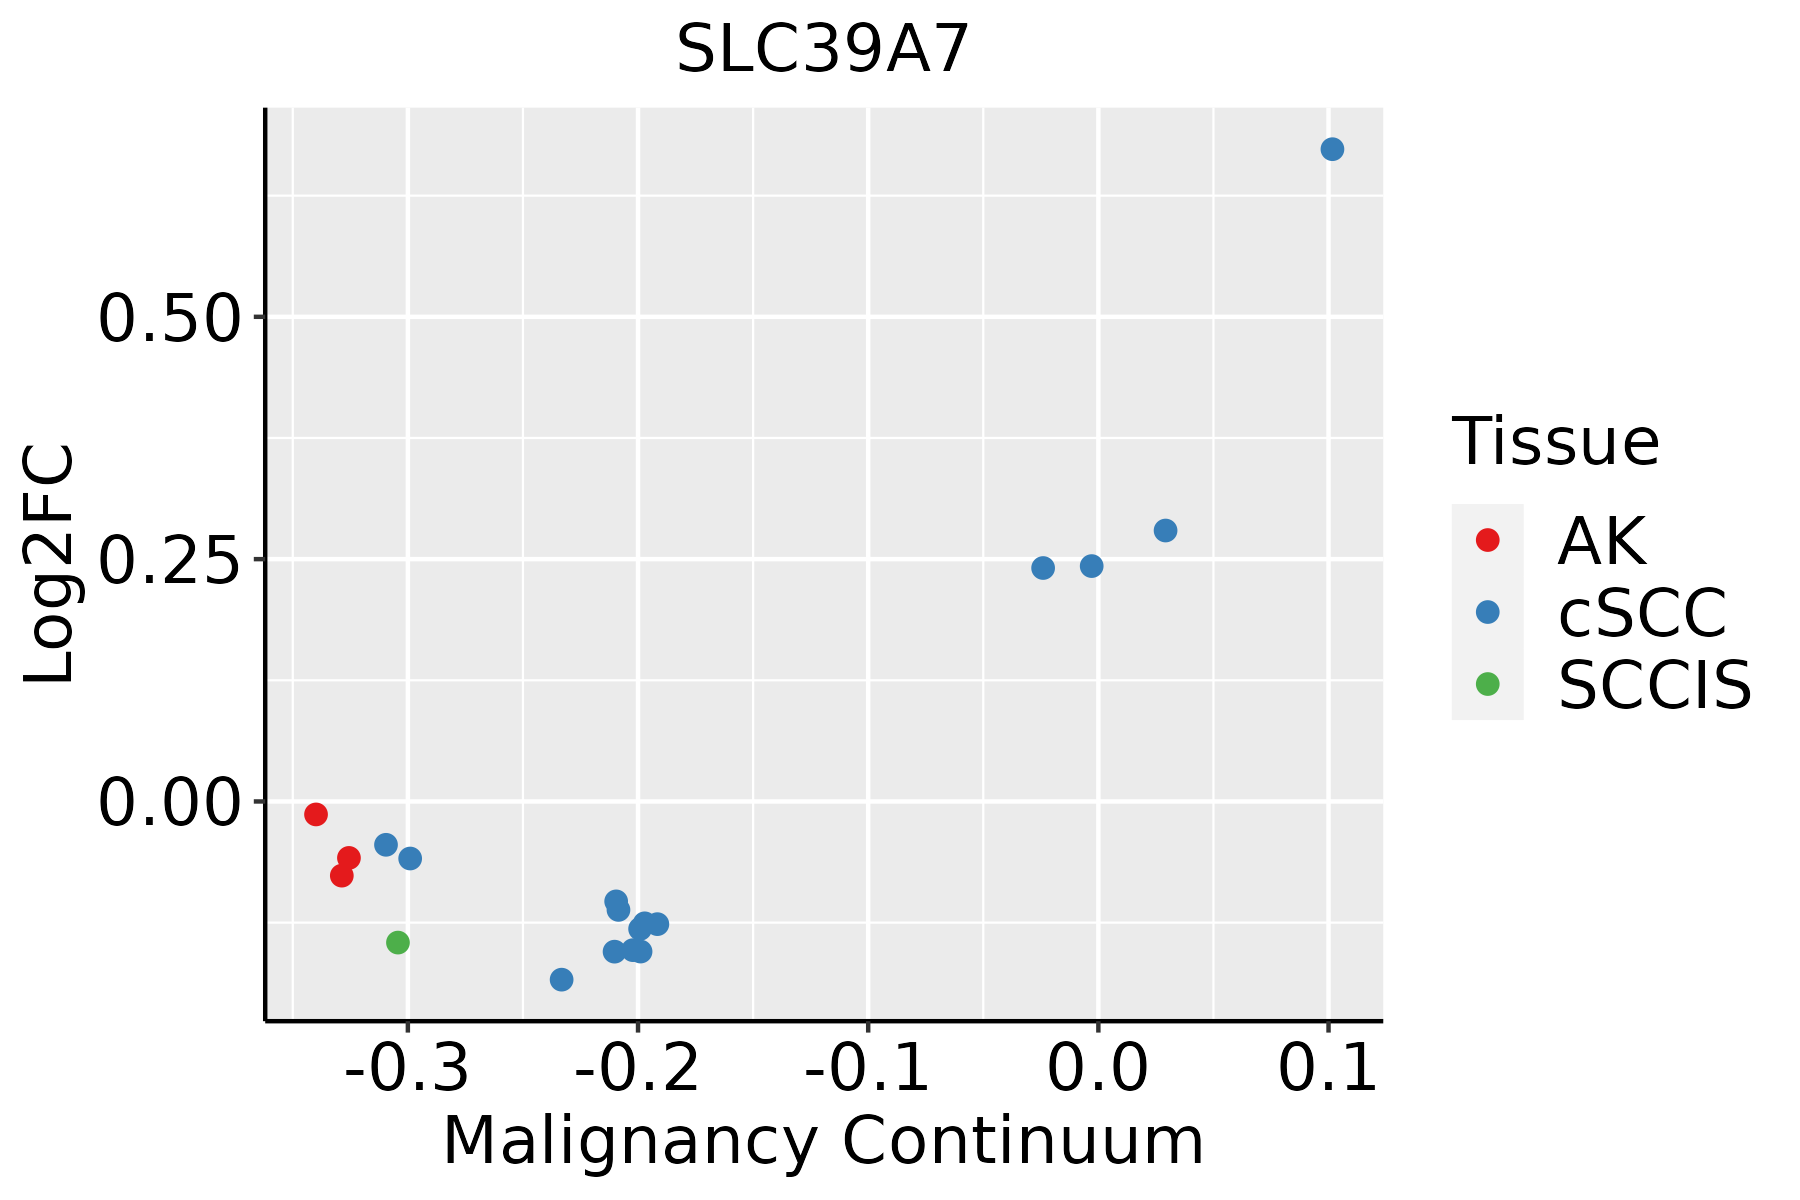 | AK: Actinic keratosis |
| cSCC: Cutaneous squamous cell carcinoma | ||
| SCCIS:squamous cell carcinoma in situ | ||
| Thyroid | 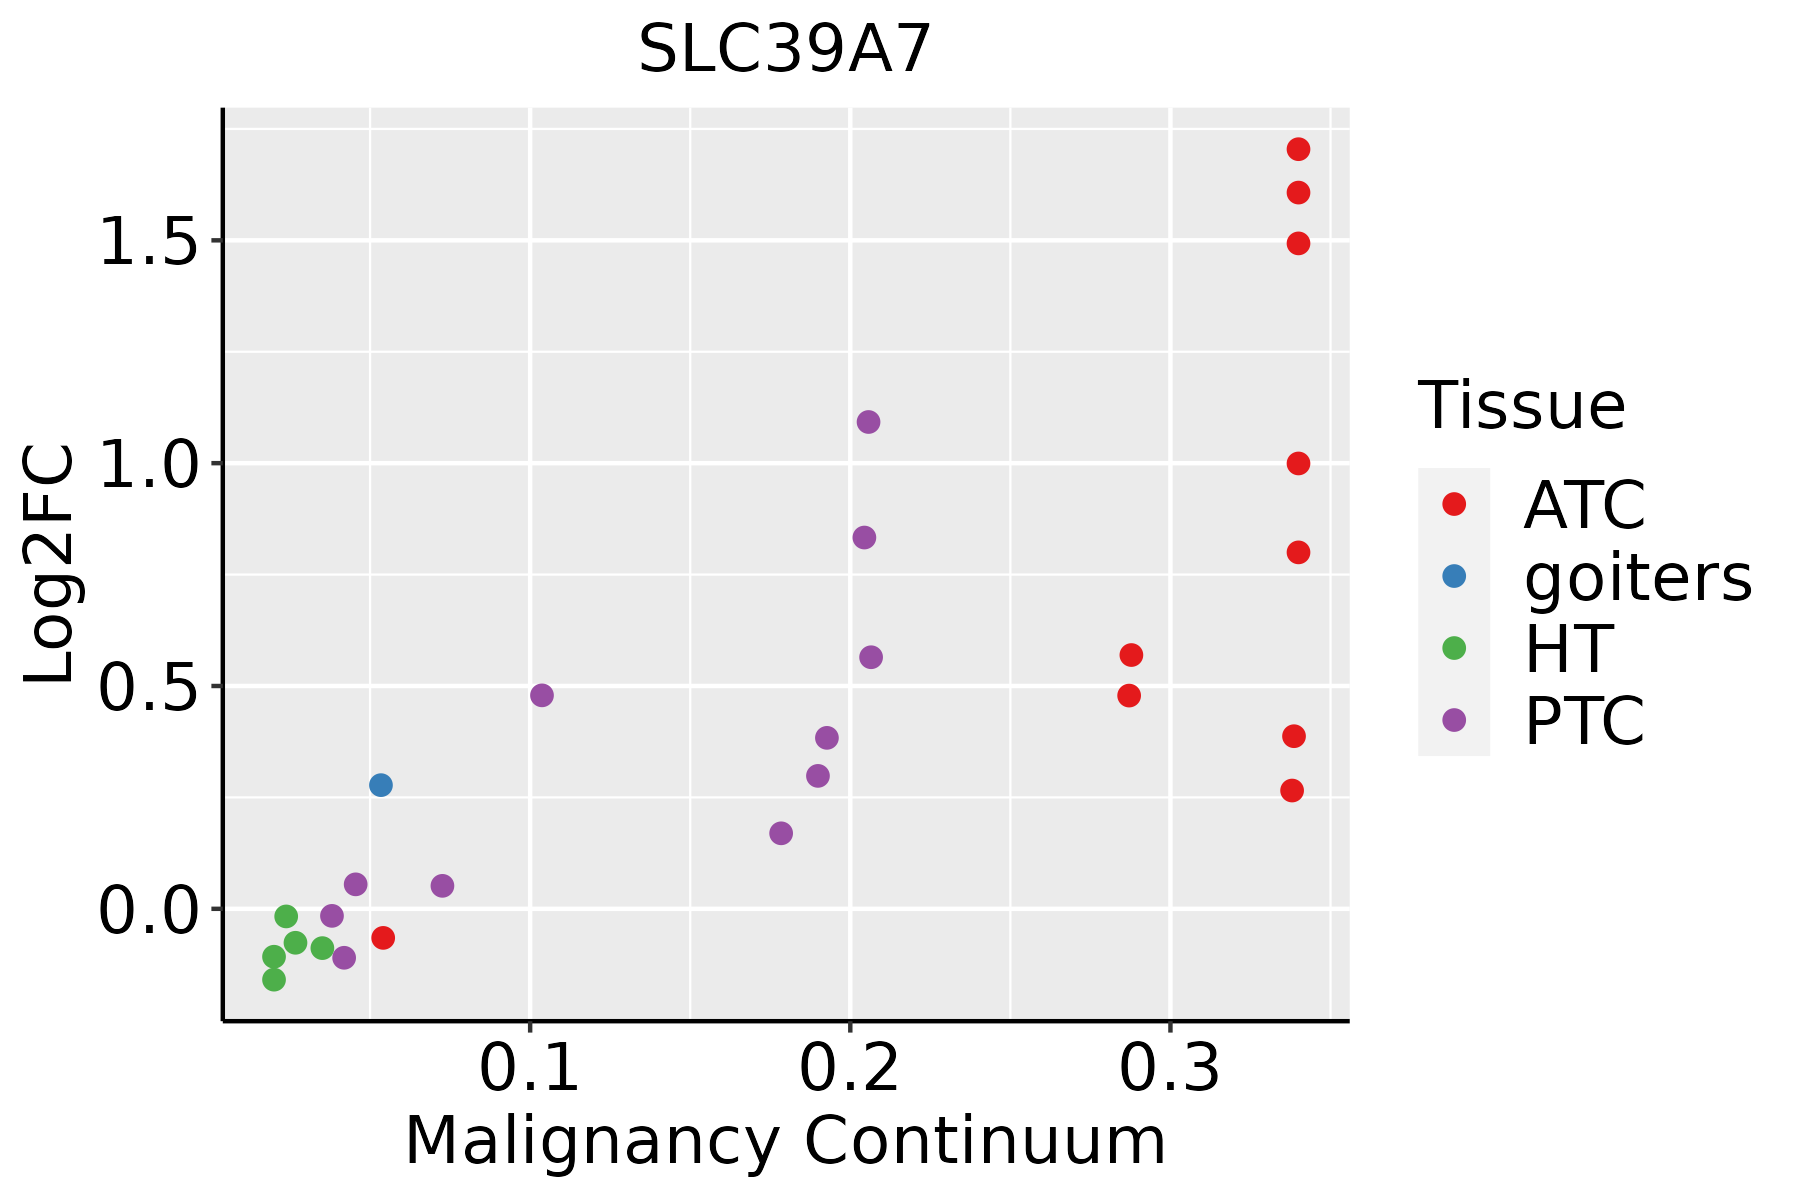 | ATC: Anaplastic thyroid cancer |
| HT: Hashimoto's thyroiditis | ||
| PTC: Papillary thyroid cancer |
| ∗log2FC in expression of this searched gene in stem-like cells from each diseased tissue sample relative to stem-like cells in normal samples in each tissue plotted against the malignancy continuum. Samples are colored based on if they are from different disease stage. |
Top |
Malignant transformation related pathway analysis |
| Find out the enriched GO biological processes and KEGG pathways involved in transition from healthy to precancer to cancer |
| Tissue | Disease Stage | Enriched GO biological Processes |
| Colorectum | AD |  |
| Colorectum | SER |  |
| Colorectum | MSS |  |
| Colorectum | MSI-H |  |
| Colorectum | FAP |  |
| ∗Top 15 enriched GO BP terms are showed in the bar plot of each disease state in each tissue. Each row represents a significant GO biological process which is colored according to the -log10(p.adjust). |
| Page: 1 2 3 4 5 6 7 8 9 |
| GO ID | Tissue | Disease Stage | Description | Gene Ratio | Bg Ratio | pvalue | p.adjust | Count |
| GO:0055076 | Colorectum | AD | transition metal ion homeostasis | 53/3918 | 138/18723 | 1.89e-06 | 5.65e-05 | 53 |
| GO:0046916 | Colorectum | AD | cellular transition metal ion homeostasis | 43/3918 | 115/18723 | 3.62e-05 | 6.56e-04 | 43 |
| GO:0055069 | Colorectum | AD | zinc ion homeostasis | 18/3918 | 40/18723 | 5.36e-04 | 5.74e-03 | 18 |
| GO:0006882 | Colorectum | AD | cellular zinc ion homeostasis | 17/3918 | 38/18723 | 8.26e-04 | 8.13e-03 | 17 |
| GO:00550761 | Colorectum | SER | transition metal ion homeostasis | 41/2897 | 138/18723 | 1.66e-05 | 5.05e-04 | 41 |
| GO:00469161 | Colorectum | SER | cellular transition metal ion homeostasis | 33/2897 | 115/18723 | 2.20e-04 | 3.89e-03 | 33 |
| GO:00550691 | Colorectum | SER | zinc ion homeostasis | 15/2897 | 40/18723 | 5.71e-04 | 7.86e-03 | 15 |
| GO:00068821 | Colorectum | SER | cellular zinc ion homeostasis | 14/2897 | 38/18723 | 1.06e-03 | 1.23e-02 | 14 |
| GO:00550762 | Colorectum | MSS | transition metal ion homeostasis | 45/3467 | 138/18723 | 4.99e-05 | 9.02e-04 | 45 |
| GO:00469162 | Colorectum | MSS | cellular transition metal ion homeostasis | 35/3467 | 115/18723 | 1.33e-03 | 1.26e-02 | 35 |
| GO:005507617 | Esophagus | ESCC | transition metal ion homeostasis | 87/8552 | 138/18723 | 2.85e-05 | 2.37e-04 | 87 |
| GO:00469169 | Esophagus | ESCC | cellular transition metal ion homeostasis | 70/8552 | 115/18723 | 7.28e-04 | 3.79e-03 | 70 |
| GO:00550766 | Liver | Cirrhotic | transition metal ion homeostasis | 59/4634 | 138/18723 | 2.59e-06 | 4.65e-05 | 59 |
| GO:00469164 | Liver | Cirrhotic | cellular transition metal ion homeostasis | 48/4634 | 115/18723 | 4.51e-05 | 5.30e-04 | 48 |
| GO:00068823 | Liver | Cirrhotic | cellular zinc ion homeostasis | 17/4634 | 38/18723 | 5.62e-03 | 2.84e-02 | 17 |
| GO:00550693 | Liver | Cirrhotic | zinc ion homeostasis | 17/4634 | 40/18723 | 1.04e-02 | 4.61e-02 | 17 |
| GO:005507612 | Liver | HCC | transition metal ion homeostasis | 81/7958 | 138/18723 | 8.87e-05 | 7.72e-04 | 81 |
| GO:004691611 | Liver | HCC | cellular transition metal ion homeostasis | 67/7958 | 115/18723 | 4.64e-04 | 3.08e-03 | 67 |
| GO:00000411 | Liver | HCC | transition metal ion transport | 59/7958 | 105/18723 | 3.18e-03 | 1.47e-02 | 59 |
| GO:000688212 | Liver | HCC | cellular zinc ion homeostasis | 24/7958 | 38/18723 | 8.20e-03 | 3.22e-02 | 24 |
| Page: 1 2 |
| Pathway ID | Tissue | Disease Stage | Description | Gene Ratio | Bg Ratio | pvalue | p.adjust | qvalue | Count |
| hsa05012 | Colorectum | AD | Parkinson disease | 147/2092 | 266/8465 | 2.53e-27 | 8.48e-25 | 5.41e-25 | 147 |
| hsa05010 | Colorectum | AD | Alzheimer disease | 174/2092 | 384/8465 | 1.82e-19 | 9.26e-18 | 5.91e-18 | 174 |
| hsa050121 | Colorectum | AD | Parkinson disease | 147/2092 | 266/8465 | 2.53e-27 | 8.48e-25 | 5.41e-25 | 147 |
| hsa050101 | Colorectum | AD | Alzheimer disease | 174/2092 | 384/8465 | 1.82e-19 | 9.26e-18 | 5.91e-18 | 174 |
| hsa050122 | Colorectum | SER | Parkinson disease | 132/1580 | 266/8465 | 2.72e-31 | 9.03e-29 | 6.55e-29 | 132 |
| hsa050102 | Colorectum | SER | Alzheimer disease | 146/1580 | 384/8465 | 6.52e-20 | 2.40e-18 | 1.75e-18 | 146 |
| hsa050123 | Colorectum | SER | Parkinson disease | 132/1580 | 266/8465 | 2.72e-31 | 9.03e-29 | 6.55e-29 | 132 |
| hsa050103 | Colorectum | SER | Alzheimer disease | 146/1580 | 384/8465 | 6.52e-20 | 2.40e-18 | 1.75e-18 | 146 |
| hsa050124 | Colorectum | MSS | Parkinson disease | 140/1875 | 266/8465 | 2.32e-28 | 7.79e-26 | 4.77e-26 | 140 |
| hsa050104 | Colorectum | MSS | Alzheimer disease | 169/1875 | 384/8465 | 1.21e-22 | 1.01e-20 | 6.21e-21 | 169 |
| hsa050125 | Colorectum | MSS | Parkinson disease | 140/1875 | 266/8465 | 2.32e-28 | 7.79e-26 | 4.77e-26 | 140 |
| hsa050105 | Colorectum | MSS | Alzheimer disease | 169/1875 | 384/8465 | 1.21e-22 | 1.01e-20 | 6.21e-21 | 169 |
| hsa05012211 | Esophagus | ESCC | Parkinson disease | 201/4205 | 266/8465 | 1.56e-18 | 8.72e-17 | 4.46e-17 | 201 |
| hsa05010210 | Esophagus | ESCC | Alzheimer disease | 263/4205 | 384/8465 | 1.80e-14 | 5.47e-13 | 2.80e-13 | 263 |
| hsa05012310 | Esophagus | ESCC | Parkinson disease | 201/4205 | 266/8465 | 1.56e-18 | 8.72e-17 | 4.46e-17 | 201 |
| hsa0501038 | Esophagus | ESCC | Alzheimer disease | 263/4205 | 384/8465 | 1.80e-14 | 5.47e-13 | 2.80e-13 | 263 |
| hsa0501214 | Liver | Cirrhotic | Parkinson disease | 158/2530 | 266/8465 | 3.62e-24 | 6.02e-22 | 3.71e-22 | 158 |
| hsa0501014 | Liver | Cirrhotic | Alzheimer disease | 180/2530 | 384/8465 | 5.52e-13 | 1.36e-11 | 8.36e-12 | 180 |
| hsa0501215 | Liver | Cirrhotic | Parkinson disease | 158/2530 | 266/8465 | 3.62e-24 | 6.02e-22 | 3.71e-22 | 158 |
| hsa0501015 | Liver | Cirrhotic | Alzheimer disease | 180/2530 | 384/8465 | 5.52e-13 | 1.36e-11 | 8.36e-12 | 180 |
| Page: 1 2 |
Top |
Cell-cell communication analysis |
| Identification of potential cell-cell interactions between two cell types and their ligand-receptor pairs for different disease states |
| Ligand | Receptor | LRpair | Pathway | Tissue | Disease Stage |
| Page: 1 |
Top |
Single-cell gene regulatory network inference analysis |
| Find out the significant the regulons (TFs) and the target genes of each regulon across cell types for different disease states |
| TF | Cell Type | Tissue | Disease Stage | Target Gene | RSS | Regulon Activity |
| ∗The dot plots of a searched regulon are shown for all cell subpopulations in each disease state of each tissue based on the regulon specific score inferred using pySCENIC and by calculating the average expression. |
| Page: 1 |
Top |
Somatic mutation of malignant transformation related genes |
| Annotation of somatic variants for genes involved in malignant transformation |
| Hugo Symbol | Variant Class | Variant Classification | dbSNP RS | HGVSc | HGVSp | HGVSp Short | SWISSPROT | BIOTYPE | SIFT | PolyPhen | Tumor Sample Barcode | Tissue | Histology | Sex | Age | Stage | Therapy Types | Drugs | Outcome |
| SLC39A7 | SNV | Missense_Mutation | c.154N>A | p.Glu52Lys | p.E52K | Q92504 | protein_coding | tolerated_low_confidence(0.19) | benign(0.003) | TCGA-A1-A0SI-01 | Breast | breast invasive carcinoma | Female | <65 | I/II | Unknown | Unknown | SD | |
| SLC39A7 | SNV | Missense_Mutation | novel | c.338N>C | p.Ser113Thr | p.S113T | Q92504 | protein_coding | tolerated(0.21) | benign(0.079) | TCGA-A2-A3Y0-01 | Breast | breast invasive carcinoma | Female | <65 | I/II | Chemotherapy | adriamycin | CR |
| SLC39A7 | SNV | Missense_Mutation | novel | c.97N>A | p.Asp33Asn | p.D33N | Q92504 | protein_coding | deleterious_low_confidence(0.01) | benign(0.422) | TCGA-AC-A5XS-01 | Breast | breast invasive carcinoma | Female | >=65 | I/II | Hormone Therapy | femara | SD |
| SLC39A7 | SNV | Missense_Mutation | novel | c.175N>G | p.Ser59Gly | p.S59G | Q92504 | protein_coding | tolerated(0.13) | possibly_damaging(0.899) | TCGA-AC-A6IW-01 | Breast | breast invasive carcinoma | Female | >=65 | I/II | Unknown | Unknown | SD |
| SLC39A7 | SNV | Missense_Mutation | c.390N>A | p.Asp130Glu | p.D130E | Q92504 | protein_coding | tolerated(0.12) | possibly_damaging(0.675) | TCGA-E9-A1NC-01 | Breast | breast invasive carcinoma | Female | <65 | I/II | Chemotherapy | doxorubicin | CR | |
| SLC39A7 | insertion | Frame_Shift_Ins | novel | c.1367_1368insG | p.Val459SerfsTer11 | p.V459Sfs*11 | Q92504 | protein_coding | TCGA-A8-A09Z-01 | Breast | breast invasive carcinoma | Female | >=65 | I/II | Unknown | Unknown | SD | ||
| SLC39A7 | SNV | Missense_Mutation | novel | c.533N>A | p.Gly178Asp | p.G178D | Q92504 | protein_coding | deleterious(0) | probably_damaging(0.998) | TCGA-C5-A8XJ-01 | Cervix | cervical & endocervical cancer | Female | >=65 | I/II | Chemotherapy | cisplatin | SD |
| SLC39A7 | SNV | Missense_Mutation | c.1405N>C | p.Glu469Gln | p.E469Q | Q92504 | protein_coding | deleterious(0) | probably_damaging(0.991) | TCGA-EK-A3GK-01 | Cervix | cervical & endocervical cancer | Female | <65 | I/II | Unknown | Unknown | SD | |
| SLC39A7 | SNV | Missense_Mutation | c.575N>T | p.Ala192Val | p.A192V | Q92504 | protein_coding | deleterious(0) | possibly_damaging(0.864) | TCGA-FU-A3HZ-01 | Cervix | cervical & endocervical cancer | Female | <65 | I/II | Chemotherapy | cisplatin | CR | |
| SLC39A7 | SNV | Missense_Mutation | novel | c.256N>C | p.Glu86Gln | p.E86Q | Q92504 | protein_coding | deleterious(0.05) | benign(0.073) | TCGA-MY-A913-01 | Cervix | cervical & endocervical cancer | Female | <65 | I/II | Chemotherapy | cisplatin | CR |
| Page: 1 2 3 4 5 |
Top |
Related drugs of malignant transformation related genes |
| Identification of chemicals and drugs interact with genes involved in malignant transfromation |
| (DGIdb 4.0) |
| Entrez ID | Symbol | Category | Interaction Types | Drug Claim Name | Drug Name | PMIDs |
| Page: 1 |

Copyright 2023-Present -The University of Texas Health Science Center at Houston |