
|
|||||
|
 | |
| |
| |
| |
| |
| |
|
Gene: SLC39A6 |
Gene summary for SLC39A6 |
| Gene information | Species | Human | Gene symbol | SLC39A6 | Gene ID | 25800 |
| Gene name | solute carrier family 39 member 6 | |
| Gene Alias | LIV-1 | |
| Cytomap | 18q12.2 | |
| Gene Type | protein-coding | GO ID | GO:0000041 | UniProtAcc | Q13433 |
Top |
Malignant transformation analysis |
| Identification of the aberrant gene expression in precancerous and cancerous lesions by comparing the gene expression of stem-like cells in diseased tissues with normal stem cells |
| Entrez ID | Symbol | Replicates | Species | Organ | Tissue | Adj P-value | Log2FC | Malignancy |
| 25800 | SLC39A6 | GSM4909282 | Human | Breast | IDC | 6.66e-03 | -3.13e-01 | -0.0288 |
| 25800 | SLC39A6 | GSM4909285 | Human | Breast | IDC | 2.07e-04 | -6.95e-02 | 0.21 |
| 25800 | SLC39A6 | GSM4909286 | Human | Breast | IDC | 1.11e-06 | -9.16e-02 | 0.1081 |
| 25800 | SLC39A6 | GSM4909288 | Human | Breast | IDC | 3.85e-02 | -4.41e-01 | 0.0988 |
| 25800 | SLC39A6 | GSM4909294 | Human | Breast | IDC | 4.36e-02 | -3.15e-01 | 0.2022 |
| 25800 | SLC39A6 | GSM4909296 | Human | Breast | IDC | 3.76e-06 | -2.58e-01 | 0.1524 |
| 25800 | SLC39A6 | GSM4909297 | Human | Breast | IDC | 4.91e-10 | -2.08e-01 | 0.1517 |
| 25800 | SLC39A6 | GSM4909298 | Human | Breast | IDC | 5.20e-03 | -1.74e-01 | 0.1551 |
| 25800 | SLC39A6 | GSM4909301 | Human | Breast | IDC | 6.91e-52 | 9.36e-01 | 0.1577 |
| 25800 | SLC39A6 | GSM4909303 | Human | Breast | IDC | 1.10e-09 | 6.64e-01 | 0.0438 |
| 25800 | SLC39A6 | GSM4909307 | Human | Breast | IDC | 1.45e-42 | 9.14e-01 | 0.1569 |
| 25800 | SLC39A6 | GSM4909308 | Human | Breast | IDC | 2.77e-87 | 1.18e+00 | 0.158 |
| 25800 | SLC39A6 | GSM4909309 | Human | Breast | IDC | 3.05e-04 | 2.86e-01 | 0.0483 |
| 25800 | SLC39A6 | GSM4909311 | Human | Breast | IDC | 7.04e-22 | -3.32e-01 | 0.1534 |
| 25800 | SLC39A6 | GSM4909312 | Human | Breast | IDC | 2.02e-04 | -1.17e-01 | 0.1552 |
| 25800 | SLC39A6 | GSM4909313 | Human | Breast | IDC | 1.10e-15 | 5.94e-01 | 0.0391 |
| 25800 | SLC39A6 | GSM4909315 | Human | Breast | IDC | 1.83e-09 | -3.51e-01 | 0.21 |
| 25800 | SLC39A6 | GSM4909319 | Human | Breast | IDC | 1.49e-30 | -2.92e-01 | 0.1563 |
| 25800 | SLC39A6 | GSM4909321 | Human | Breast | IDC | 2.24e-10 | 3.00e-01 | 0.1559 |
| 25800 | SLC39A6 | brca1 | Human | Breast | Precancer | 3.24e-06 | -3.35e-01 | -0.0338 |
| Page: 1 2 3 4 5 6 7 8 9 |
| Tissue | Expression Dynamics | Abbreviation |
| Breast | 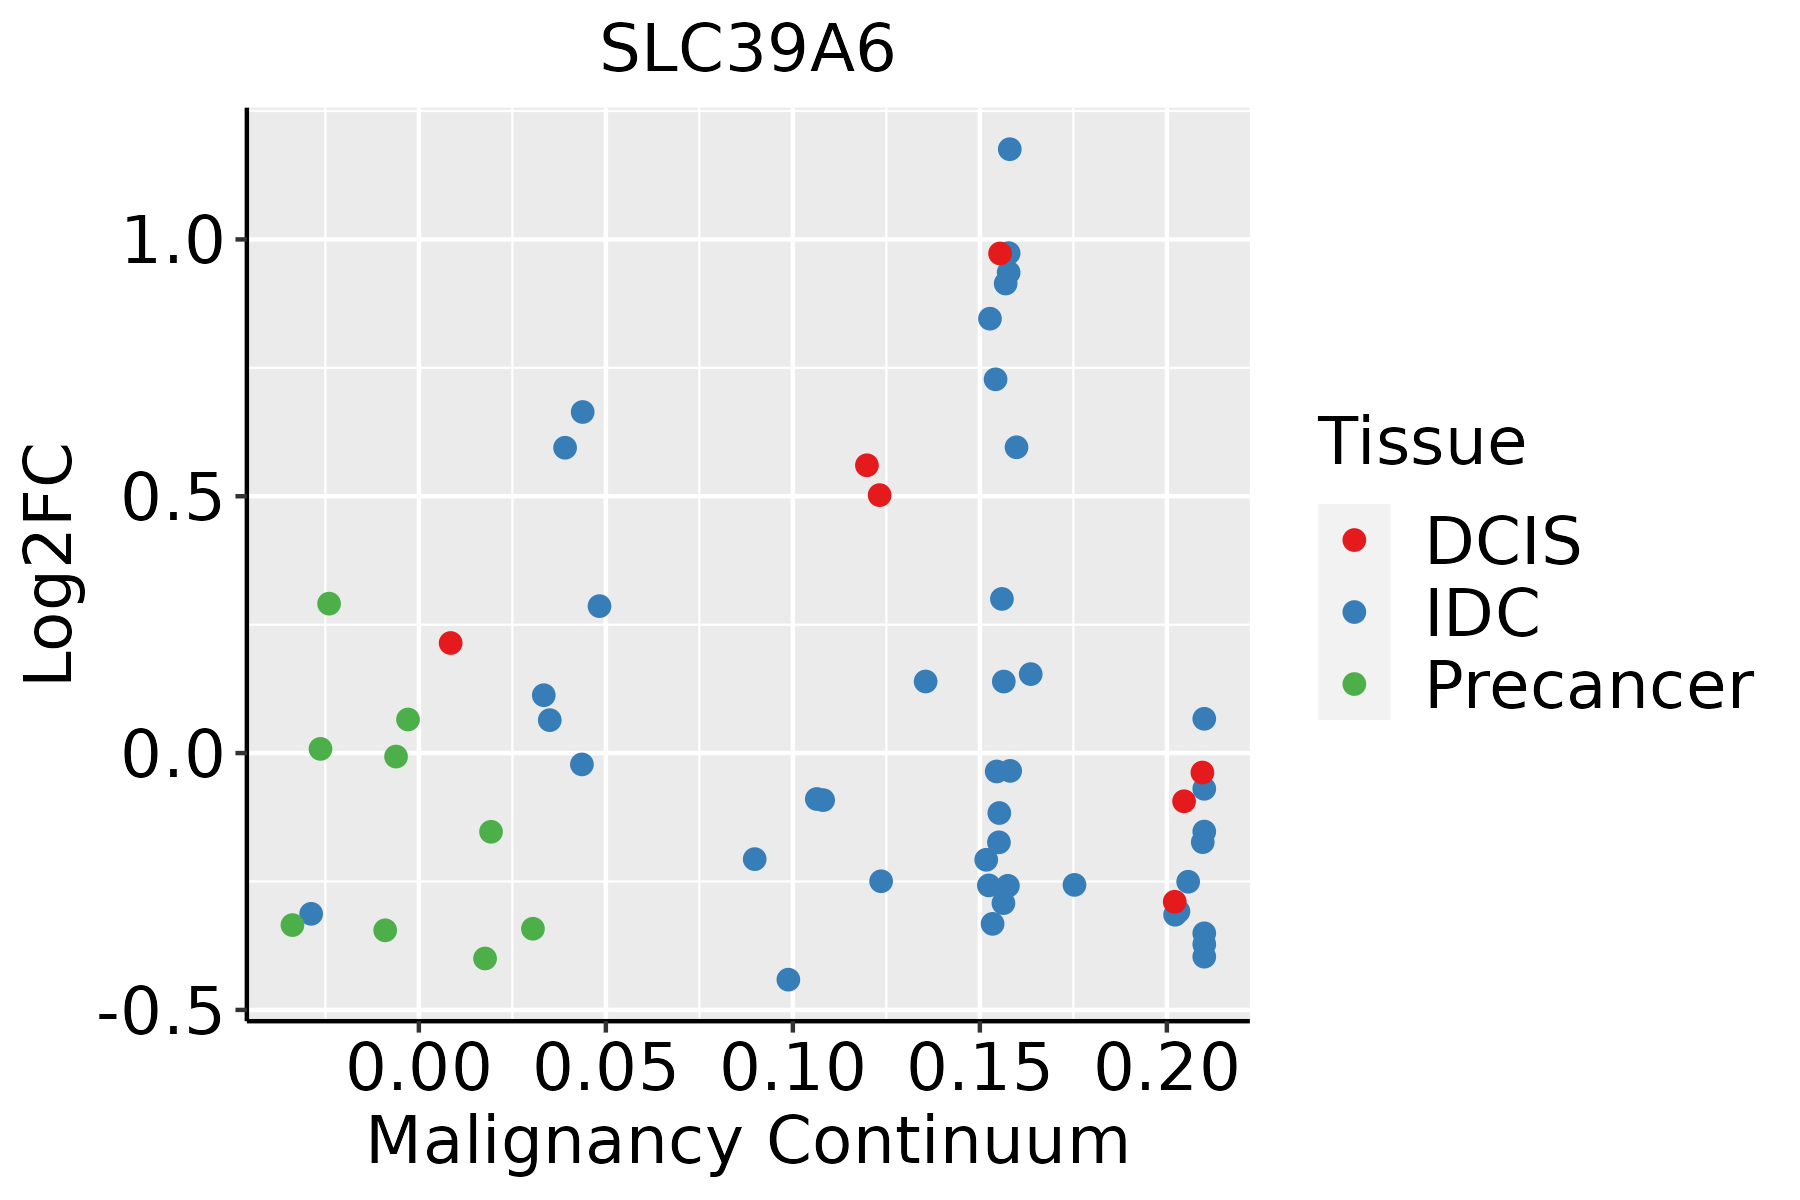 | IDC: Invasive ductal carcinoma |
| DCIS: Ductal carcinoma in situ | ||
| Precancer(BRCA1-mut): Precancerous lesion from BRCA1 mutation carriers | ||
| Endometrium | 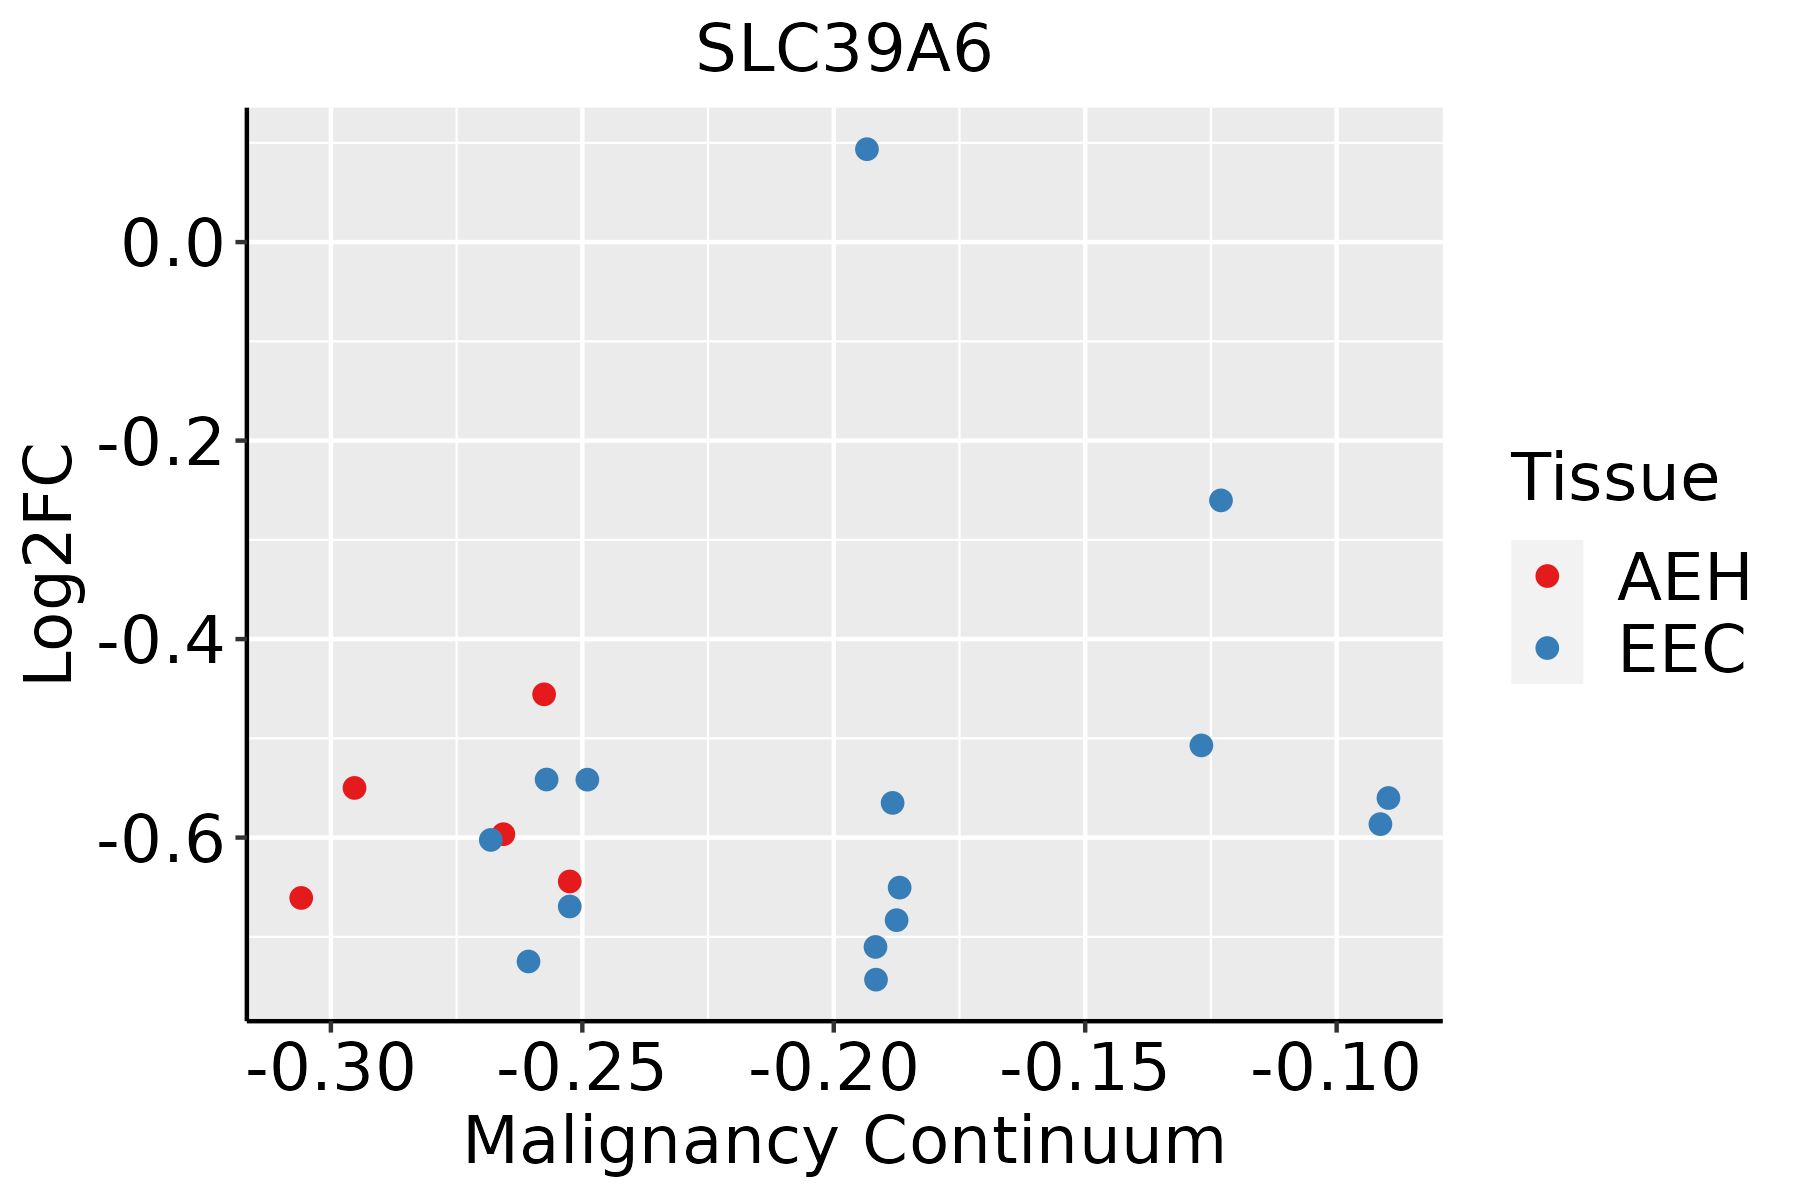 | AEH: Atypical endometrial hyperplasia |
| EEC: Endometrioid Cancer | ||
| Esophagus | 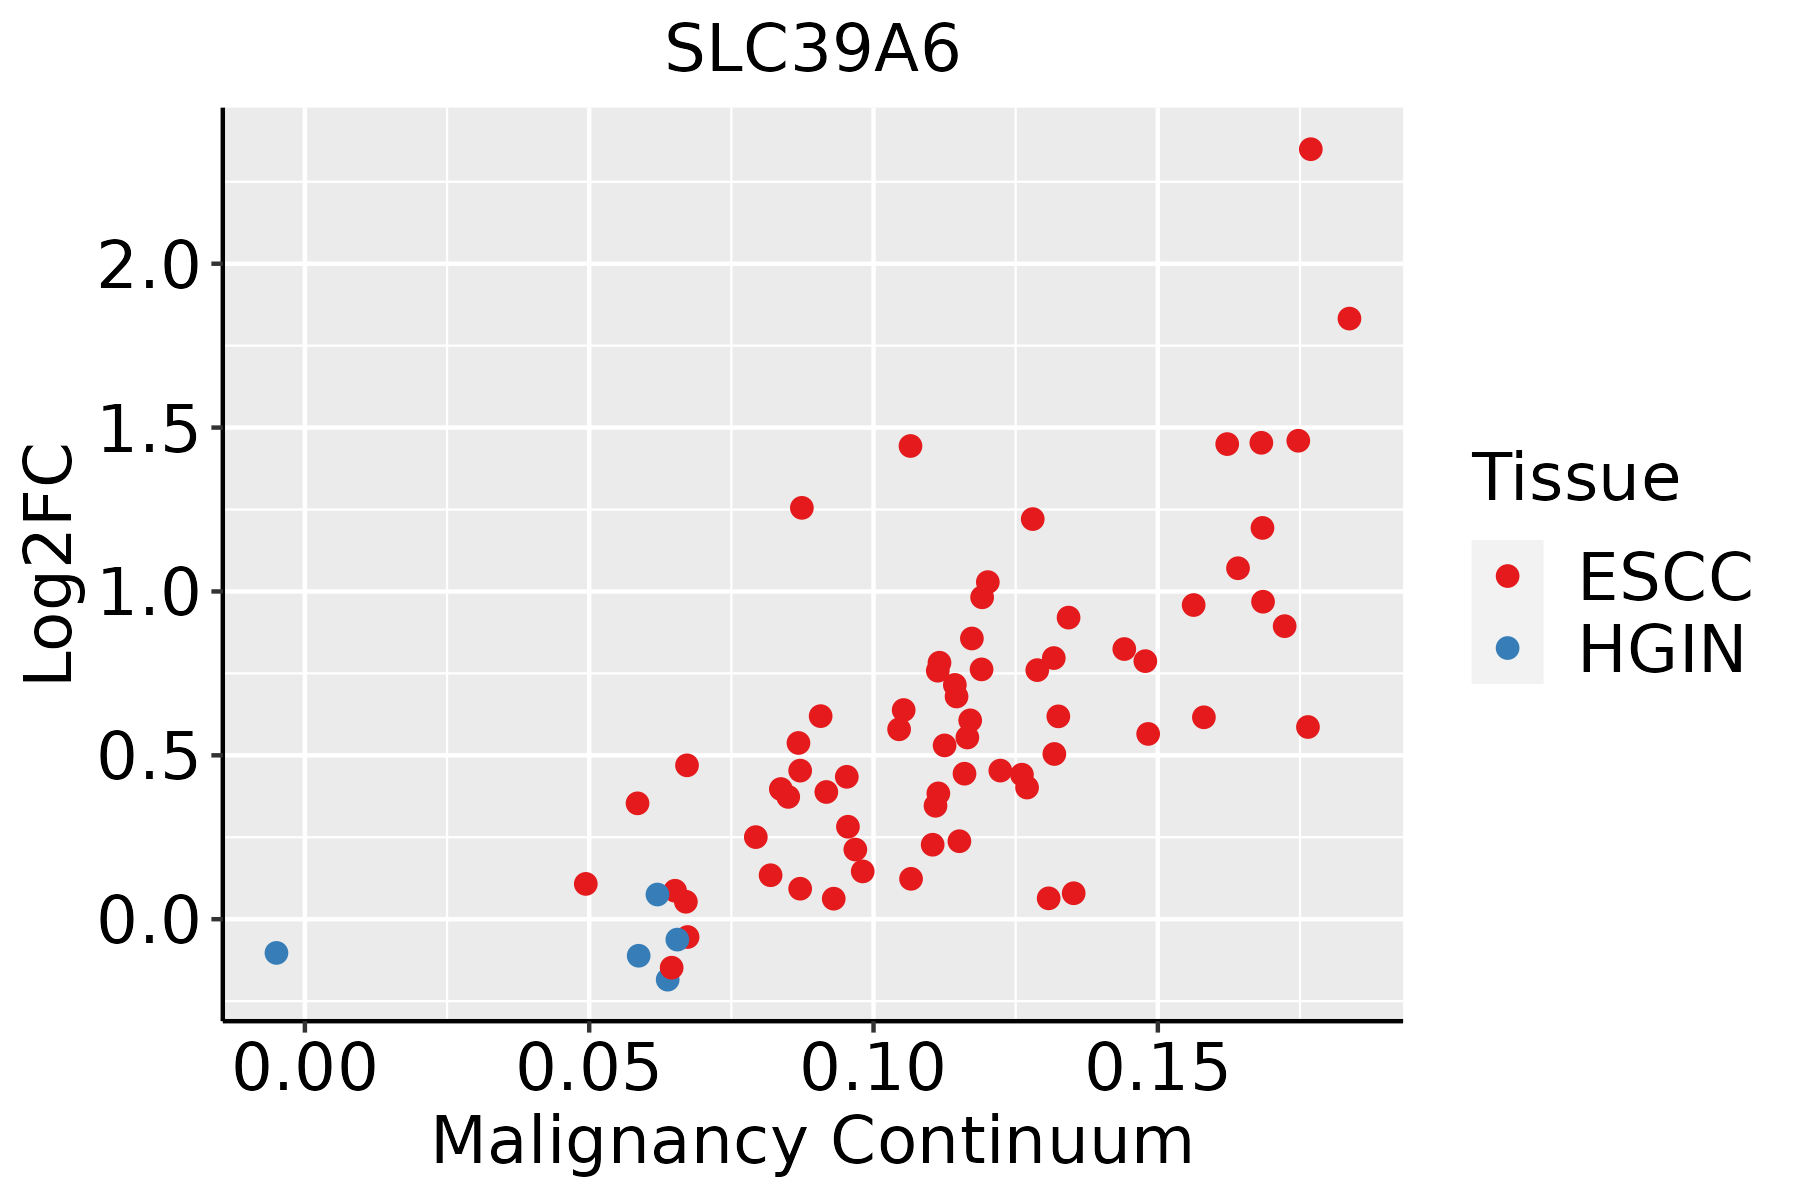 | ESCC: Esophageal squamous cell carcinoma |
| HGIN: High-grade intraepithelial neoplasias | ||
| LGIN: Low-grade intraepithelial neoplasias | ||
| Liver |  | HCC: Hepatocellular carcinoma |
| NAFLD: Non-alcoholic fatty liver disease | ||
| Oral Cavity |  | EOLP: Erosive Oral lichen planus |
| LP: leukoplakia | ||
| NEOLP: Non-erosive oral lichen planus | ||
| OSCC: Oral squamous cell carcinoma | ||
| Prostate | 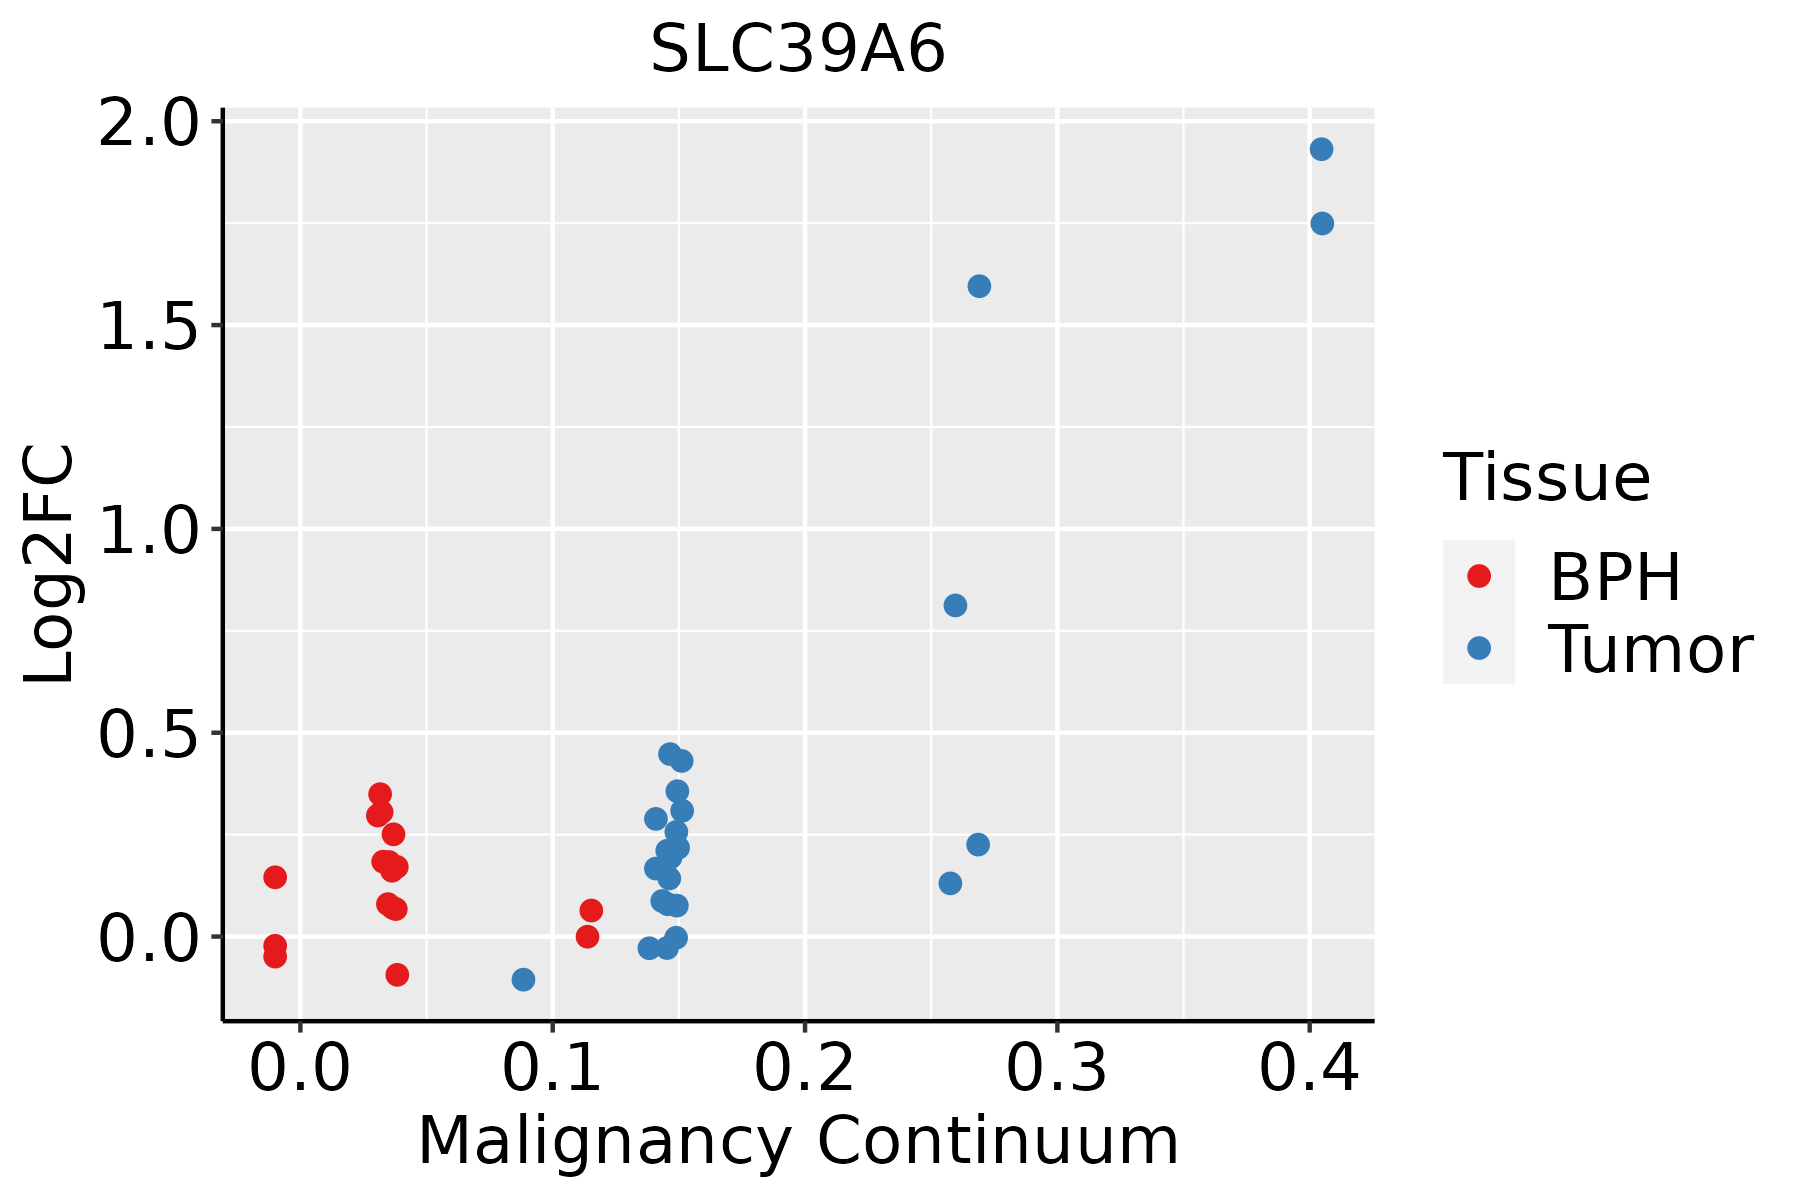 | BPH: Benign Prostatic Hyperplasia |
| Skin | 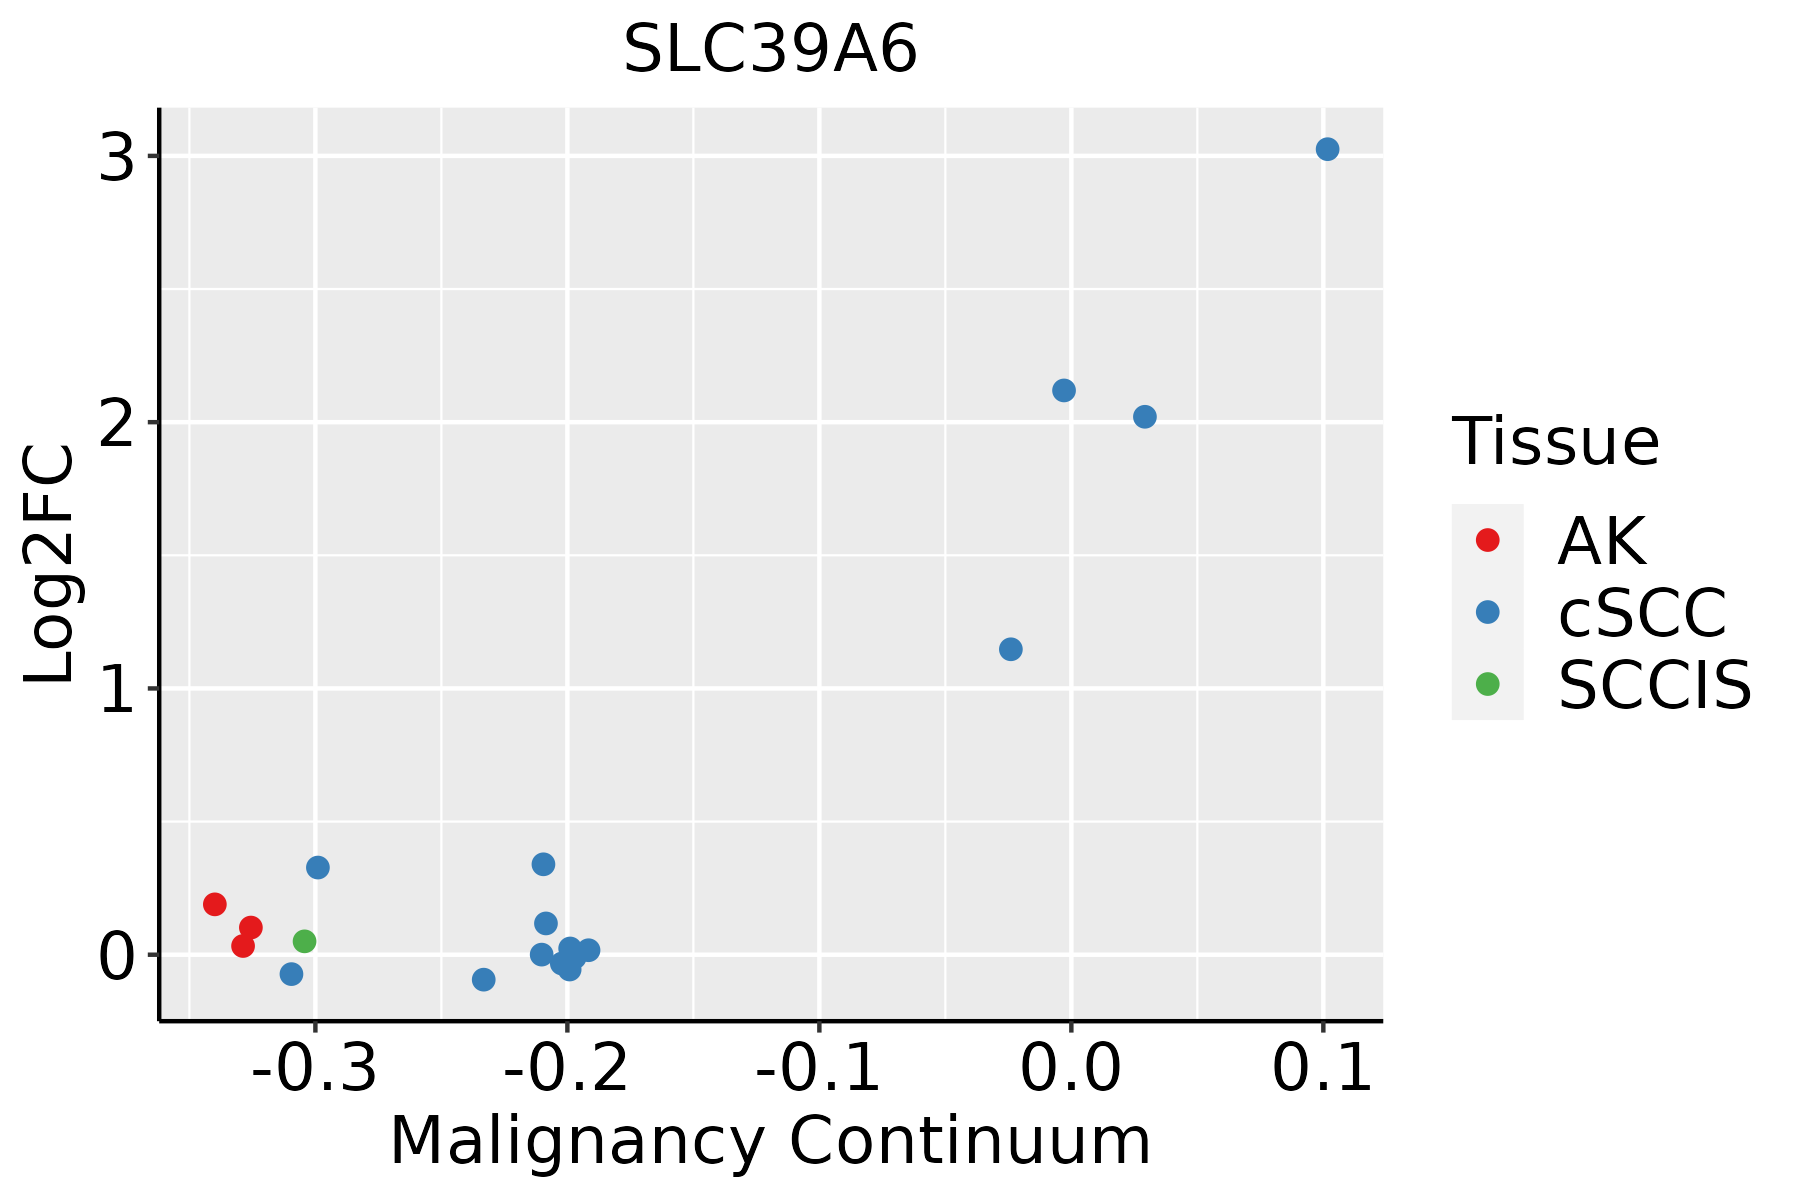 | AK: Actinic keratosis |
| cSCC: Cutaneous squamous cell carcinoma | ||
| SCCIS:squamous cell carcinoma in situ | ||
| Thyroid | 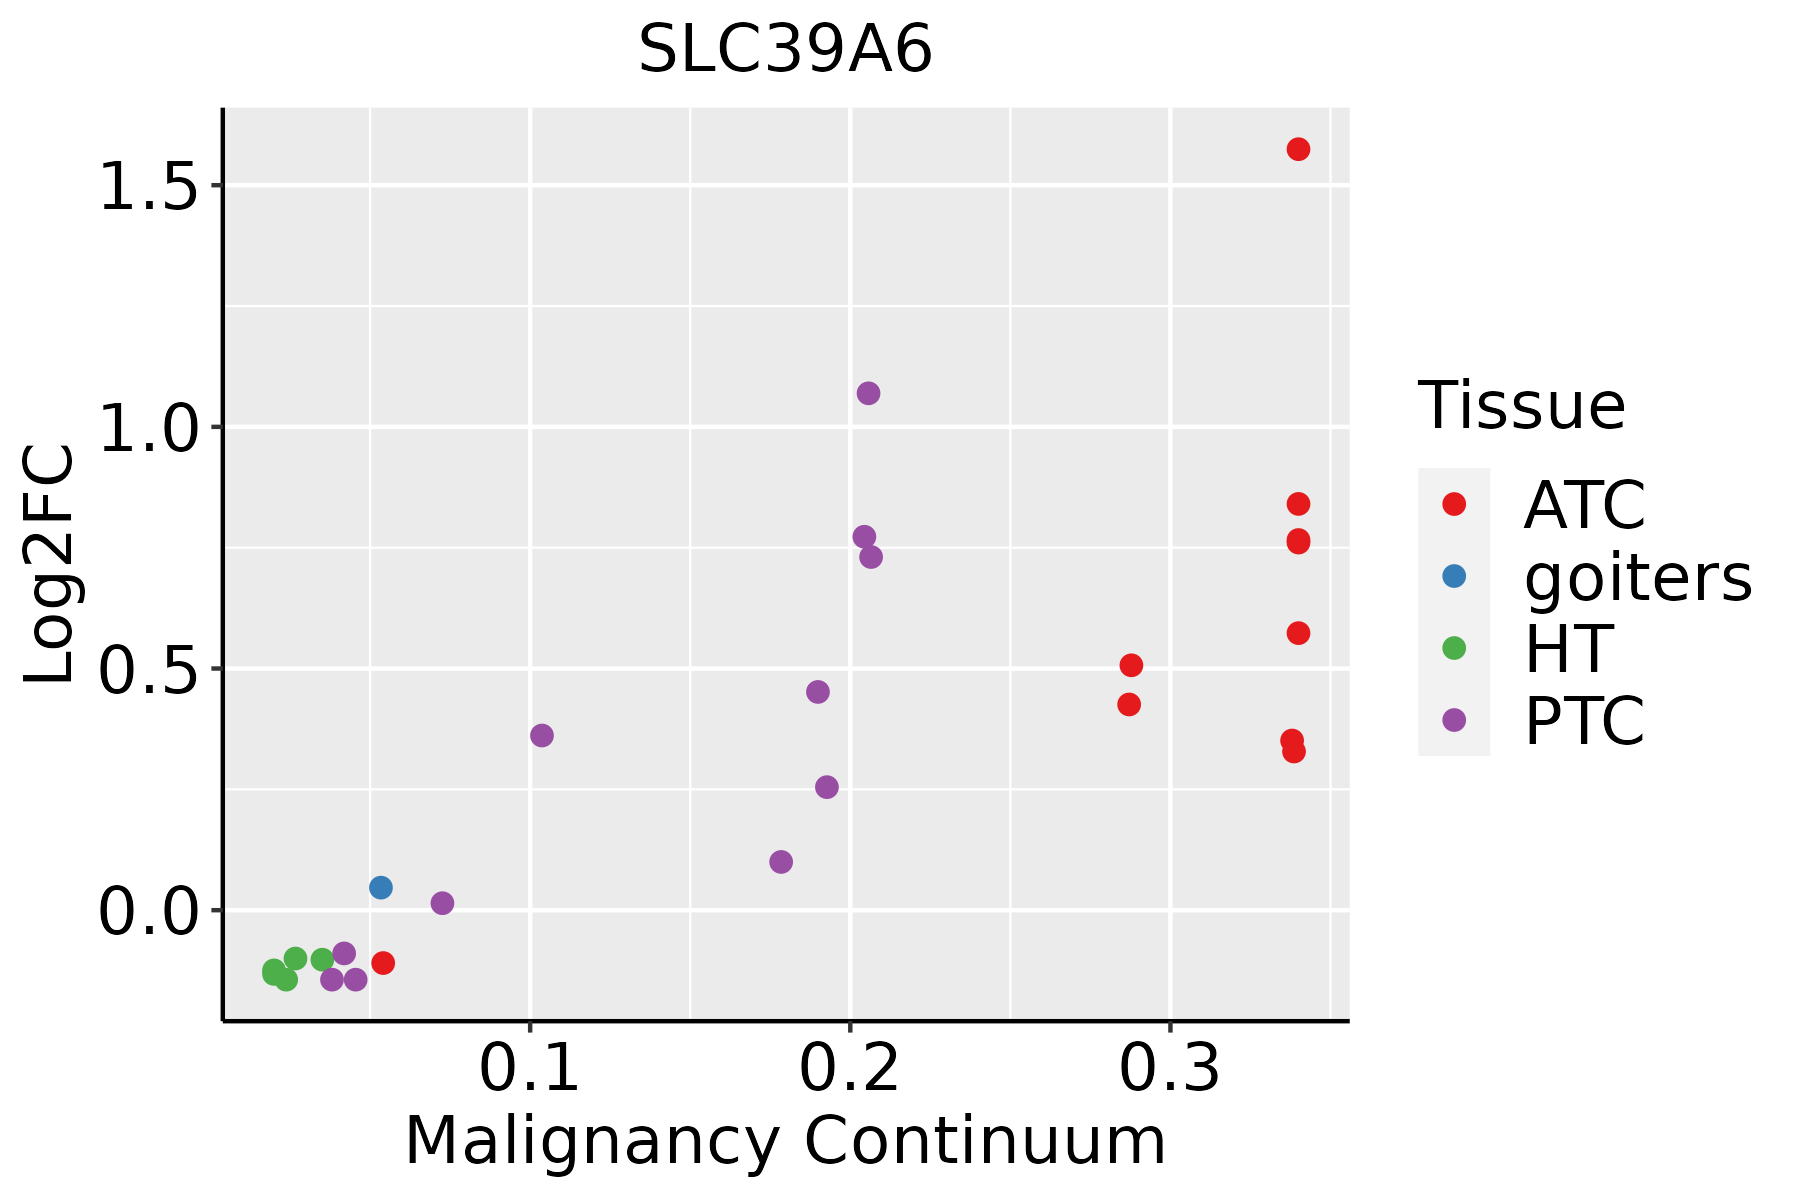 | ATC: Anaplastic thyroid cancer |
| HT: Hashimoto's thyroiditis | ||
| PTC: Papillary thyroid cancer |
| ∗log2FC in expression of this searched gene in stem-like cells from each diseased tissue sample relative to stem-like cells in normal samples in each tissue plotted against the malignancy continuum. Samples are colored based on if they are from different disease stage. |
Top |
Malignant transformation related pathway analysis |
| Find out the enriched GO biological processes and KEGG pathways involved in transition from healthy to precancer to cancer |
| Tissue | Disease Stage | Enriched GO biological Processes |
| Colorectum | AD |  |
| Colorectum | SER |  |
| Colorectum | MSS |  |
| Colorectum | MSI-H |  |
| Colorectum | FAP |  |
| ∗Top 15 enriched GO BP terms are showed in the bar plot of each disease state in each tissue. Each row represents a significant GO biological process which is colored according to the -log10(p.adjust). |
| Page: 1 2 3 4 5 6 7 8 9 |
| GO ID | Tissue | Disease Stage | Description | Gene Ratio | Bg Ratio | pvalue | p.adjust | Count |
| GO:00550767 | Breast | Precancer | transition metal ion homeostasis | 20/1080 | 138/18723 | 1.28e-04 | 2.24e-03 | 20 |
| GO:00469165 | Breast | Precancer | cellular transition metal ion homeostasis | 17/1080 | 115/18723 | 3.15e-04 | 4.49e-03 | 17 |
| GO:0072503 | Breast | Precancer | cellular divalent inorganic cation homeostasis | 42/1080 | 486/18723 | 5.91e-03 | 4.21e-02 | 42 |
| GO:00000412 | Breast | Precancer | transition metal ion transport | 13/1080 | 105/18723 | 7.35e-03 | 4.89e-02 | 13 |
| GO:005507613 | Breast | IDC | transition metal ion homeostasis | 23/1434 | 138/18723 | 3.20e-04 | 4.79e-03 | 23 |
| GO:004691612 | Breast | IDC | cellular transition metal ion homeostasis | 20/1434 | 115/18723 | 4.35e-04 | 5.90e-03 | 20 |
| GO:005507622 | Breast | DCIS | transition metal ion homeostasis | 23/1390 | 138/18723 | 2.04e-04 | 3.27e-03 | 23 |
| GO:004691621 | Breast | DCIS | cellular transition metal ion homeostasis | 20/1390 | 115/18723 | 2.91e-04 | 4.27e-03 | 20 |
| GO:005507617 | Esophagus | ESCC | transition metal ion homeostasis | 87/8552 | 138/18723 | 2.85e-05 | 2.37e-04 | 87 |
| GO:00469169 | Esophagus | ESCC | cellular transition metal ion homeostasis | 70/8552 | 115/18723 | 7.28e-04 | 3.79e-03 | 70 |
| GO:00550766 | Liver | Cirrhotic | transition metal ion homeostasis | 59/4634 | 138/18723 | 2.59e-06 | 4.65e-05 | 59 |
| GO:00469164 | Liver | Cirrhotic | cellular transition metal ion homeostasis | 48/4634 | 115/18723 | 4.51e-05 | 5.30e-04 | 48 |
| GO:00068823 | Liver | Cirrhotic | cellular zinc ion homeostasis | 17/4634 | 38/18723 | 5.62e-03 | 2.84e-02 | 17 |
| GO:00550693 | Liver | Cirrhotic | zinc ion homeostasis | 17/4634 | 40/18723 | 1.04e-02 | 4.61e-02 | 17 |
| GO:005507612 | Liver | HCC | transition metal ion homeostasis | 81/7958 | 138/18723 | 8.87e-05 | 7.72e-04 | 81 |
| GO:004691611 | Liver | HCC | cellular transition metal ion homeostasis | 67/7958 | 115/18723 | 4.64e-04 | 3.08e-03 | 67 |
| GO:00000411 | Liver | HCC | transition metal ion transport | 59/7958 | 105/18723 | 3.18e-03 | 1.47e-02 | 59 |
| GO:000688212 | Liver | HCC | cellular zinc ion homeostasis | 24/7958 | 38/18723 | 8.20e-03 | 3.22e-02 | 24 |
| GO:005507610 | Oral cavity | OSCC | transition metal ion homeostasis | 81/7305 | 138/18723 | 2.13e-06 | 2.72e-05 | 81 |
| GO:00469168 | Oral cavity | OSCC | cellular transition metal ion homeostasis | 64/7305 | 115/18723 | 2.13e-04 | 1.40e-03 | 64 |
| Page: 1 2 |
| Pathway ID | Tissue | Disease Stage | Description | Gene Ratio | Bg Ratio | pvalue | p.adjust | qvalue | Count |
| hsa0501218 | Breast | Precancer | Parkinson disease | 99/684 | 266/8465 | 3.58e-42 | 5.65e-40 | 4.33e-40 | 99 |
| hsa0501016 | Breast | Precancer | Alzheimer disease | 103/684 | 384/8465 | 1.03e-29 | 4.66e-28 | 3.57e-28 | 103 |
| hsa0501219 | Breast | Precancer | Parkinson disease | 99/684 | 266/8465 | 3.58e-42 | 5.65e-40 | 4.33e-40 | 99 |
| hsa0501017 | Breast | Precancer | Alzheimer disease | 103/684 | 384/8465 | 1.03e-29 | 4.66e-28 | 3.57e-28 | 103 |
| hsa0501224 | Breast | IDC | Parkinson disease | 107/867 | 266/8465 | 2.57e-39 | 8.36e-37 | 6.26e-37 | 107 |
| hsa0501023 | Breast | IDC | Alzheimer disease | 107/867 | 384/8465 | 1.70e-23 | 7.88e-22 | 5.90e-22 | 107 |
| hsa0501234 | Breast | IDC | Parkinson disease | 107/867 | 266/8465 | 2.57e-39 | 8.36e-37 | 6.26e-37 | 107 |
| hsa0501033 | Breast | IDC | Alzheimer disease | 107/867 | 384/8465 | 1.70e-23 | 7.88e-22 | 5.90e-22 | 107 |
| hsa0501243 | Breast | DCIS | Parkinson disease | 106/846 | 266/8465 | 1.64e-39 | 5.29e-37 | 3.90e-37 | 106 |
| hsa0501043 | Breast | DCIS | Alzheimer disease | 105/846 | 384/8465 | 3.23e-23 | 1.49e-21 | 1.10e-21 | 105 |
| hsa0501253 | Breast | DCIS | Parkinson disease | 106/846 | 266/8465 | 1.64e-39 | 5.29e-37 | 3.90e-37 | 106 |
| hsa0501053 | Breast | DCIS | Alzheimer disease | 105/846 | 384/8465 | 3.23e-23 | 1.49e-21 | 1.10e-21 | 105 |
| hsa0501226 | Endometrium | AEH | Parkinson disease | 115/1197 | 266/8465 | 6.24e-32 | 1.01e-29 | 7.42e-30 | 115 |
| hsa0501020 | Endometrium | AEH | Alzheimer disease | 124/1197 | 384/8465 | 1.20e-20 | 3.91e-19 | 2.86e-19 | 124 |
| hsa05012111 | Endometrium | AEH | Parkinson disease | 115/1197 | 266/8465 | 6.24e-32 | 1.01e-29 | 7.42e-30 | 115 |
| hsa05010110 | Endometrium | AEH | Alzheimer disease | 124/1197 | 384/8465 | 1.20e-20 | 3.91e-19 | 2.86e-19 | 124 |
| hsa0501227 | Endometrium | EEC | Parkinson disease | 117/1237 | 266/8465 | 5.97e-32 | 9.82e-30 | 7.32e-30 | 117 |
| hsa0501025 | Endometrium | EEC | Alzheimer disease | 126/1237 | 384/8465 | 2.25e-20 | 7.40e-19 | 5.52e-19 | 126 |
| hsa0501236 | Endometrium | EEC | Parkinson disease | 117/1237 | 266/8465 | 5.97e-32 | 9.82e-30 | 7.32e-30 | 117 |
| hsa0501035 | Endometrium | EEC | Alzheimer disease | 126/1237 | 384/8465 | 2.25e-20 | 7.40e-19 | 5.52e-19 | 126 |
| Page: 1 2 3 |
Top |
Cell-cell communication analysis |
| Identification of potential cell-cell interactions between two cell types and their ligand-receptor pairs for different disease states |
| Ligand | Receptor | LRpair | Pathway | Tissue | Disease Stage |
| Page: 1 |
Top |
Single-cell gene regulatory network inference analysis |
| Find out the significant the regulons (TFs) and the target genes of each regulon across cell types for different disease states |
| TF | Cell Type | Tissue | Disease Stage | Target Gene | RSS | Regulon Activity |
| ∗The dot plots of a searched regulon are shown for all cell subpopulations in each disease state of each tissue based on the regulon specific score inferred using pySCENIC and by calculating the average expression. |
| Page: 1 |
Top |
Somatic mutation of malignant transformation related genes |
| Annotation of somatic variants for genes involved in malignant transformation |
| Hugo Symbol | Variant Class | Variant Classification | dbSNP RS | HGVSc | HGVSp | HGVSp Short | SWISSPROT | BIOTYPE | SIFT | PolyPhen | Tumor Sample Barcode | Tissue | Histology | Sex | Age | Stage | Therapy Types | Drugs | Outcome |
| SLC39A6 | SNV | Missense_Mutation | c.2047G>A | p.Glu683Lys | p.E683K | Q13433 | protein_coding | deleterious(0.04) | benign(0.115) | TCGA-A7-A6VX-01 | Breast | breast invasive carcinoma | Female | >=65 | I/II | Chemotherapy | docetaxel | CR | |
| SLC39A6 | SNV | Missense_Mutation | novel | c.2061N>A | p.Met687Ile | p.M687I | Q13433 | protein_coding | deleterious(0.05) | possibly_damaging(0.561) | TCGA-A8-A06X-01 | Breast | breast invasive carcinoma | Female | >=65 | I/II | Unknown | Unknown | SD |
| SLC39A6 | SNV | Missense_Mutation | c.113N>A | p.Pro38Gln | p.P38Q | Q13433 | protein_coding | deleterious(0.02) | benign(0.122) | TCGA-A8-A09A-01 | Breast | breast invasive carcinoma | Female | <65 | I/II | Hormone Therapy | tamoxiphen | SD | |
| SLC39A6 | SNV | Missense_Mutation | c.2122G>A | p.Glu708Lys | p.E708K | Q13433 | protein_coding | deleterious(0) | probably_damaging(0.993) | TCGA-AC-A23H-01 | Breast | breast invasive carcinoma | Female | >=65 | I/II | Unknown | Unknown | PD | |
| SLC39A6 | SNV | Missense_Mutation | c.2047N>C | p.Glu683Gln | p.E683Q | Q13433 | protein_coding | deleterious(0.04) | benign(0.233) | TCGA-B6-A0IJ-01 | Breast | breast invasive carcinoma | Female | <65 | I/II | Unknown | Unknown | SD | |
| SLC39A6 | SNV | Missense_Mutation | c.2012N>T | p.Gly671Val | p.G671V | Q13433 | protein_coding | deleterious(0) | probably_damaging(1) | TCGA-E9-A1NA-01 | Breast | breast invasive carcinoma | Female | <65 | I/II | Chemotherapy | cyclophosphamide | SD | |
| SLC39A6 | SNV | Missense_Mutation | c.1384N>A | p.Asp462Asn | p.D462N | Q13433 | protein_coding | tolerated(0.1) | benign(0.079) | TCGA-GM-A2D9-01 | Breast | breast invasive carcinoma | Female | >=65 | I/II | Hormone Therapy | arimidex | SD | |
| SLC39A6 | SNV | Missense_Mutation | c.787N>C | p.Glu263Gln | p.E263Q | Q13433 | protein_coding | tolerated(0.1) | benign(0.038) | TCGA-Q1-A5R2-01 | Cervix | cervical & endocervical cancer | Female | <65 | I/II | Chemotherapy | cisplatin | PR | |
| SLC39A6 | SNV | Missense_Mutation | novel | c.353C>T | p.Ser118Leu | p.S118L | Q13433 | protein_coding | tolerated(0.3) | benign(0) | TCGA-ZJ-AAXJ-01 | Cervix | cervical & endocervical cancer | Female | <65 | I/II | Unknown | Unknown | SD |
| SLC39A6 | SNV | Missense_Mutation | rs201226313 | c.2254N>T | p.Arg752Cys | p.R752C | Q13433 | protein_coding | deleterious(0.01) | possibly_damaging(0.613) | TCGA-AA-3510-01 | Colorectum | colon adenocarcinoma | Male | >=65 | I/II | Unknown | Unknown | SD |
| Page: 1 2 3 4 5 6 7 8 |
Top |
Related drugs of malignant transformation related genes |
| Identification of chemicals and drugs interact with genes involved in malignant transfromation |
| (DGIdb 4.0) |
| Entrez ID | Symbol | Category | Interaction Types | Drug Claim Name | Drug Name | PMIDs |
| 25800 | SLC39A6 | TRANSPORTER, ENZYME, DRUGGABLE GENOME, CELL SURFACE | SGN LIV1A |
| Page: 1 |

Copyright 2023-Present -The University of Texas Health Science Center at Houston |