
|
|||||
|
 | |
| |
| |
| |
| |
| |
|
Gene: SLC39A4 |
Gene summary for SLC39A4 |
| Gene information | Species | Human | Gene symbol | SLC39A4 | Gene ID | 55630 |
| Gene name | solute carrier family 39 member 4 | |
| Gene Alias | AEZ | |
| Cytomap | 8q24.3 | |
| Gene Type | protein-coding | GO ID | GO:0000041 | UniProtAcc | Q9NX22 |
Top |
Malignant transformation analysis |
| Identification of the aberrant gene expression in precancerous and cancerous lesions by comparing the gene expression of stem-like cells in diseased tissues with normal stem cells |
| Entrez ID | Symbol | Replicates | Species | Organ | Tissue | Adj P-value | Log2FC | Malignancy |
| 55630 | SLC39A4 | HTA11_3410_2000001011 | Human | Colorectum | AD | 9.10e-03 | 1.74e-01 | 0.0155 |
| 55630 | SLC39A4 | HTA11_2487_2000001011 | Human | Colorectum | SER | 6.27e-16 | 8.24e-01 | -0.1808 |
| 55630 | SLC39A4 | HTA11_1938_2000001011 | Human | Colorectum | AD | 2.10e-03 | 3.17e-01 | -0.0811 |
| 55630 | SLC39A4 | HTA11_78_2000001011 | Human | Colorectum | AD | 1.68e-06 | 3.35e-01 | -0.1088 |
| 55630 | SLC39A4 | HTA11_347_2000001011 | Human | Colorectum | AD | 4.69e-17 | 4.82e-01 | -0.1954 |
| 55630 | SLC39A4 | HTA11_411_2000001011 | Human | Colorectum | SER | 1.52e-05 | 1.15e+00 | -0.2602 |
| 55630 | SLC39A4 | HTA11_3361_2000001011 | Human | Colorectum | AD | 3.21e-04 | 3.26e-01 | -0.1207 |
| 55630 | SLC39A4 | HTA11_83_2000001011 | Human | Colorectum | SER | 3.78e-09 | 4.66e-01 | -0.1526 |
| 55630 | SLC39A4 | HTA11_696_2000001011 | Human | Colorectum | AD | 7.60e-11 | 3.07e-01 | -0.1464 |
| 55630 | SLC39A4 | HTA11_866_2000001011 | Human | Colorectum | AD | 2.52e-03 | 2.19e-01 | -0.1001 |
| 55630 | SLC39A4 | HTA11_1391_2000001011 | Human | Colorectum | AD | 4.55e-11 | 4.29e-01 | -0.059 |
| 55630 | SLC39A4 | HTA11_5212_2000001011 | Human | Colorectum | AD | 1.56e-03 | 3.97e-01 | -0.2061 |
| 55630 | SLC39A4 | HTA11_546_2000001011 | Human | Colorectum | AD | 8.22e-04 | 2.46e-01 | -0.0842 |
| 55630 | SLC39A4 | HTA11_866_3004761011 | Human | Colorectum | AD | 1.10e-07 | 2.91e-01 | 0.096 |
| 55630 | SLC39A4 | HTA11_4255_2000001011 | Human | Colorectum | SER | 7.65e-03 | 3.97e-01 | 0.0446 |
| 55630 | SLC39A4 | HTA11_6801_2000001011 | Human | Colorectum | SER | 4.08e-02 | 5.04e-01 | 0.0171 |
| 55630 | SLC39A4 | HTA11_10711_2000001011 | Human | Colorectum | AD | 1.27e-05 | 2.76e-01 | 0.0338 |
| 55630 | SLC39A4 | HTA11_7696_3000711011 | Human | Colorectum | AD | 3.94e-13 | 4.42e-01 | 0.0674 |
| 55630 | SLC39A4 | HTA11_99999970781_79442 | Human | Colorectum | MSS | 4.19e-07 | 3.18e-01 | 0.294 |
| 55630 | SLC39A4 | HTA11_99999965104_69814 | Human | Colorectum | MSS | 3.94e-04 | 2.44e-01 | 0.281 |
| Page: 1 2 3 4 5 6 7 8 |
| Tissue | Expression Dynamics | Abbreviation |
| Colorectum (GSE201348) |  | FAP: Familial adenomatous polyposis |
| CRC: Colorectal cancer | ||
| Colorectum (HTA11) |  | AD: Adenomas |
| SER: Sessile serrated lesions | ||
| MSI-H: Microsatellite-high colorectal cancer | ||
| MSS: Microsatellite stable colorectal cancer | ||
| Esophagus | 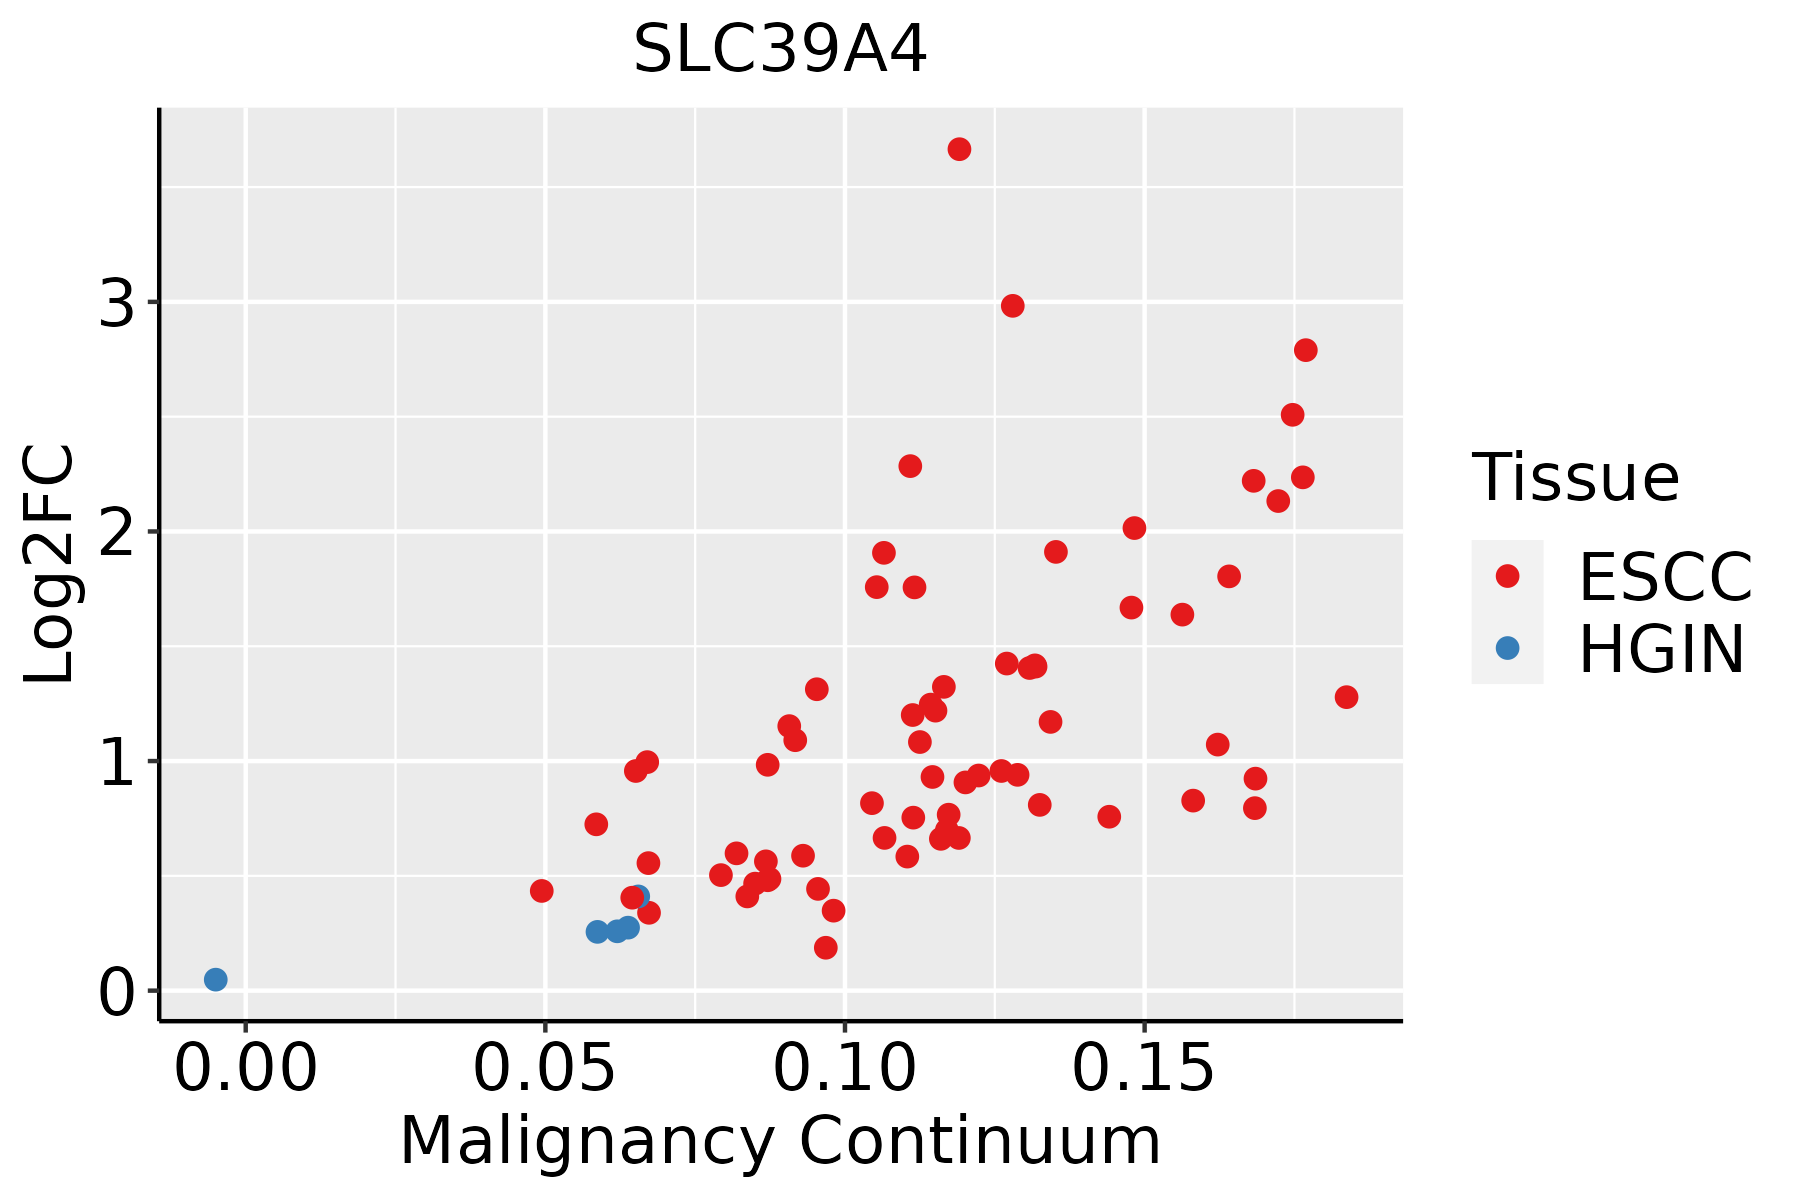 | ESCC: Esophageal squamous cell carcinoma |
| HGIN: High-grade intraepithelial neoplasias | ||
| LGIN: Low-grade intraepithelial neoplasias | ||
| GC |  | CAG: Chronic atrophic gastritis |
| CAG with IM: Chronic atrophic gastritis with intestinal metaplasia | ||
| CSG: Chronic superficial gastritis | ||
| GC: Gastric cancer | ||
| SIM: Severe intestinal metaplasia | ||
| WIM: Wild intestinal metaplasia | ||
| Liver |  | HCC: Hepatocellular carcinoma |
| NAFLD: Non-alcoholic fatty liver disease | ||
| Oral Cavity | 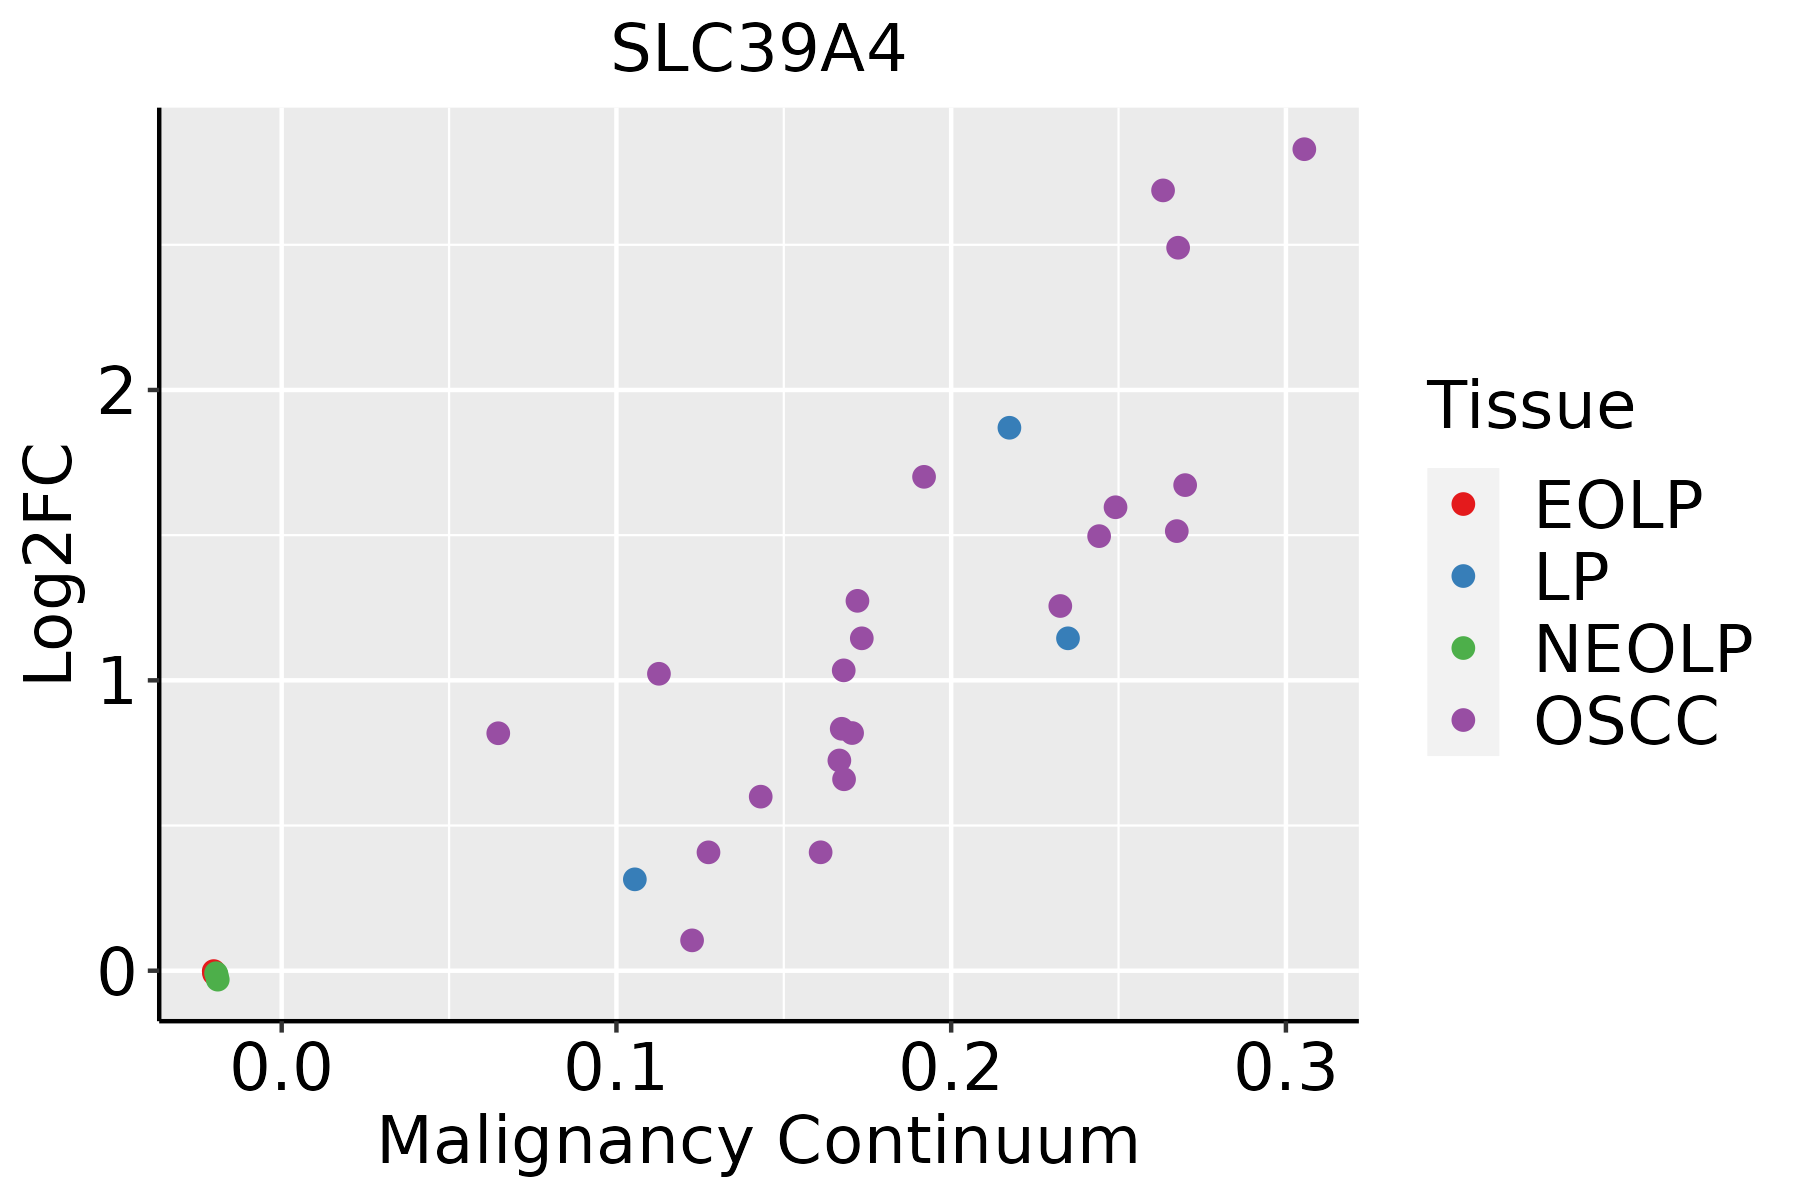 | EOLP: Erosive Oral lichen planus |
| LP: leukoplakia | ||
| NEOLP: Non-erosive oral lichen planus | ||
| OSCC: Oral squamous cell carcinoma | ||
| Skin | 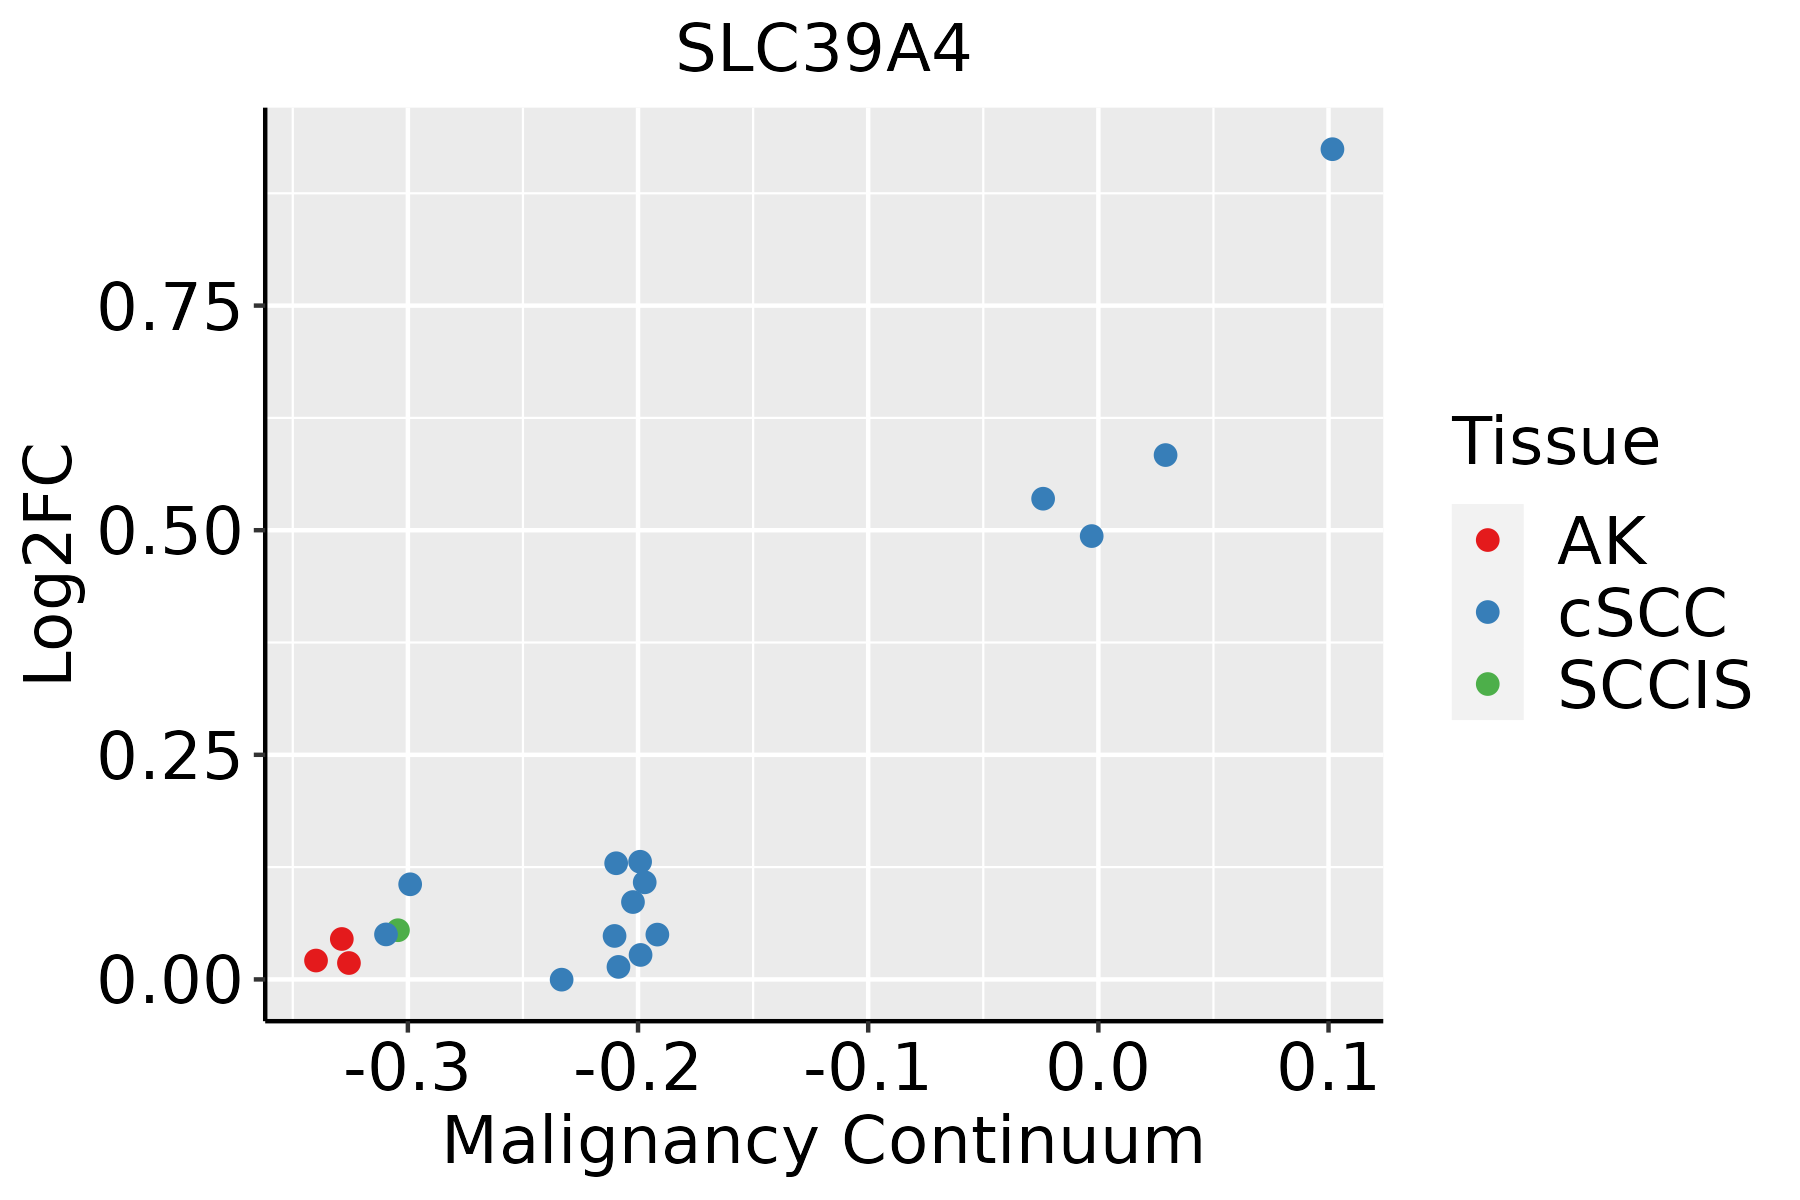 | AK: Actinic keratosis |
| cSCC: Cutaneous squamous cell carcinoma | ||
| SCCIS:squamous cell carcinoma in situ |
| ∗log2FC in expression of this searched gene in stem-like cells from each diseased tissue sample relative to stem-like cells in normal samples in each tissue plotted against the malignancy continuum. Samples are colored based on if they are from different disease stage. |
Top |
Malignant transformation related pathway analysis |
| Find out the enriched GO biological processes and KEGG pathways involved in transition from healthy to precancer to cancer |
| Tissue | Disease Stage | Enriched GO biological Processes |
| Colorectum | AD |  |
| Colorectum | SER |  |
| Colorectum | MSS |  |
| Colorectum | MSI-H |  |
| Colorectum | FAP |  |
| ∗Top 15 enriched GO BP terms are showed in the bar plot of each disease state in each tissue. Each row represents a significant GO biological process which is colored according to the -log10(p.adjust). |
| Page: 1 2 3 4 5 6 7 8 9 |
| GO ID | Tissue | Disease Stage | Description | Gene Ratio | Bg Ratio | pvalue | p.adjust | Count |
| GO:0055076 | Colorectum | AD | transition metal ion homeostasis | 53/3918 | 138/18723 | 1.89e-06 | 5.65e-05 | 53 |
| GO:0031667 | Colorectum | AD | response to nutrient levels | 138/3918 | 474/18723 | 1.22e-05 | 2.68e-04 | 138 |
| GO:0046916 | Colorectum | AD | cellular transition metal ion homeostasis | 43/3918 | 115/18723 | 3.62e-05 | 6.56e-04 | 43 |
| GO:0042594 | Colorectum | AD | response to starvation | 63/3918 | 197/18723 | 1.77e-04 | 2.38e-03 | 63 |
| GO:0071496 | Colorectum | AD | cellular response to external stimulus | 94/3918 | 320/18723 | 1.98e-04 | 2.64e-03 | 94 |
| GO:0009267 | Colorectum | AD | cellular response to starvation | 51/3918 | 156/18723 | 3.90e-04 | 4.44e-03 | 51 |
| GO:0055069 | Colorectum | AD | zinc ion homeostasis | 18/3918 | 40/18723 | 5.36e-04 | 5.74e-03 | 18 |
| GO:0006882 | Colorectum | AD | cellular zinc ion homeostasis | 17/3918 | 38/18723 | 8.26e-04 | 8.13e-03 | 17 |
| GO:0031668 | Colorectum | AD | cellular response to extracellular stimulus | 71/3918 | 246/18723 | 1.86e-03 | 1.52e-02 | 71 |
| GO:0031669 | Colorectum | AD | cellular response to nutrient levels | 63/3918 | 215/18723 | 2.19e-03 | 1.73e-02 | 63 |
| GO:00550761 | Colorectum | SER | transition metal ion homeostasis | 41/2897 | 138/18723 | 1.66e-05 | 5.05e-04 | 41 |
| GO:00316671 | Colorectum | SER | response to nutrient levels | 106/2897 | 474/18723 | 3.94e-05 | 1.00e-03 | 106 |
| GO:00469161 | Colorectum | SER | cellular transition metal ion homeostasis | 33/2897 | 115/18723 | 2.20e-04 | 3.89e-03 | 33 |
| GO:00550691 | Colorectum | SER | zinc ion homeostasis | 15/2897 | 40/18723 | 5.71e-04 | 7.86e-03 | 15 |
| GO:00068821 | Colorectum | SER | cellular zinc ion homeostasis | 14/2897 | 38/18723 | 1.06e-03 | 1.23e-02 | 14 |
| GO:00425941 | Colorectum | SER | response to starvation | 47/2897 | 197/18723 | 1.31e-03 | 1.45e-02 | 47 |
| GO:00714961 | Colorectum | SER | cellular response to external stimulus | 70/2897 | 320/18723 | 1.40e-03 | 1.53e-02 | 70 |
| GO:00092671 | Colorectum | SER | cellular response to starvation | 38/2897 | 156/18723 | 2.45e-03 | 2.32e-02 | 38 |
| GO:00316681 | Colorectum | SER | cellular response to extracellular stimulus | 54/2897 | 246/18723 | 4.26e-03 | 3.45e-02 | 54 |
| GO:00316691 | Colorectum | SER | cellular response to nutrient levels | 48/2897 | 215/18723 | 4.82e-03 | 3.78e-02 | 48 |
| Page: 1 2 3 4 5 6 |
| Pathway ID | Tissue | Disease Stage | Description | Gene Ratio | Bg Ratio | pvalue | p.adjust | qvalue | Count |
| hsa05012 | Colorectum | AD | Parkinson disease | 147/2092 | 266/8465 | 2.53e-27 | 8.48e-25 | 5.41e-25 | 147 |
| hsa05010 | Colorectum | AD | Alzheimer disease | 174/2092 | 384/8465 | 1.82e-19 | 9.26e-18 | 5.91e-18 | 174 |
| hsa050121 | Colorectum | AD | Parkinson disease | 147/2092 | 266/8465 | 2.53e-27 | 8.48e-25 | 5.41e-25 | 147 |
| hsa050101 | Colorectum | AD | Alzheimer disease | 174/2092 | 384/8465 | 1.82e-19 | 9.26e-18 | 5.91e-18 | 174 |
| hsa050122 | Colorectum | SER | Parkinson disease | 132/1580 | 266/8465 | 2.72e-31 | 9.03e-29 | 6.55e-29 | 132 |
| hsa050102 | Colorectum | SER | Alzheimer disease | 146/1580 | 384/8465 | 6.52e-20 | 2.40e-18 | 1.75e-18 | 146 |
| hsa050123 | Colorectum | SER | Parkinson disease | 132/1580 | 266/8465 | 2.72e-31 | 9.03e-29 | 6.55e-29 | 132 |
| hsa050103 | Colorectum | SER | Alzheimer disease | 146/1580 | 384/8465 | 6.52e-20 | 2.40e-18 | 1.75e-18 | 146 |
| hsa050124 | Colorectum | MSS | Parkinson disease | 140/1875 | 266/8465 | 2.32e-28 | 7.79e-26 | 4.77e-26 | 140 |
| hsa050104 | Colorectum | MSS | Alzheimer disease | 169/1875 | 384/8465 | 1.21e-22 | 1.01e-20 | 6.21e-21 | 169 |
| hsa050125 | Colorectum | MSS | Parkinson disease | 140/1875 | 266/8465 | 2.32e-28 | 7.79e-26 | 4.77e-26 | 140 |
| hsa050105 | Colorectum | MSS | Alzheimer disease | 169/1875 | 384/8465 | 1.21e-22 | 1.01e-20 | 6.21e-21 | 169 |
| hsa0501239 | Esophagus | HGIN | Parkinson disease | 124/1383 | 266/8465 | 5.95e-32 | 9.70e-30 | 7.70e-30 | 124 |
| hsa0501030 | Esophagus | HGIN | Alzheimer disease | 130/1383 | 384/8465 | 5.26e-18 | 1.71e-16 | 1.36e-16 | 130 |
| hsa05012114 | Esophagus | HGIN | Parkinson disease | 124/1383 | 266/8465 | 5.95e-32 | 9.70e-30 | 7.70e-30 | 124 |
| hsa05010113 | Esophagus | HGIN | Alzheimer disease | 130/1383 | 384/8465 | 5.26e-18 | 1.71e-16 | 1.36e-16 | 130 |
| hsa05012211 | Esophagus | ESCC | Parkinson disease | 201/4205 | 266/8465 | 1.56e-18 | 8.72e-17 | 4.46e-17 | 201 |
| hsa05010210 | Esophagus | ESCC | Alzheimer disease | 263/4205 | 384/8465 | 1.80e-14 | 5.47e-13 | 2.80e-13 | 263 |
| hsa05012310 | Esophagus | ESCC | Parkinson disease | 201/4205 | 266/8465 | 1.56e-18 | 8.72e-17 | 4.46e-17 | 201 |
| hsa0501038 | Esophagus | ESCC | Alzheimer disease | 263/4205 | 384/8465 | 1.80e-14 | 5.47e-13 | 2.80e-13 | 263 |
| Page: 1 2 3 |
Top |
Cell-cell communication analysis |
| Identification of potential cell-cell interactions between two cell types and their ligand-receptor pairs for different disease states |
| Ligand | Receptor | LRpair | Pathway | Tissue | Disease Stage |
| Page: 1 |
Top |
Single-cell gene regulatory network inference analysis |
| Find out the significant the regulons (TFs) and the target genes of each regulon across cell types for different disease states |
| TF | Cell Type | Tissue | Disease Stage | Target Gene | RSS | Regulon Activity |
| ∗The dot plots of a searched regulon are shown for all cell subpopulations in each disease state of each tissue based on the regulon specific score inferred using pySCENIC and by calculating the average expression. |
| Page: 1 |
Top |
Somatic mutation of malignant transformation related genes |
| Annotation of somatic variants for genes involved in malignant transformation |
| Hugo Symbol | Variant Class | Variant Classification | dbSNP RS | HGVSc | HGVSp | HGVSp Short | SWISSPROT | BIOTYPE | SIFT | PolyPhen | Tumor Sample Barcode | Tissue | Histology | Sex | Age | Stage | Therapy Types | Drugs | Outcome |
| SLC39A4 | SNV | Missense_Mutation | novel | c.1565N>G | p.Ser522Cys | p.S522C | Q6P5W5 | protein_coding | deleterious(0) | probably_damaging(0.99) | TCGA-AC-A8OP-01 | Breast | breast invasive carcinoma | Female | >=65 | I/II | Unknown | Unknown | SD |
| SLC39A4 | SNV | Missense_Mutation | c.812T>A | p.Leu271Gln | p.L271Q | Q6P5W5 | protein_coding | deleterious(0) | probably_damaging(0.998) | TCGA-C8-A12M-01 | Breast | breast invasive carcinoma | Female | >=65 | I/II | Unknown | Unknown | SD | |
| SLC39A4 | SNV | Missense_Mutation | c.911A>T | p.Gln304Leu | p.Q304L | Q6P5W5 | protein_coding | tolerated(1) | possibly_damaging(0.731) | TCGA-E9-A22A-01 | Breast | breast invasive carcinoma | Female | >=65 | I/II | Hormone Therapy | tamoxiphen | SD | |
| SLC39A4 | SNV | Missense_Mutation | rs147786120 | c.949N>A | p.Val317Ile | p.V317I | Q6P5W5 | protein_coding | tolerated(0.16) | benign(0) | TCGA-OL-A6VR-01 | Breast | breast invasive carcinoma | Female | <65 | I/II | Unknown | Unknown | SD |
| SLC39A4 | SNV | Missense_Mutation | c.766N>A | p.Leu256Ile | p.L256I | Q6P5W5 | protein_coding | tolerated(0.29) | benign(0.271) | TCGA-EA-A556-01 | Cervix | cervical & endocervical cancer | Female | <65 | I/II | Unknown | Unknown | SD | |
| SLC39A4 | SNV | Missense_Mutation | novel | c.1288N>A | p.Asp430Asn | p.D430N | Q6P5W5 | protein_coding | tolerated(0.14) | benign(0.029) | TCGA-VS-A8EL-01 | Cervix | cervical & endocervical cancer | Female | <65 | I/II | Chemotherapy | cisplatin | CR |
| SLC39A4 | SNV | Missense_Mutation | novel | c.1153N>A | p.Leu385Met | p.L385M | Q6P5W5 | protein_coding | deleterious(0) | probably_damaging(0.997) | TCGA-VS-A94Y-01 | Cervix | cervical & endocervical cancer | Female | <65 | I/II | Chemotherapy | cisplatin | PD |
| SLC39A4 | SNV | Missense_Mutation | c.1546G>T | p.Gly516Cys | p.G516C | Q6P5W5 | protein_coding | deleterious(0) | probably_damaging(1) | TCGA-AZ-4615-01 | Colorectum | colon adenocarcinoma | Male | >=65 | III/IV | Chemotherapy | xeloda | PD | |
| SLC39A4 | SNV | Missense_Mutation | c.94N>G | p.Leu32Val | p.L32V | Q6P5W5 | protein_coding | tolerated(0.35) | probably_damaging(0.951) | TCGA-CM-5868-01 | Colorectum | colon adenocarcinoma | Female | <65 | I/II | Chemotherapy | fluorouracil | SD | |
| SLC39A4 | SNV | Missense_Mutation | c.1754G>T | p.Ser585Ile | p.S585I | Q6P5W5 | protein_coding | deleterious(0.03) | possibly_damaging(0.676) | TCGA-D5-6540-01 | Colorectum | colon adenocarcinoma | Male | >=65 | I/II | Unknown | Unknown | SD |
| Page: 1 2 3 4 5 6 |
Top |
Related drugs of malignant transformation related genes |
| Identification of chemicals and drugs interact with genes involved in malignant transfromation |
| (DGIdb 4.0) |
| Entrez ID | Symbol | Category | Interaction Types | Drug Claim Name | Drug Name | PMIDs |
| Page: 1 |

Copyright 2023-Present -The University of Texas Health Science Center at Houston |