
|
|||||
|
 | |
| |
| |
| |
| |
| |
|
Gene: SLC39A3 |
Gene summary for SLC39A3 |
| Gene information | Species | Human | Gene symbol | SLC39A3 | Gene ID | 29985 |
| Gene name | solute carrier family 39 member 3 | |
| Gene Alias | ZIP-3 | |
| Cytomap | 19p13.3 | |
| Gene Type | protein-coding | GO ID | GO:0000041 | UniProtAcc | Q9BRY0 |
Top |
Malignant transformation analysis |
| Identification of the aberrant gene expression in precancerous and cancerous lesions by comparing the gene expression of stem-like cells in diseased tissues with normal stem cells |
| Entrez ID | Symbol | Replicates | Species | Organ | Tissue | Adj P-value | Log2FC | Malignancy |
| 29985 | SLC39A3 | LZE4T | Human | Esophagus | ESCC | 1.10e-06 | 2.68e-01 | 0.0811 |
| 29985 | SLC39A3 | LZE5T | Human | Esophagus | ESCC | 3.61e-03 | 3.58e-01 | 0.0514 |
| 29985 | SLC39A3 | LZE20T | Human | Esophagus | ESCC | 2.51e-03 | 1.66e-01 | 0.0662 |
| 29985 | SLC39A3 | LZE22T | Human | Esophagus | ESCC | 1.84e-05 | 4.83e-01 | 0.068 |
| 29985 | SLC39A3 | LZE24T | Human | Esophagus | ESCC | 2.27e-15 | 3.90e-01 | 0.0596 |
| 29985 | SLC39A3 | LZE21T | Human | Esophagus | ESCC | 3.85e-03 | 3.98e-01 | 0.0655 |
| 29985 | SLC39A3 | P4T-E | Human | Esophagus | ESCC | 2.63e-06 | 1.45e-01 | 0.1323 |
| 29985 | SLC39A3 | P5T-E | Human | Esophagus | ESCC | 7.24e-05 | 1.22e-01 | 0.1327 |
| 29985 | SLC39A3 | P8T-E | Human | Esophagus | ESCC | 2.06e-08 | 1.06e-01 | 0.0889 |
| 29985 | SLC39A3 | P9T-E | Human | Esophagus | ESCC | 5.41e-08 | 2.71e-01 | 0.1131 |
| 29985 | SLC39A3 | P10T-E | Human | Esophagus | ESCC | 1.84e-13 | 2.51e-01 | 0.116 |
| 29985 | SLC39A3 | P11T-E | Human | Esophagus | ESCC | 3.10e-10 | 5.07e-01 | 0.1426 |
| 29985 | SLC39A3 | P12T-E | Human | Esophagus | ESCC | 1.39e-08 | 1.59e-01 | 0.1122 |
| 29985 | SLC39A3 | P15T-E | Human | Esophagus | ESCC | 3.64e-06 | 1.61e-01 | 0.1149 |
| 29985 | SLC39A3 | P16T-E | Human | Esophagus | ESCC | 6.33e-05 | 1.28e-01 | 0.1153 |
| 29985 | SLC39A3 | P17T-E | Human | Esophagus | ESCC | 2.65e-06 | 3.27e-01 | 0.1278 |
| 29985 | SLC39A3 | P19T-E | Human | Esophagus | ESCC | 7.61e-05 | 4.03e-01 | 0.1662 |
| 29985 | SLC39A3 | P20T-E | Human | Esophagus | ESCC | 1.94e-06 | 1.59e-01 | 0.1124 |
| 29985 | SLC39A3 | P21T-E | Human | Esophagus | ESCC | 3.63e-15 | 3.23e-01 | 0.1617 |
| 29985 | SLC39A3 | P22T-E | Human | Esophagus | ESCC | 3.94e-11 | 2.10e-01 | 0.1236 |
| Page: 1 2 3 4 5 |
| Tissue | Expression Dynamics | Abbreviation |
| Esophagus | 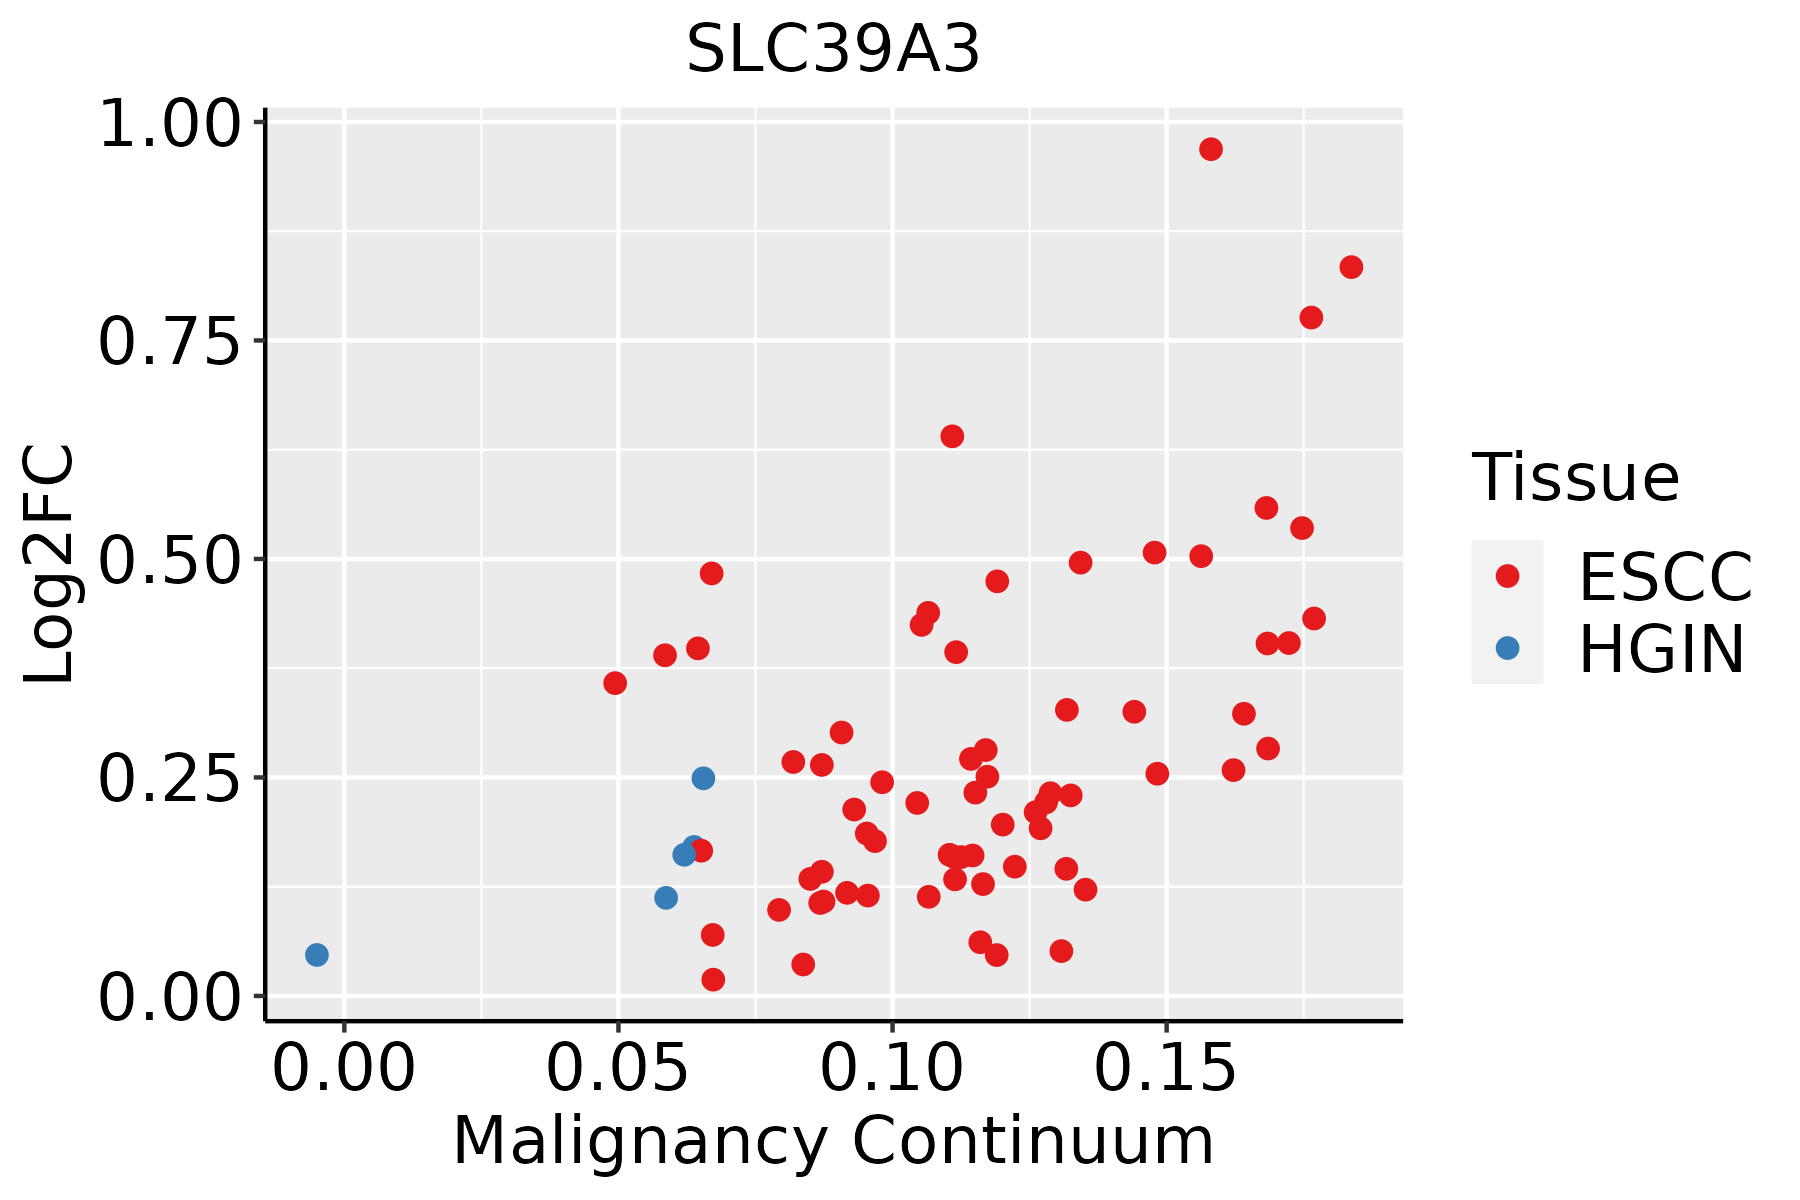 | ESCC: Esophageal squamous cell carcinoma |
| HGIN: High-grade intraepithelial neoplasias | ||
| LGIN: Low-grade intraepithelial neoplasias | ||
| Oral Cavity | 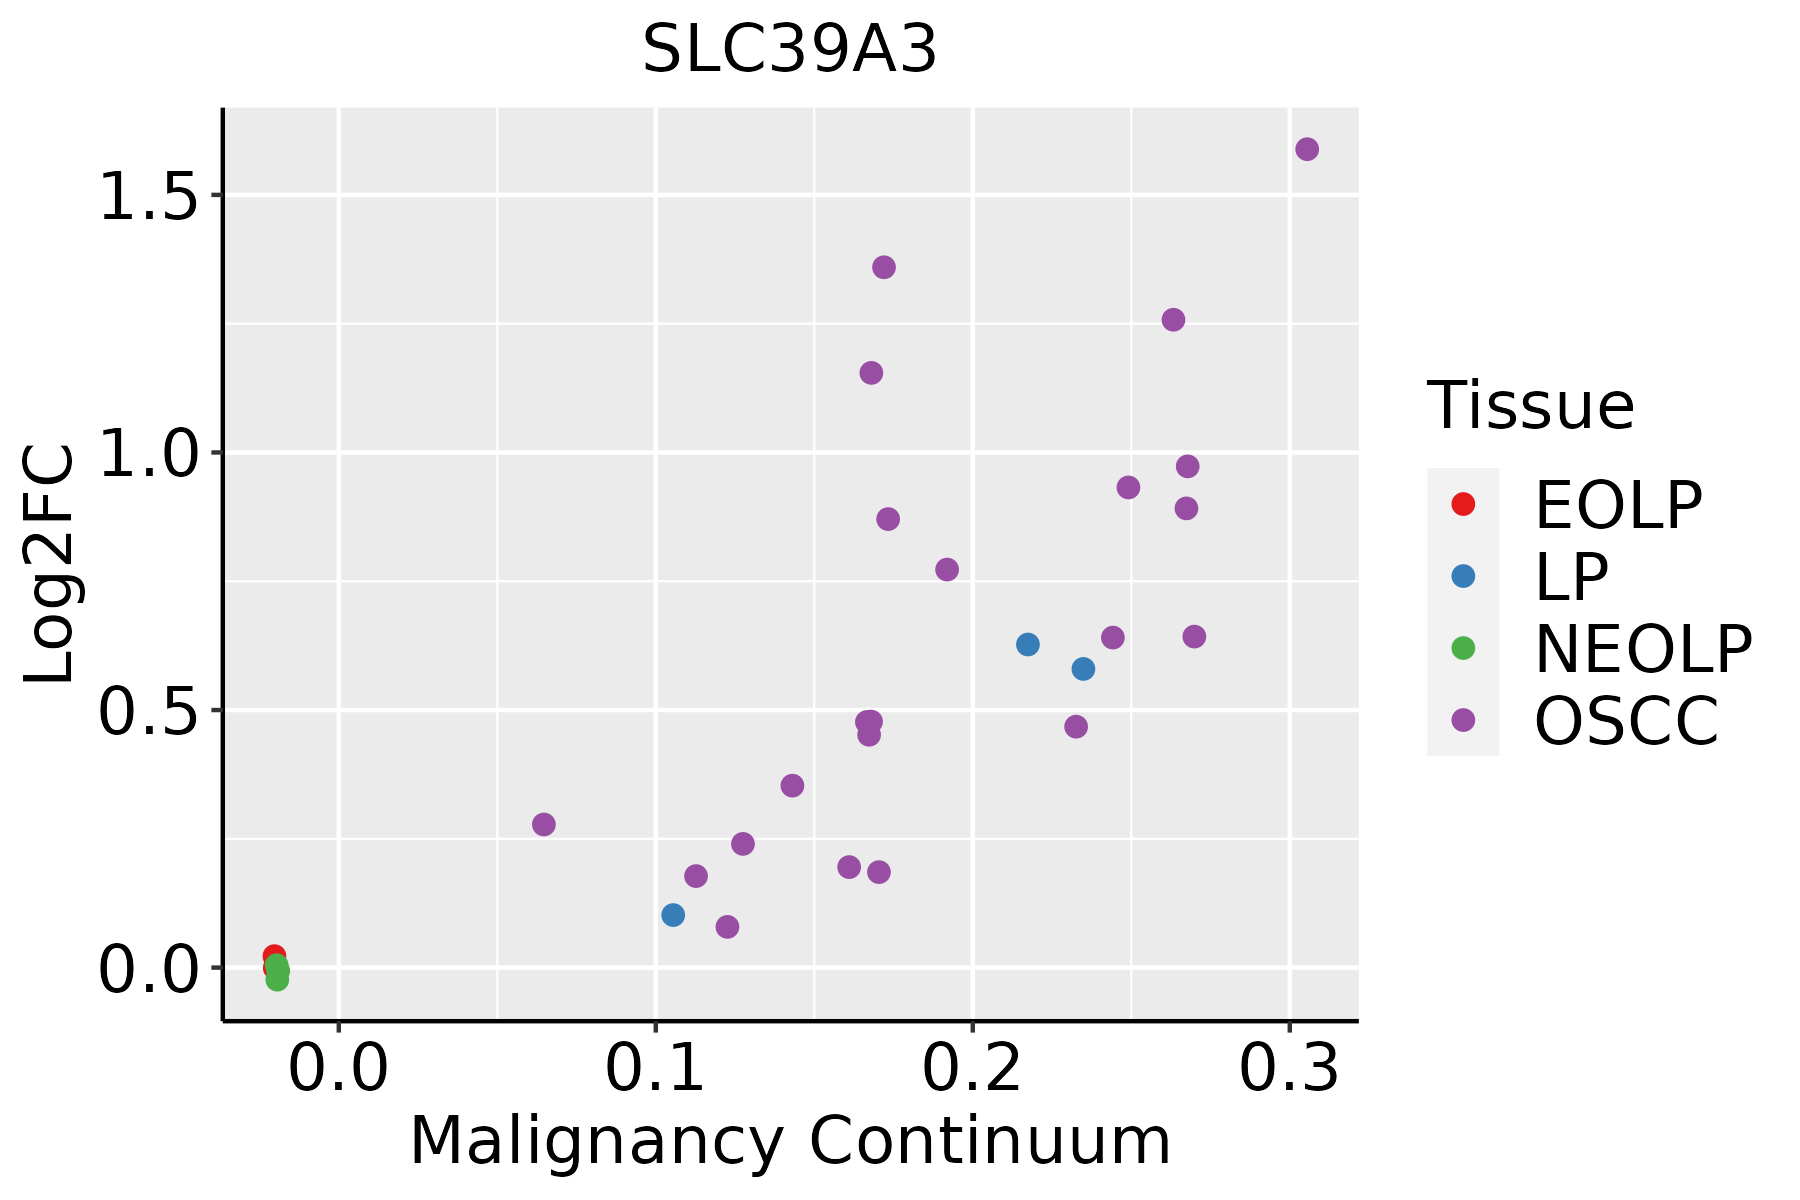 | EOLP: Erosive Oral lichen planus |
| LP: leukoplakia | ||
| NEOLP: Non-erosive oral lichen planus | ||
| OSCC: Oral squamous cell carcinoma | ||
| Skin | 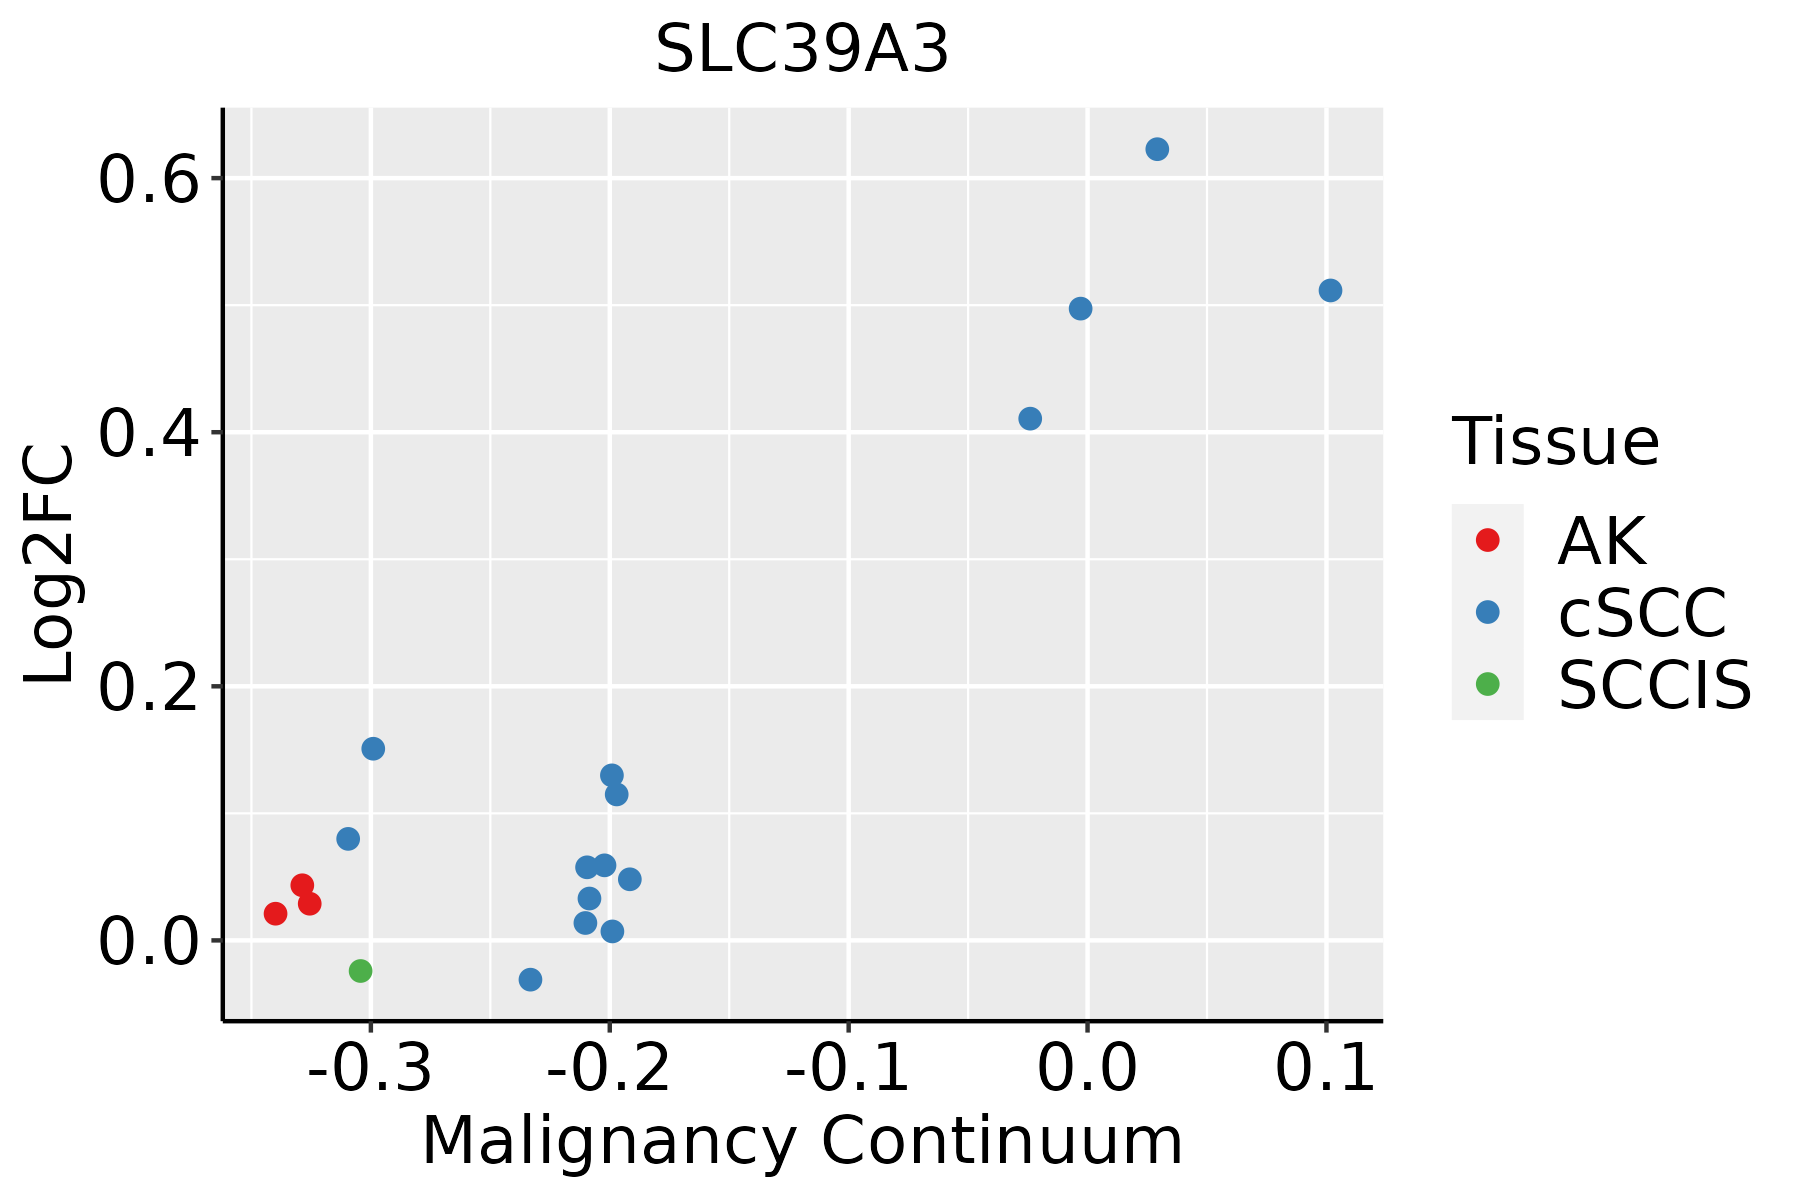 | AK: Actinic keratosis |
| cSCC: Cutaneous squamous cell carcinoma | ||
| SCCIS:squamous cell carcinoma in situ | ||
| Thyroid |  | ATC: Anaplastic thyroid cancer |
| HT: Hashimoto's thyroiditis | ||
| PTC: Papillary thyroid cancer |
| ∗log2FC in expression of this searched gene in stem-like cells from each diseased tissue sample relative to stem-like cells in normal samples in each tissue plotted against the malignancy continuum. Samples are colored based on if they are from different disease stage. |
Top |
Malignant transformation related pathway analysis |
| Find out the enriched GO biological processes and KEGG pathways involved in transition from healthy to precancer to cancer |
| Tissue | Disease Stage | Enriched GO biological Processes |
| Colorectum | AD |  |
| Colorectum | SER |  |
| Colorectum | MSS |  |
| Colorectum | MSI-H |  |
| Colorectum | FAP |  |
| ∗Top 15 enriched GO BP terms are showed in the bar plot of each disease state in each tissue. Each row represents a significant GO biological process which is colored according to the -log10(p.adjust). |
| Page: 1 2 3 4 5 6 7 8 9 |
| GO ID | Tissue | Disease Stage | Description | Gene Ratio | Bg Ratio | pvalue | p.adjust | Count |
| GO:000170119 | Esophagus | ESCC | in utero embryonic development | 243/8552 | 367/18723 | 1.00e-15 | 6.86e-14 | 243 |
| GO:0048872111 | Esophagus | ESCC | homeostasis of number of cells | 163/8552 | 272/18723 | 1.40e-06 | 1.69e-05 | 163 |
| GO:00485687 | Esophagus | ESCC | embryonic organ development | 228/8552 | 427/18723 | 7.28e-04 | 3.79e-03 | 228 |
| GO:00487367 | Esophagus | ESCC | appendage development | 98/8552 | 172/18723 | 1.83e-03 | 8.37e-03 | 98 |
| GO:00601737 | Esophagus | ESCC | limb development | 98/8552 | 172/18723 | 1.83e-03 | 8.37e-03 | 98 |
| GO:00487052 | Esophagus | ESCC | skeletal system morphogenesis | 120/8552 | 220/18723 | 4.90e-03 | 1.89e-02 | 120 |
| GO:19048881 | Esophagus | ESCC | cranial skeletal system development | 41/8552 | 68/18723 | 1.07e-02 | 3.66e-02 | 41 |
| GO:000170116 | Oral cavity | OSCC | in utero embryonic development | 207/7305 | 367/18723 | 7.92e-12 | 2.95e-10 | 207 |
| GO:004887220 | Oral cavity | OSCC | homeostasis of number of cells | 152/7305 | 272/18723 | 1.08e-08 | 2.23e-07 | 152 |
| GO:0001776 | Oral cavity | OSCC | leukocyte homeostasis | 48/7305 | 87/18723 | 1.60e-03 | 7.62e-03 | 48 |
| GO:1904888 | Oral cavity | OSCC | cranial skeletal system development | 36/7305 | 68/18723 | 1.36e-02 | 4.50e-02 | 36 |
| GO:000170117 | Oral cavity | LP | in utero embryonic development | 142/4623 | 367/18723 | 1.48e-09 | 6.75e-08 | 142 |
| GO:0048872110 | Oral cavity | LP | homeostasis of number of cells | 87/4623 | 272/18723 | 3.75e-03 | 2.47e-02 | 87 |
| GO:000170124 | Skin | cSCC | in utero embryonic development | 150/4864 | 367/18723 | 2.47e-10 | 1.04e-08 | 150 |
| GO:004887229 | Skin | cSCC | homeostasis of number of cells | 104/4864 | 272/18723 | 5.34e-06 | 7.71e-05 | 104 |
| GO:0001701111 | Thyroid | PTC | in utero embryonic development | 175/5968 | 367/18723 | 1.40e-10 | 4.73e-09 | 175 |
| GO:0048872113 | Thyroid | PTC | homeostasis of number of cells | 125/5968 | 272/18723 | 7.25e-07 | 1.14e-05 | 125 |
| GO:000170126 | Thyroid | ATC | in utero embryonic development | 183/6293 | 367/18723 | 6.62e-11 | 2.11e-09 | 183 |
| GO:0048872210 | Thyroid | ATC | homeostasis of number of cells | 135/6293 | 272/18723 | 2.92e-08 | 5.50e-07 | 135 |
| GO:00487053 | Thyroid | ATC | skeletal system morphogenesis | 101/6293 | 220/18723 | 9.48e-05 | 6.93e-04 | 101 |
| Page: 1 2 |
| Pathway ID | Tissue | Disease Stage | Description | Gene Ratio | Bg Ratio | pvalue | p.adjust | qvalue | Count |
| hsa05012211 | Esophagus | ESCC | Parkinson disease | 201/4205 | 266/8465 | 1.56e-18 | 8.72e-17 | 4.46e-17 | 201 |
| hsa05010210 | Esophagus | ESCC | Alzheimer disease | 263/4205 | 384/8465 | 1.80e-14 | 5.47e-13 | 2.80e-13 | 263 |
| hsa05012310 | Esophagus | ESCC | Parkinson disease | 201/4205 | 266/8465 | 1.56e-18 | 8.72e-17 | 4.46e-17 | 201 |
| hsa0501038 | Esophagus | ESCC | Alzheimer disease | 263/4205 | 384/8465 | 1.80e-14 | 5.47e-13 | 2.80e-13 | 263 |
| hsa0501230 | Oral cavity | OSCC | Parkinson disease | 188/3704 | 266/8465 | 1.82e-19 | 1.52e-17 | 7.75e-18 | 188 |
| hsa0501028 | Oral cavity | OSCC | Alzheimer disease | 244/3704 | 384/8465 | 1.18e-15 | 3.60e-14 | 1.83e-14 | 244 |
| hsa05012113 | Oral cavity | OSCC | Parkinson disease | 188/3704 | 266/8465 | 1.82e-19 | 1.52e-17 | 7.75e-18 | 188 |
| hsa05010112 | Oral cavity | OSCC | Alzheimer disease | 244/3704 | 384/8465 | 1.18e-15 | 3.60e-14 | 1.83e-14 | 244 |
| hsa05012210 | Oral cavity | LP | Parkinson disease | 166/2418 | 266/8465 | 2.02e-31 | 3.36e-29 | 2.17e-29 | 166 |
| hsa0501029 | Oral cavity | LP | Alzheimer disease | 197/2418 | 384/8465 | 6.66e-22 | 3.69e-20 | 2.38e-20 | 197 |
| hsa0501238 | Oral cavity | LP | Parkinson disease | 166/2418 | 266/8465 | 2.02e-31 | 3.36e-29 | 2.17e-29 | 166 |
| hsa0501037 | Oral cavity | LP | Alzheimer disease | 197/2418 | 384/8465 | 6.66e-22 | 3.69e-20 | 2.38e-20 | 197 |
| Page: 1 |
Top |
Cell-cell communication analysis |
| Identification of potential cell-cell interactions between two cell types and their ligand-receptor pairs for different disease states |
| Ligand | Receptor | LRpair | Pathway | Tissue | Disease Stage |
| Page: 1 |
Top |
Single-cell gene regulatory network inference analysis |
| Find out the significant the regulons (TFs) and the target genes of each regulon across cell types for different disease states |
| TF | Cell Type | Tissue | Disease Stage | Target Gene | RSS | Regulon Activity |
| ∗The dot plots of a searched regulon are shown for all cell subpopulations in each disease state of each tissue based on the regulon specific score inferred using pySCENIC and by calculating the average expression. |
| Page: 1 |
Top |
Somatic mutation of malignant transformation related genes |
| Annotation of somatic variants for genes involved in malignant transformation |
| Hugo Symbol | Variant Class | Variant Classification | dbSNP RS | HGVSc | HGVSp | HGVSp Short | SWISSPROT | BIOTYPE | SIFT | PolyPhen | Tumor Sample Barcode | Tissue | Histology | Sex | Age | Stage | Therapy Types | Drugs | Outcome |
| SLC39A3 | SNV | Missense_Mutation | c.136N>T | p.Leu46Phe | p.L46F | Q9BRY0 | protein_coding | tolerated(0.26) | benign(0.053) | TCGA-BH-A0HF-01 | Breast | breast invasive carcinoma | Female | >=65 | I/II | Hormone Therapy | arimidex | SD | |
| SLC39A3 | SNV | Missense_Mutation | rs200442678 | c.913G>A | p.Val305Ile | p.V305I | Q9BRY0 | protein_coding | tolerated(0.2) | benign(0.058) | TCGA-AA-3663-01 | Colorectum | colon adenocarcinoma | Male | <65 | I/II | Unknown | Unknown | SD |
| SLC39A3 | SNV | Missense_Mutation | rs775552929 | c.370N>A | p.Gly124Arg | p.G124R | Q9BRY0 | protein_coding | deleterious(0.01) | possibly_damaging(0.903) | TCGA-CM-6162-01 | Colorectum | colon adenocarcinoma | Female | <65 | III/IV | Chemotherapy | oxaliplatin | SD |
| SLC39A3 | SNV | Missense_Mutation | rs770897898 | c.434N>T | p.Ala145Val | p.A145V | Q9BRY0 | protein_coding | tolerated(0.21) | benign(0.005) | TCGA-EI-6507-01 | Colorectum | rectum adenocarcinoma | Male | <65 | I/II | Unknown | Unknown | SD |
| SLC39A3 | SNV | Missense_Mutation | novel | c.97G>T | p.Asp33Tyr | p.D33Y | Q9BRY0 | protein_coding | deleterious(0) | probably_damaging(0.979) | TCGA-A5-A0G1-01 | Endometrium | uterine corpus endometrioid carcinoma | Female | >=65 | I/II | Unknown | Unknown | SD |
| SLC39A3 | SNV | Missense_Mutation | rs35127617 | c.116N>A | p.Arg39His | p.R39H | Q9BRY0 | protein_coding | deleterious(0.04) | benign(0.044) | TCGA-AX-A0J1-01 | Endometrium | uterine corpus endometrioid carcinoma | Female | >=65 | I/II | Unknown | Unknown | SD |
| SLC39A3 | SNV | Missense_Mutation | novel | c.40N>T | p.Gly14Cys | p.G14C | Q9BRY0 | protein_coding | deleterious(0) | probably_damaging(0.977) | TCGA-B5-A1MX-01 | Endometrium | uterine corpus endometrioid carcinoma | Female | <65 | I/II | Hormone Therapy | megace | SD |
| SLC39A3 | SNV | Missense_Mutation | novel | c.386N>A | p.Ser129Asn | p.S129N | Q9BRY0 | protein_coding | tolerated(0.12) | probably_damaging(0.986) | TCGA-BG-A222-01 | Endometrium | uterine corpus endometrioid carcinoma | Female | <65 | I/II | Unknown | Unknown | SD |
| SLC39A3 | SNV | Missense_Mutation | rs762866145 | c.232G>A | p.Gly78Ser | p.G78S | Q9BRY0 | protein_coding | tolerated(0.73) | benign(0.01) | TCGA-BS-A0TA-01 | Endometrium | uterine corpus endometrioid carcinoma | Female | <65 | III/IV | Chemotherapy | taxol | PD |
| SLC39A3 | SNV | Missense_Mutation | rs775797366 | c.184N>A | p.Ala62Thr | p.A62T | Q9BRY0 | protein_coding | tolerated(0.09) | probably_damaging(0.978) | TCGA-D1-A103-01 | Endometrium | uterine corpus endometrioid carcinoma | Female | >=65 | I/II | Unknown | Unknown | SD |
| Page: 1 2 3 4 |
Top |
Related drugs of malignant transformation related genes |
| Identification of chemicals and drugs interact with genes involved in malignant transfromation |
| (DGIdb 4.0) |
| Entrez ID | Symbol | Category | Interaction Types | Drug Claim Name | Drug Name | PMIDs |
| Page: 1 |

Copyright 2023-Present -The University of Texas Health Science Center at Houston |