
|
|||||
|
 | |
| |
| |
| |
| |
| |
|
Gene: SLC39A13 |
Gene summary for SLC39A13 |
| Gene information | Species | Human | Gene symbol | SLC39A13 | Gene ID | 91252 |
| Gene name | solute carrier family 39 member 13 | |
| Gene Alias | EDSSPD3 | |
| Cytomap | 11p11.2 | |
| Gene Type | protein-coding | GO ID | GO:0000041 | UniProtAcc | Q96H72 |
Top |
Malignant transformation analysis |
| Identification of the aberrant gene expression in precancerous and cancerous lesions by comparing the gene expression of stem-like cells in diseased tissues with normal stem cells |
| Entrez ID | Symbol | Replicates | Species | Organ | Tissue | Adj P-value | Log2FC | Malignancy |
| 91252 | SLC39A13 | LZE4T | Human | Esophagus | ESCC | 1.68e-04 | 3.35e-02 | 0.0811 |
| 91252 | SLC39A13 | LZE7T | Human | Esophagus | ESCC | 2.65e-02 | 5.22e-02 | 0.0667 |
| 91252 | SLC39A13 | LZE8T | Human | Esophagus | ESCC | 5.47e-03 | 2.24e-02 | 0.067 |
| 91252 | SLC39A13 | LZE24T | Human | Esophagus | ESCC | 7.12e-15 | 1.65e-01 | 0.0596 |
| 91252 | SLC39A13 | P2T-E | Human | Esophagus | ESCC | 1.32e-25 | 2.04e-01 | 0.1177 |
| 91252 | SLC39A13 | P4T-E | Human | Esophagus | ESCC | 7.85e-05 | 2.53e-01 | 0.1323 |
| 91252 | SLC39A13 | P8T-E | Human | Esophagus | ESCC | 1.98e-18 | 2.20e-01 | 0.0889 |
| 91252 | SLC39A13 | P9T-E | Human | Esophagus | ESCC | 1.85e-11 | 1.40e-01 | 0.1131 |
| 91252 | SLC39A13 | P10T-E | Human | Esophagus | ESCC | 7.48e-13 | 2.06e-01 | 0.116 |
| 91252 | SLC39A13 | P11T-E | Human | Esophagus | ESCC | 1.04e-11 | 6.60e-01 | 0.1426 |
| 91252 | SLC39A13 | P12T-E | Human | Esophagus | ESCC | 7.50e-16 | 1.80e-01 | 0.1122 |
| 91252 | SLC39A13 | P15T-E | Human | Esophagus | ESCC | 3.54e-09 | 1.92e-01 | 0.1149 |
| 91252 | SLC39A13 | P16T-E | Human | Esophagus | ESCC | 2.05e-18 | 1.45e-01 | 0.1153 |
| 91252 | SLC39A13 | P17T-E | Human | Esophagus | ESCC | 2.69e-05 | 4.60e-01 | 0.1278 |
| 91252 | SLC39A13 | P19T-E | Human | Esophagus | ESCC | 1.65e-09 | 7.48e-01 | 0.1662 |
| 91252 | SLC39A13 | P20T-E | Human | Esophagus | ESCC | 9.66e-14 | 2.76e-01 | 0.1124 |
| 91252 | SLC39A13 | P21T-E | Human | Esophagus | ESCC | 9.58e-22 | 3.46e-01 | 0.1617 |
| 91252 | SLC39A13 | P22T-E | Human | Esophagus | ESCC | 4.43e-16 | 1.70e-01 | 0.1236 |
| 91252 | SLC39A13 | P23T-E | Human | Esophagus | ESCC | 1.13e-06 | 1.76e-01 | 0.108 |
| 91252 | SLC39A13 | P24T-E | Human | Esophagus | ESCC | 1.71e-17 | 2.27e-01 | 0.1287 |
| Page: 1 2 3 4 5 6 |
| Tissue | Expression Dynamics | Abbreviation |
| Esophagus | 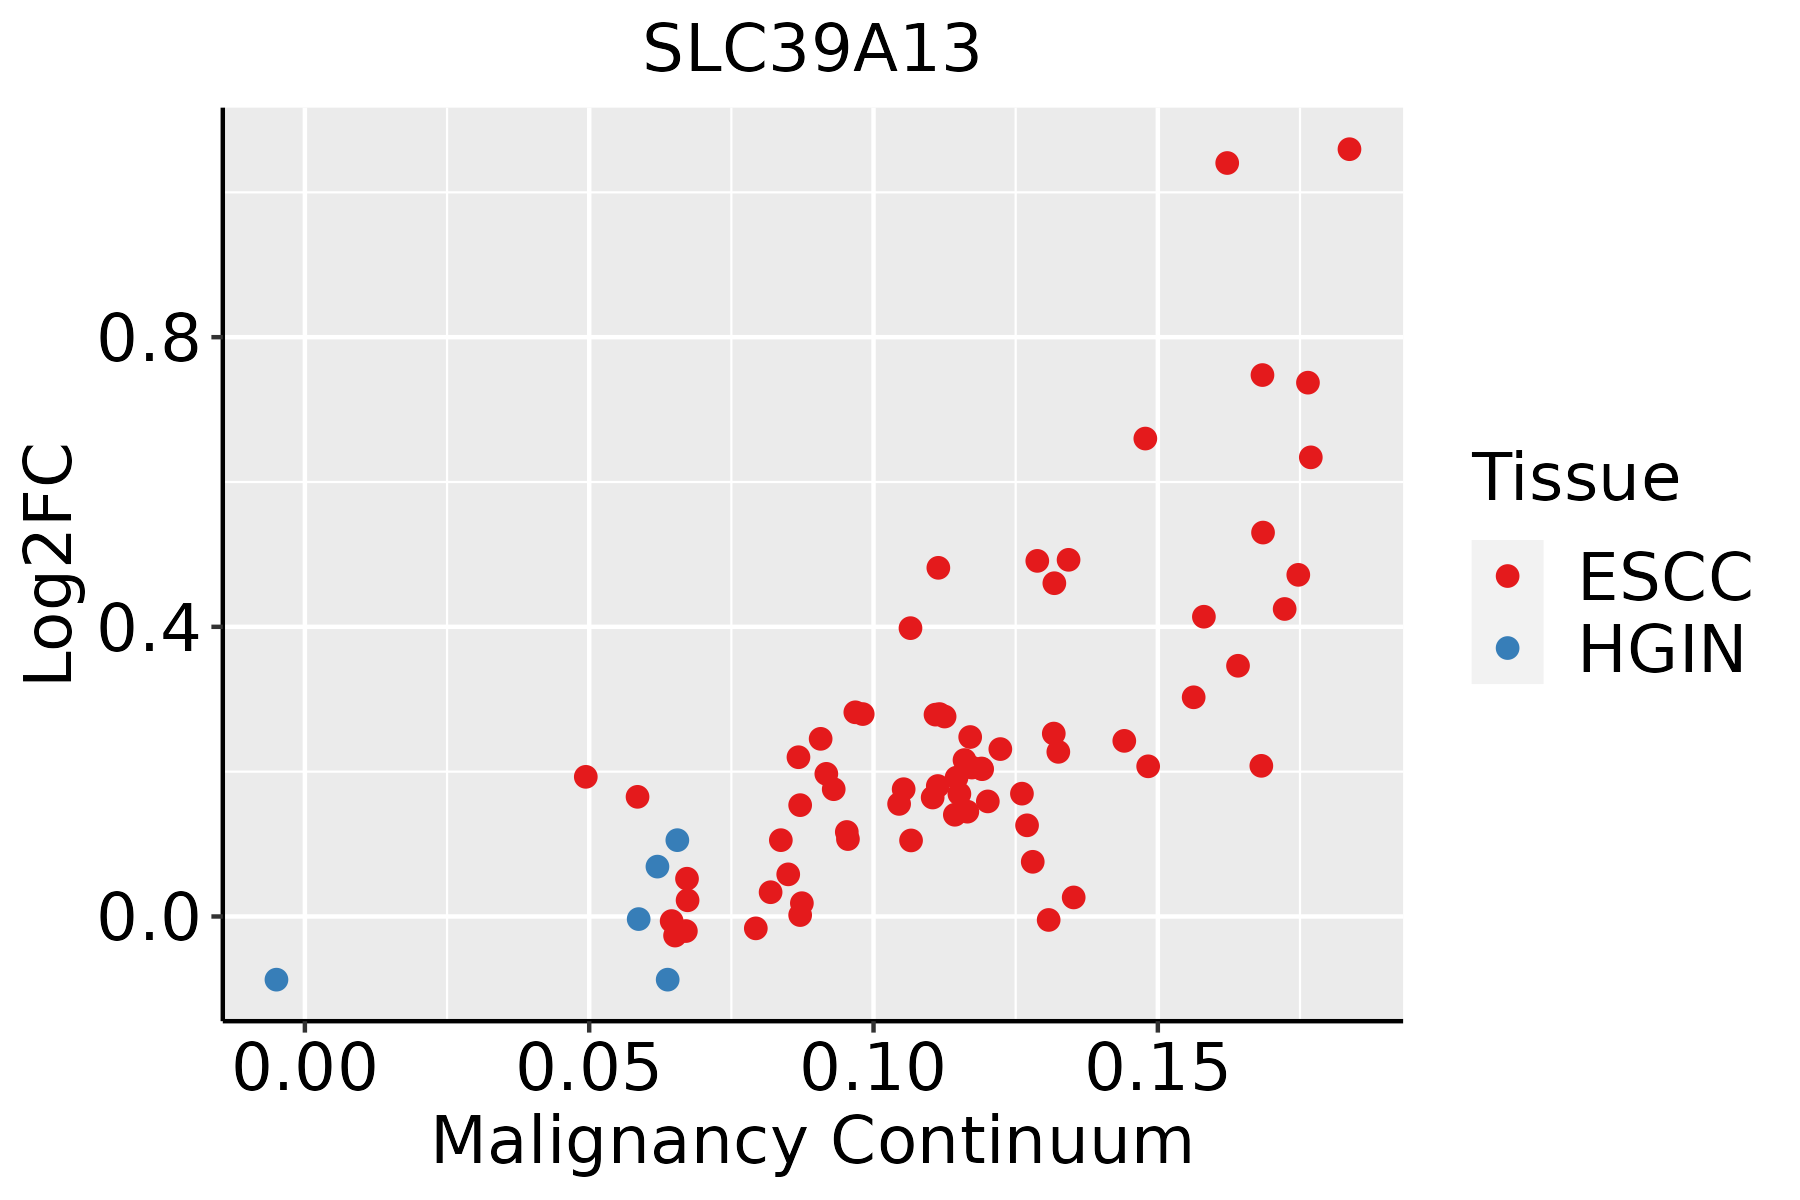 | ESCC: Esophageal squamous cell carcinoma |
| HGIN: High-grade intraepithelial neoplasias | ||
| LGIN: Low-grade intraepithelial neoplasias | ||
| Liver | 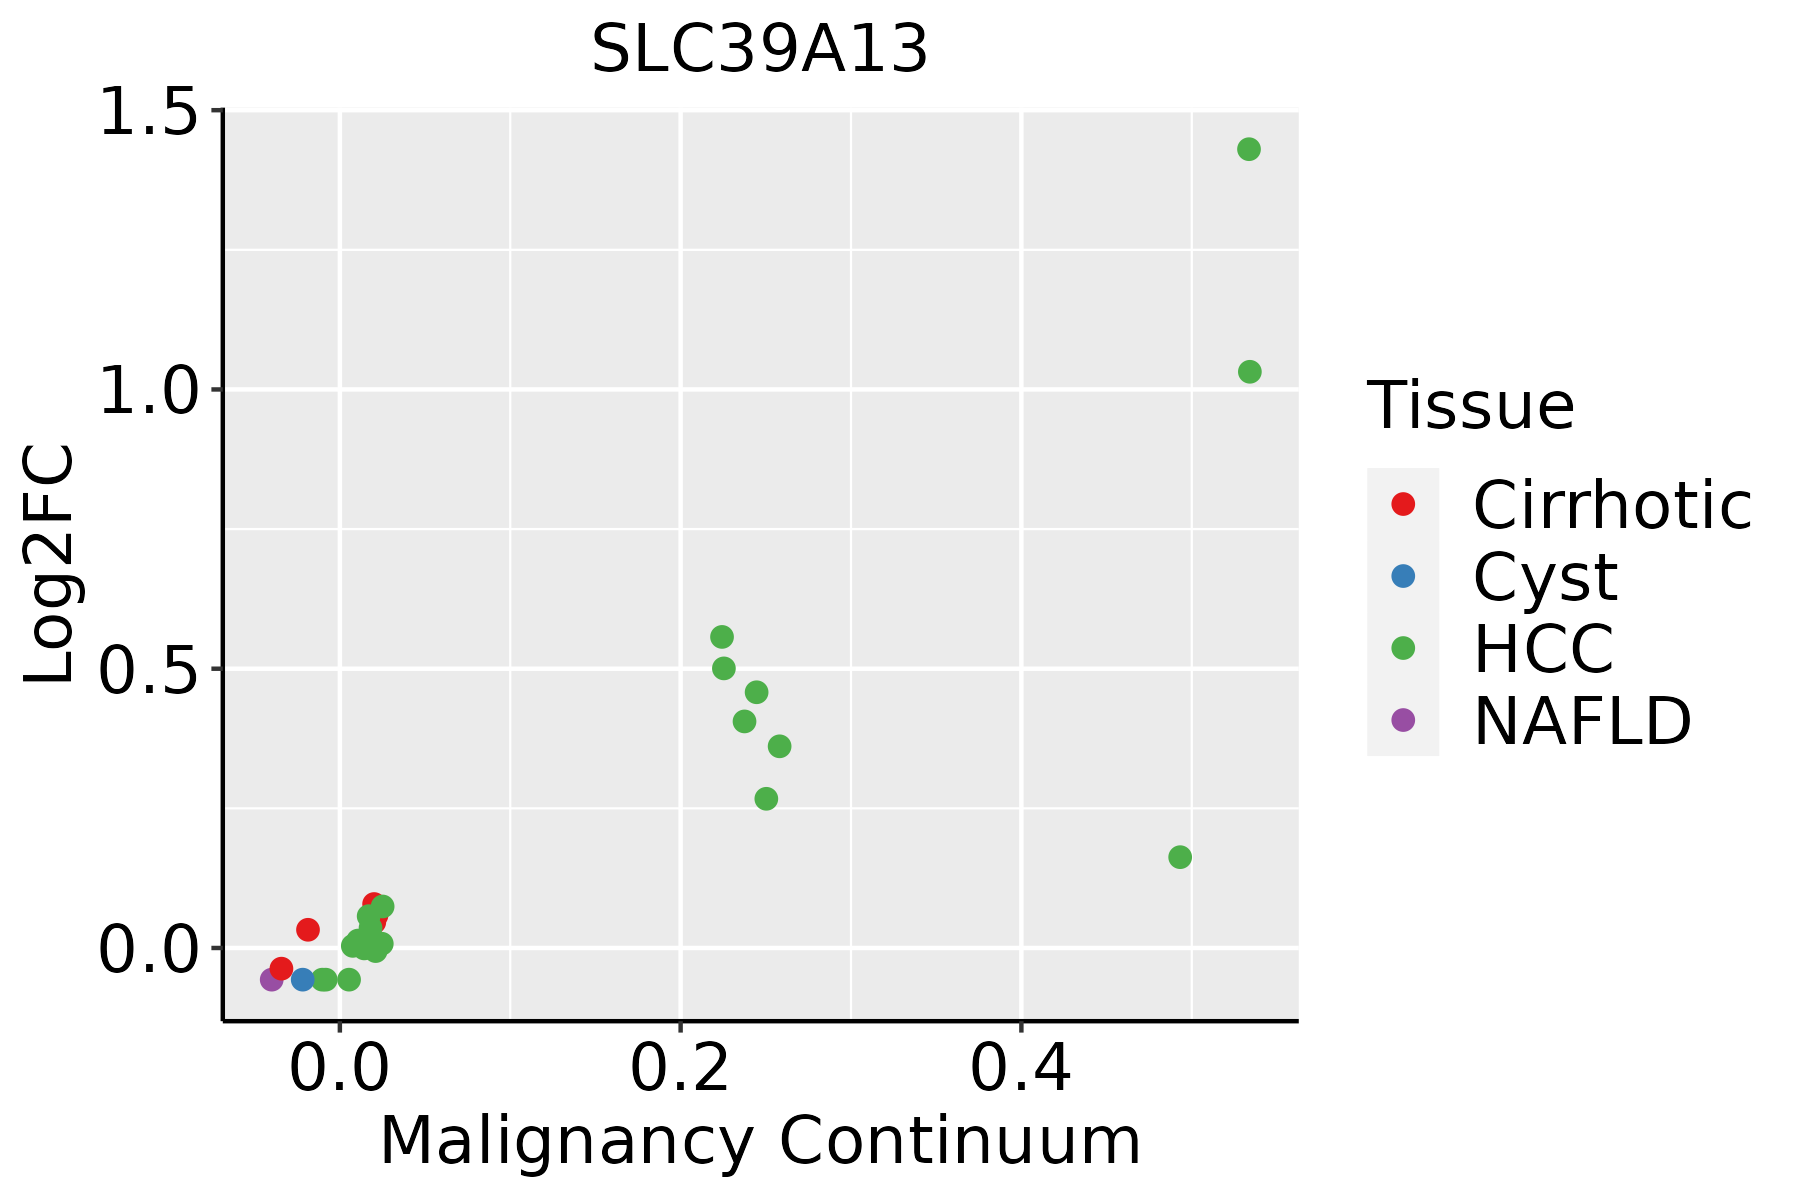 | HCC: Hepatocellular carcinoma |
| NAFLD: Non-alcoholic fatty liver disease | ||
| Oral Cavity | 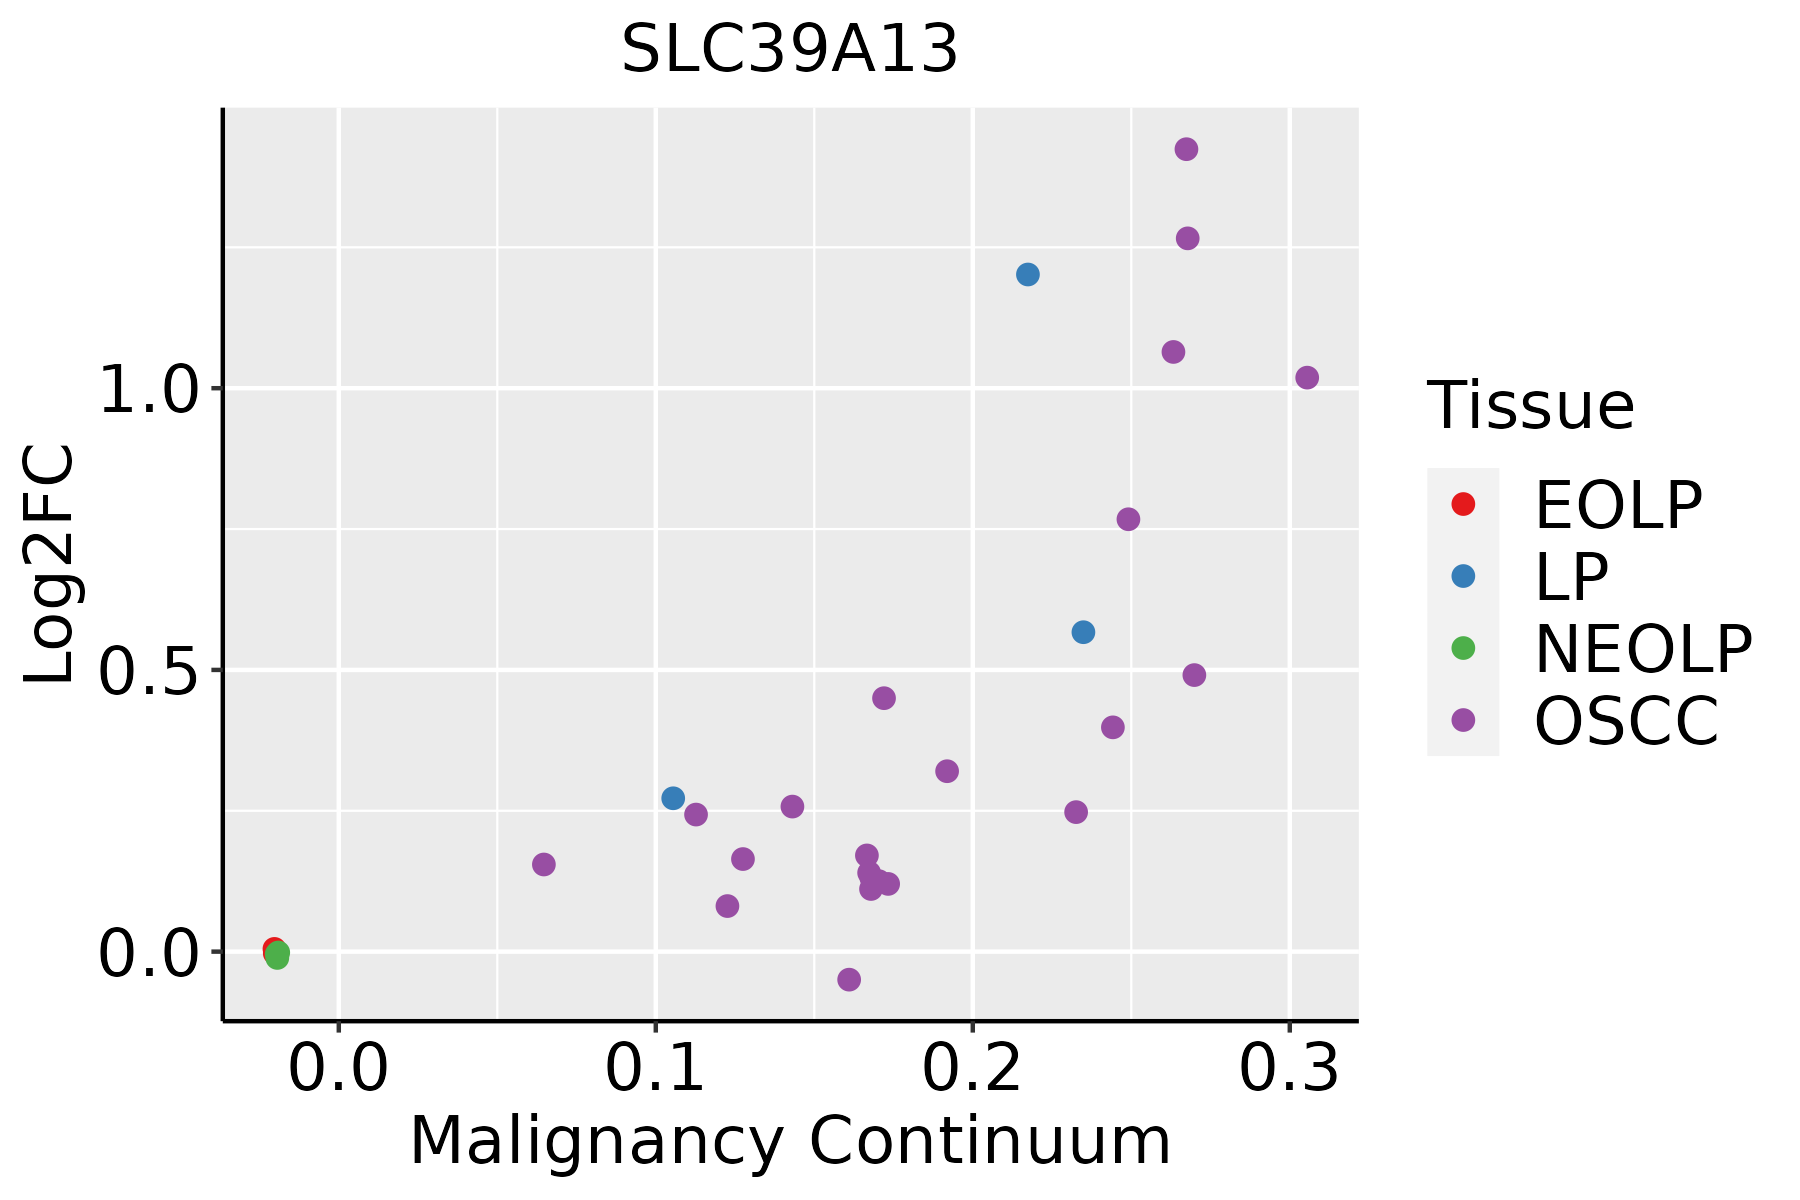 | EOLP: Erosive Oral lichen planus |
| LP: leukoplakia | ||
| NEOLP: Non-erosive oral lichen planus | ||
| OSCC: Oral squamous cell carcinoma | ||
| Skin | 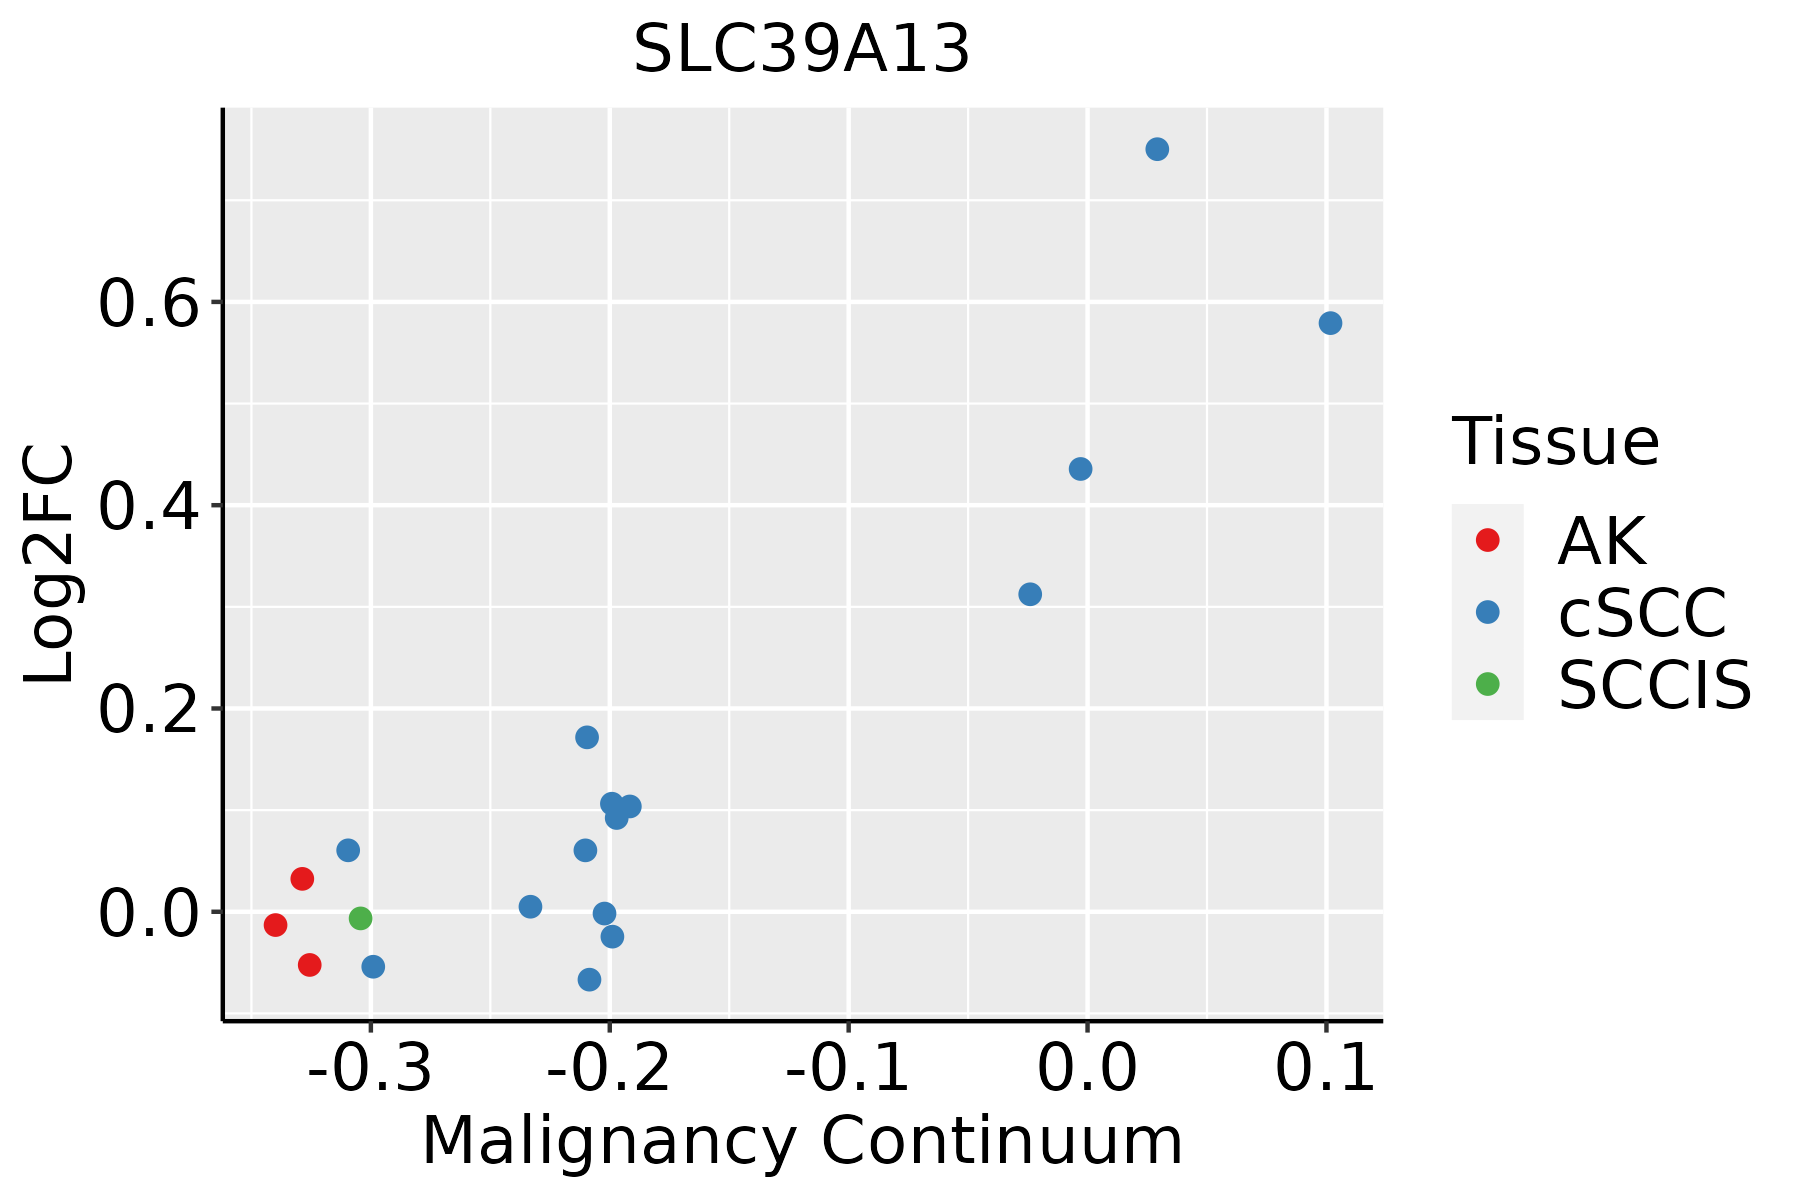 | AK: Actinic keratosis |
| cSCC: Cutaneous squamous cell carcinoma | ||
| SCCIS:squamous cell carcinoma in situ | ||
| Thyroid | 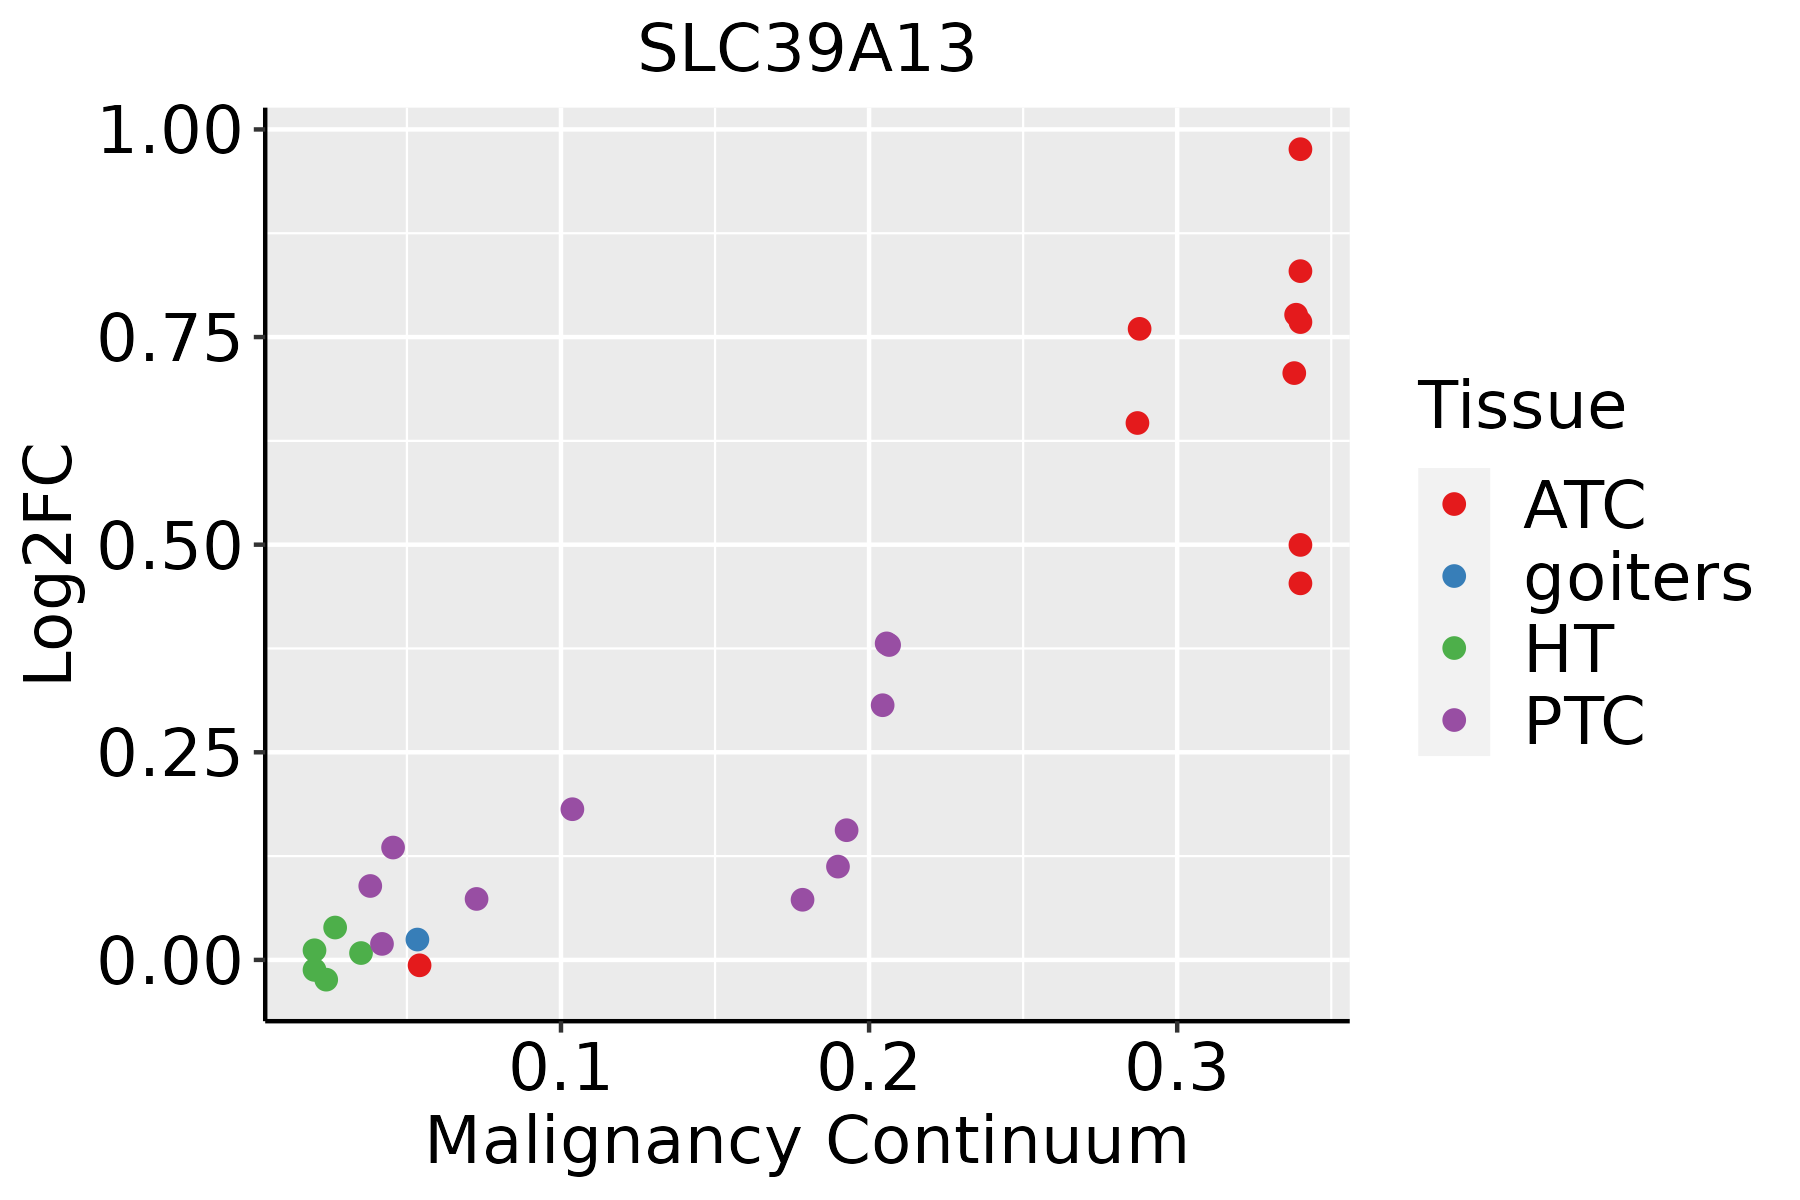 | ATC: Anaplastic thyroid cancer |
| HT: Hashimoto's thyroiditis | ||
| PTC: Papillary thyroid cancer |
| ∗log2FC in expression of this searched gene in stem-like cells from each diseased tissue sample relative to stem-like cells in normal samples in each tissue plotted against the malignancy continuum. Samples are colored based on if they are from different disease stage. |
Top |
Malignant transformation related pathway analysis |
| Find out the enriched GO biological processes and KEGG pathways involved in transition from healthy to precancer to cancer |
| Tissue | Disease Stage | Enriched GO biological Processes |
| Colorectum | AD |  |
| Colorectum | SER |  |
| Colorectum | MSS |  |
| Colorectum | MSI-H |  |
| Colorectum | FAP |  |
| ∗Top 15 enriched GO BP terms are showed in the bar plot of each disease state in each tissue. Each row represents a significant GO biological process which is colored according to the -log10(p.adjust). |
| Page: 1 2 3 4 5 6 7 8 9 |
| GO ID | Tissue | Disease Stage | Description | Gene Ratio | Bg Ratio | pvalue | p.adjust | Count |
| GO:005507617 | Esophagus | ESCC | transition metal ion homeostasis | 87/8552 | 138/18723 | 2.85e-05 | 2.37e-04 | 87 |
| GO:001003827 | Esophagus | ESCC | response to metal ion | 208/8552 | 373/18723 | 5.02e-05 | 3.90e-04 | 208 |
| GO:00469169 | Esophagus | ESCC | cellular transition metal ion homeostasis | 70/8552 | 115/18723 | 7.28e-04 | 3.79e-03 | 70 |
| GO:001003812 | Liver | Cirrhotic | response to metal ion | 150/4634 | 373/18723 | 2.27e-11 | 1.37e-09 | 150 |
| GO:00550766 | Liver | Cirrhotic | transition metal ion homeostasis | 59/4634 | 138/18723 | 2.59e-06 | 4.65e-05 | 59 |
| GO:00469164 | Liver | Cirrhotic | cellular transition metal ion homeostasis | 48/4634 | 115/18723 | 4.51e-05 | 5.30e-04 | 48 |
| GO:00068823 | Liver | Cirrhotic | cellular zinc ion homeostasis | 17/4634 | 38/18723 | 5.62e-03 | 2.84e-02 | 17 |
| GO:00550693 | Liver | Cirrhotic | zinc ion homeostasis | 17/4634 | 40/18723 | 1.04e-02 | 4.61e-02 | 17 |
| GO:001003822 | Liver | HCC | response to metal ion | 208/7958 | 373/18723 | 1.35e-07 | 2.56e-06 | 208 |
| GO:005507612 | Liver | HCC | transition metal ion homeostasis | 81/7958 | 138/18723 | 8.87e-05 | 7.72e-04 | 81 |
| GO:004691611 | Liver | HCC | cellular transition metal ion homeostasis | 67/7958 | 115/18723 | 4.64e-04 | 3.08e-03 | 67 |
| GO:00000411 | Liver | HCC | transition metal ion transport | 59/7958 | 105/18723 | 3.18e-03 | 1.47e-02 | 59 |
| GO:000688212 | Liver | HCC | cellular zinc ion homeostasis | 24/7958 | 38/18723 | 8.20e-03 | 3.22e-02 | 24 |
| GO:005507610 | Oral cavity | OSCC | transition metal ion homeostasis | 81/7305 | 138/18723 | 2.13e-06 | 2.72e-05 | 81 |
| GO:001003820 | Oral cavity | OSCC | response to metal ion | 188/7305 | 373/18723 | 4.34e-06 | 5.00e-05 | 188 |
| GO:00469168 | Oral cavity | OSCC | cellular transition metal ion homeostasis | 64/7305 | 115/18723 | 2.13e-04 | 1.40e-03 | 64 |
| GO:00550695 | Oral cavity | OSCC | zinc ion homeostasis | 24/7305 | 40/18723 | 5.76e-03 | 2.22e-02 | 24 |
| GO:00068825 | Oral cavity | OSCC | cellular zinc ion homeostasis | 23/7305 | 38/18723 | 5.87e-03 | 2.24e-02 | 23 |
| GO:0010038110 | Oral cavity | LP | response to metal ion | 124/4623 | 373/18723 | 1.09e-04 | 1.31e-03 | 124 |
| GO:005507616 | Oral cavity | LP | transition metal ion homeostasis | 54/4623 | 138/18723 | 1.19e-04 | 1.40e-03 | 54 |
| Page: 1 2 |
| Pathway ID | Tissue | Disease Stage | Description | Gene Ratio | Bg Ratio | pvalue | p.adjust | qvalue | Count |
| hsa05012211 | Esophagus | ESCC | Parkinson disease | 201/4205 | 266/8465 | 1.56e-18 | 8.72e-17 | 4.46e-17 | 201 |
| hsa05010210 | Esophagus | ESCC | Alzheimer disease | 263/4205 | 384/8465 | 1.80e-14 | 5.47e-13 | 2.80e-13 | 263 |
| hsa05012310 | Esophagus | ESCC | Parkinson disease | 201/4205 | 266/8465 | 1.56e-18 | 8.72e-17 | 4.46e-17 | 201 |
| hsa0501038 | Esophagus | ESCC | Alzheimer disease | 263/4205 | 384/8465 | 1.80e-14 | 5.47e-13 | 2.80e-13 | 263 |
| hsa0501214 | Liver | Cirrhotic | Parkinson disease | 158/2530 | 266/8465 | 3.62e-24 | 6.02e-22 | 3.71e-22 | 158 |
| hsa0501014 | Liver | Cirrhotic | Alzheimer disease | 180/2530 | 384/8465 | 5.52e-13 | 1.36e-11 | 8.36e-12 | 180 |
| hsa0501215 | Liver | Cirrhotic | Parkinson disease | 158/2530 | 266/8465 | 3.62e-24 | 6.02e-22 | 3.71e-22 | 158 |
| hsa0501015 | Liver | Cirrhotic | Alzheimer disease | 180/2530 | 384/8465 | 5.52e-13 | 1.36e-11 | 8.36e-12 | 180 |
| hsa0501222 | Liver | HCC | Parkinson disease | 198/4020 | 266/8465 | 9.40e-20 | 1.58e-17 | 8.76e-18 | 198 |
| hsa0501022 | Liver | HCC | Alzheimer disease | 254/4020 | 384/8465 | 3.75e-14 | 8.97e-13 | 4.99e-13 | 254 |
| hsa0501232 | Liver | HCC | Parkinson disease | 198/4020 | 266/8465 | 9.40e-20 | 1.58e-17 | 8.76e-18 | 198 |
| hsa0501032 | Liver | HCC | Alzheimer disease | 254/4020 | 384/8465 | 3.75e-14 | 8.97e-13 | 4.99e-13 | 254 |
| hsa0501230 | Oral cavity | OSCC | Parkinson disease | 188/3704 | 266/8465 | 1.82e-19 | 1.52e-17 | 7.75e-18 | 188 |
| hsa0501028 | Oral cavity | OSCC | Alzheimer disease | 244/3704 | 384/8465 | 1.18e-15 | 3.60e-14 | 1.83e-14 | 244 |
| hsa05012113 | Oral cavity | OSCC | Parkinson disease | 188/3704 | 266/8465 | 1.82e-19 | 1.52e-17 | 7.75e-18 | 188 |
| hsa05010112 | Oral cavity | OSCC | Alzheimer disease | 244/3704 | 384/8465 | 1.18e-15 | 3.60e-14 | 1.83e-14 | 244 |
| hsa05012210 | Oral cavity | LP | Parkinson disease | 166/2418 | 266/8465 | 2.02e-31 | 3.36e-29 | 2.17e-29 | 166 |
| hsa0501029 | Oral cavity | LP | Alzheimer disease | 197/2418 | 384/8465 | 6.66e-22 | 3.69e-20 | 2.38e-20 | 197 |
| hsa0501238 | Oral cavity | LP | Parkinson disease | 166/2418 | 266/8465 | 2.02e-31 | 3.36e-29 | 2.17e-29 | 166 |
| hsa0501037 | Oral cavity | LP | Alzheimer disease | 197/2418 | 384/8465 | 6.66e-22 | 3.69e-20 | 2.38e-20 | 197 |
| Page: 1 |
Top |
Cell-cell communication analysis |
| Identification of potential cell-cell interactions between two cell types and their ligand-receptor pairs for different disease states |
| Ligand | Receptor | LRpair | Pathway | Tissue | Disease Stage |
| Page: 1 |
Top |
Single-cell gene regulatory network inference analysis |
| Find out the significant the regulons (TFs) and the target genes of each regulon across cell types for different disease states |
| TF | Cell Type | Tissue | Disease Stage | Target Gene | RSS | Regulon Activity |
| ∗The dot plots of a searched regulon are shown for all cell subpopulations in each disease state of each tissue based on the regulon specific score inferred using pySCENIC and by calculating the average expression. |
| Page: 1 |
Top |
Somatic mutation of malignant transformation related genes |
| Annotation of somatic variants for genes involved in malignant transformation |
| Hugo Symbol | Variant Class | Variant Classification | dbSNP RS | HGVSc | HGVSp | HGVSp Short | SWISSPROT | BIOTYPE | SIFT | PolyPhen | Tumor Sample Barcode | Tissue | Histology | Sex | Age | Stage | Therapy Types | Drugs | Outcome |
| SLC39A13 | SNV | Missense_Mutation | c.965N>G | p.Pro322Arg | p.P322R | Q96H72 | protein_coding | deleterious(0) | probably_damaging(1) | TCGA-BH-A1EV-01 | Breast | breast invasive carcinoma | Female | <65 | III/IV | Unknown | Unknown | PD | |
| SLC39A13 | SNV | Missense_Mutation | c.1043N>T | p.Arg348Leu | p.R348L | Q96H72 | protein_coding | tolerated(0.27) | benign(0.009) | TCGA-BH-A8G0-01 | Breast | breast invasive carcinoma | Female | <65 | I/II | Chemotherapy | taxotere | CR | |
| SLC39A13 | SNV | Missense_Mutation | rs777112793 | c.1100N>T | p.Ser367Leu | p.S367L | Q96H72 | protein_coding | deleterious(0) | possibly_damaging(0.745) | TCGA-GM-A2D9-01 | Breast | breast invasive carcinoma | Female | >=65 | I/II | Hormone Therapy | arimidex | SD |
| SLC39A13 | insertion | Frame_Shift_Ins | novel | c.538_539insC | p.Asn182GlnfsTer48 | p.N182Qfs*48 | Q96H72 | protein_coding | TCGA-A2-A0CO-01 | Breast | breast invasive carcinoma | Female | >=65 | I/II | Hormone Therapy | tamoxiphen | CR | ||
| SLC39A13 | deletion | Frame_Shift_Del | novel | c.990delN | p.Tyr330Ter | p.Y330* | Q96H72 | protein_coding | TCGA-D8-A27V-01 | Breast | breast invasive carcinoma | Female | <65 | I/II | Hormone Therapy | tamoxiphen | SD | ||
| SLC39A13 | SNV | Missense_Mutation | c.695N>G | p.His232Arg | p.H232R | Q96H72 | protein_coding | deleterious(0) | probably_damaging(0.999) | TCGA-A6-6780-01 | Colorectum | colon adenocarcinoma | Male | >=65 | I/II | Unknown | Unknown | SD | |
| SLC39A13 | SNV | Missense_Mutation | novel | c.1007N>C | p.Val336Ala | p.V336A | Q96H72 | protein_coding | deleterious(0) | probably_damaging(0.983) | TCGA-CK-5913-01 | Colorectum | colon adenocarcinoma | Female | <65 | I/II | Unknown | Unknown | SD |
| SLC39A13 | SNV | Missense_Mutation | novel | c.1057N>G | p.Leu353Val | p.L353V | Q96H72 | protein_coding | tolerated(1) | benign(0.006) | TCGA-AG-A00Y-01 | Colorectum | rectum adenocarcinoma | Male | >=65 | I/II | Unknown | Unknown | PD |
| SLC39A13 | SNV | Missense_Mutation | rs369854018 | c.292C>T | p.Arg98Cys | p.R98C | Q96H72 | protein_coding | tolerated(0.06) | benign(0.056) | TCGA-EI-6507-01 | Colorectum | rectum adenocarcinoma | Male | <65 | I/II | Unknown | Unknown | SD |
| SLC39A13 | SNV | Missense_Mutation | c.947N>T | p.Thr316Met | p.T316M | Q96H72 | protein_coding | deleterious(0.01) | probably_damaging(0.97) | TCGA-EI-6882-01 | Colorectum | rectum adenocarcinoma | Male | <65 | I/II | Unknown | Unknown | SD |
| Page: 1 2 3 |
Top |
Related drugs of malignant transformation related genes |
| Identification of chemicals and drugs interact with genes involved in malignant transfromation |
| (DGIdb 4.0) |
| Entrez ID | Symbol | Category | Interaction Types | Drug Claim Name | Drug Name | PMIDs |
| Page: 1 |

Copyright 2023-Present -The University of Texas Health Science Center at Houston |