
|
|||||
|
 | |
| |
| |
| |
| |
| |
|
Gene: SLC39A11 |
Gene summary for SLC39A11 |
| Gene information | Species | Human | Gene symbol | SLC39A11 | Gene ID | 201266 |
| Gene name | solute carrier family 39 member 11 | |
| Gene Alias | C17orf26 | |
| Cytomap | 17q24.3-q25.1 | |
| Gene Type | protein-coding | GO ID | GO:0000041 | UniProtAcc | Q8N1S5 |
Top |
Malignant transformation analysis |
| Identification of the aberrant gene expression in precancerous and cancerous lesions by comparing the gene expression of stem-like cells in diseased tissues with normal stem cells |
| Entrez ID | Symbol | Replicates | Species | Organ | Tissue | Adj P-value | Log2FC | Malignancy |
| 201266 | SLC39A11 | HTA11_3410_2000001011 | Human | Colorectum | AD | 7.40e-04 | -4.12e-01 | 0.0155 |
| 201266 | SLC39A11 | HTA11_347_2000001011 | Human | Colorectum | AD | 3.10e-13 | 6.98e-01 | -0.1954 |
| 201266 | SLC39A11 | HTA11_2112_2000001011 | Human | Colorectum | SER | 2.79e-03 | 6.34e-01 | -0.2196 |
| 201266 | SLC39A11 | HTA11_5212_2000001011 | Human | Colorectum | AD | 4.17e-02 | -4.97e-01 | -0.2061 |
| 201266 | SLC39A11 | HTA11_99999965104_69814 | Human | Colorectum | MSS | 2.42e-08 | 7.14e-01 | 0.281 |
| 201266 | SLC39A11 | A002-C-010 | Human | Colorectum | FAP | 4.37e-04 | -1.93e-01 | 0.242 |
| 201266 | SLC39A11 | A001-C-207 | Human | Colorectum | FAP | 3.46e-03 | -1.82e-01 | 0.1278 |
| 201266 | SLC39A11 | A015-C-203 | Human | Colorectum | FAP | 1.61e-23 | -4.56e-01 | -0.1294 |
| 201266 | SLC39A11 | A015-C-204 | Human | Colorectum | FAP | 5.97e-05 | -1.92e-01 | -0.0228 |
| 201266 | SLC39A11 | A014-C-040 | Human | Colorectum | FAP | 3.60e-05 | -4.98e-01 | -0.1184 |
| 201266 | SLC39A11 | A002-C-201 | Human | Colorectum | FAP | 3.33e-16 | -4.52e-01 | 0.0324 |
| 201266 | SLC39A11 | A002-C-203 | Human | Colorectum | FAP | 3.32e-02 | -1.78e-01 | 0.2786 |
| 201266 | SLC39A11 | A001-C-119 | Human | Colorectum | FAP | 3.59e-07 | -3.99e-01 | -0.1557 |
| 201266 | SLC39A11 | A001-C-108 | Human | Colorectum | FAP | 3.04e-13 | -3.29e-01 | -0.0272 |
| 201266 | SLC39A11 | A002-C-205 | Human | Colorectum | FAP | 6.72e-26 | -5.47e-01 | -0.1236 |
| 201266 | SLC39A11 | A001-C-104 | Human | Colorectum | FAP | 6.84e-03 | -2.42e-01 | 0.0184 |
| 201266 | SLC39A11 | A015-C-005 | Human | Colorectum | FAP | 3.77e-02 | -8.81e-02 | -0.0336 |
| 201266 | SLC39A11 | A015-C-006 | Human | Colorectum | FAP | 2.62e-16 | -3.63e-01 | -0.0994 |
| 201266 | SLC39A11 | A015-C-106 | Human | Colorectum | FAP | 1.69e-10 | -2.42e-01 | -0.0511 |
| 201266 | SLC39A11 | A002-C-114 | Human | Colorectum | FAP | 7.25e-21 | -5.36e-01 | -0.1561 |
| Page: 1 2 3 4 5 6 7 8 9 |
| Tissue | Expression Dynamics | Abbreviation |
| Colorectum (GSE201348) |  | FAP: Familial adenomatous polyposis |
| CRC: Colorectal cancer | ||
| Colorectum (HTA11) |  | AD: Adenomas |
| SER: Sessile serrated lesions | ||
| MSI-H: Microsatellite-high colorectal cancer | ||
| MSS: Microsatellite stable colorectal cancer | ||
| Endometrium |  | AEH: Atypical endometrial hyperplasia |
| EEC: Endometrioid Cancer | ||
| Esophagus | 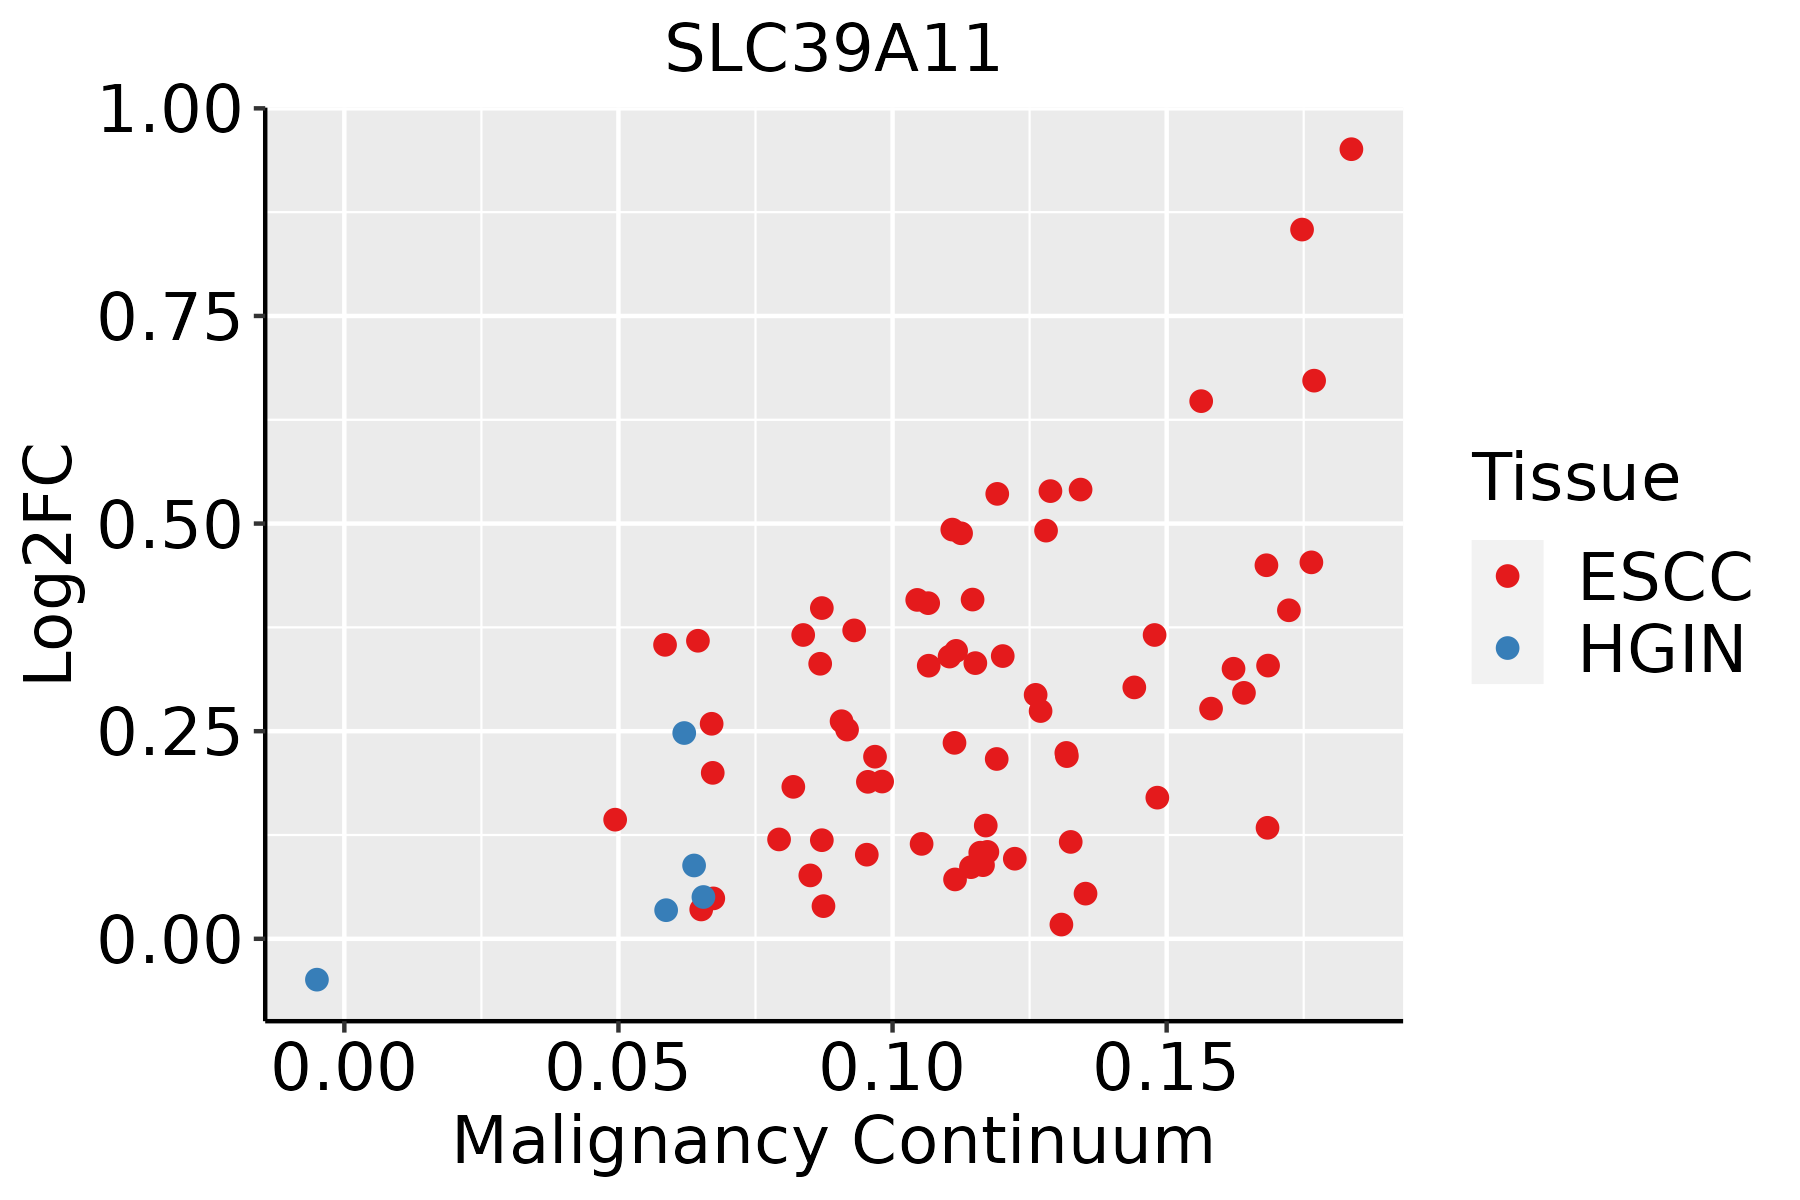 | ESCC: Esophageal squamous cell carcinoma |
| HGIN: High-grade intraepithelial neoplasias | ||
| LGIN: Low-grade intraepithelial neoplasias | ||
| GC |  | CAG: Chronic atrophic gastritis |
| CAG with IM: Chronic atrophic gastritis with intestinal metaplasia | ||
| CSG: Chronic superficial gastritis | ||
| GC: Gastric cancer | ||
| SIM: Severe intestinal metaplasia | ||
| WIM: Wild intestinal metaplasia | ||
| Liver |  | HCC: Hepatocellular carcinoma |
| NAFLD: Non-alcoholic fatty liver disease | ||
| Lung |  | AAH: Atypical adenomatous hyperplasia |
| AIS: Adenocarcinoma in situ | ||
| IAC: Invasive lung adenocarcinoma | ||
| MIA: Minimally invasive adenocarcinoma | ||
| Oral Cavity | 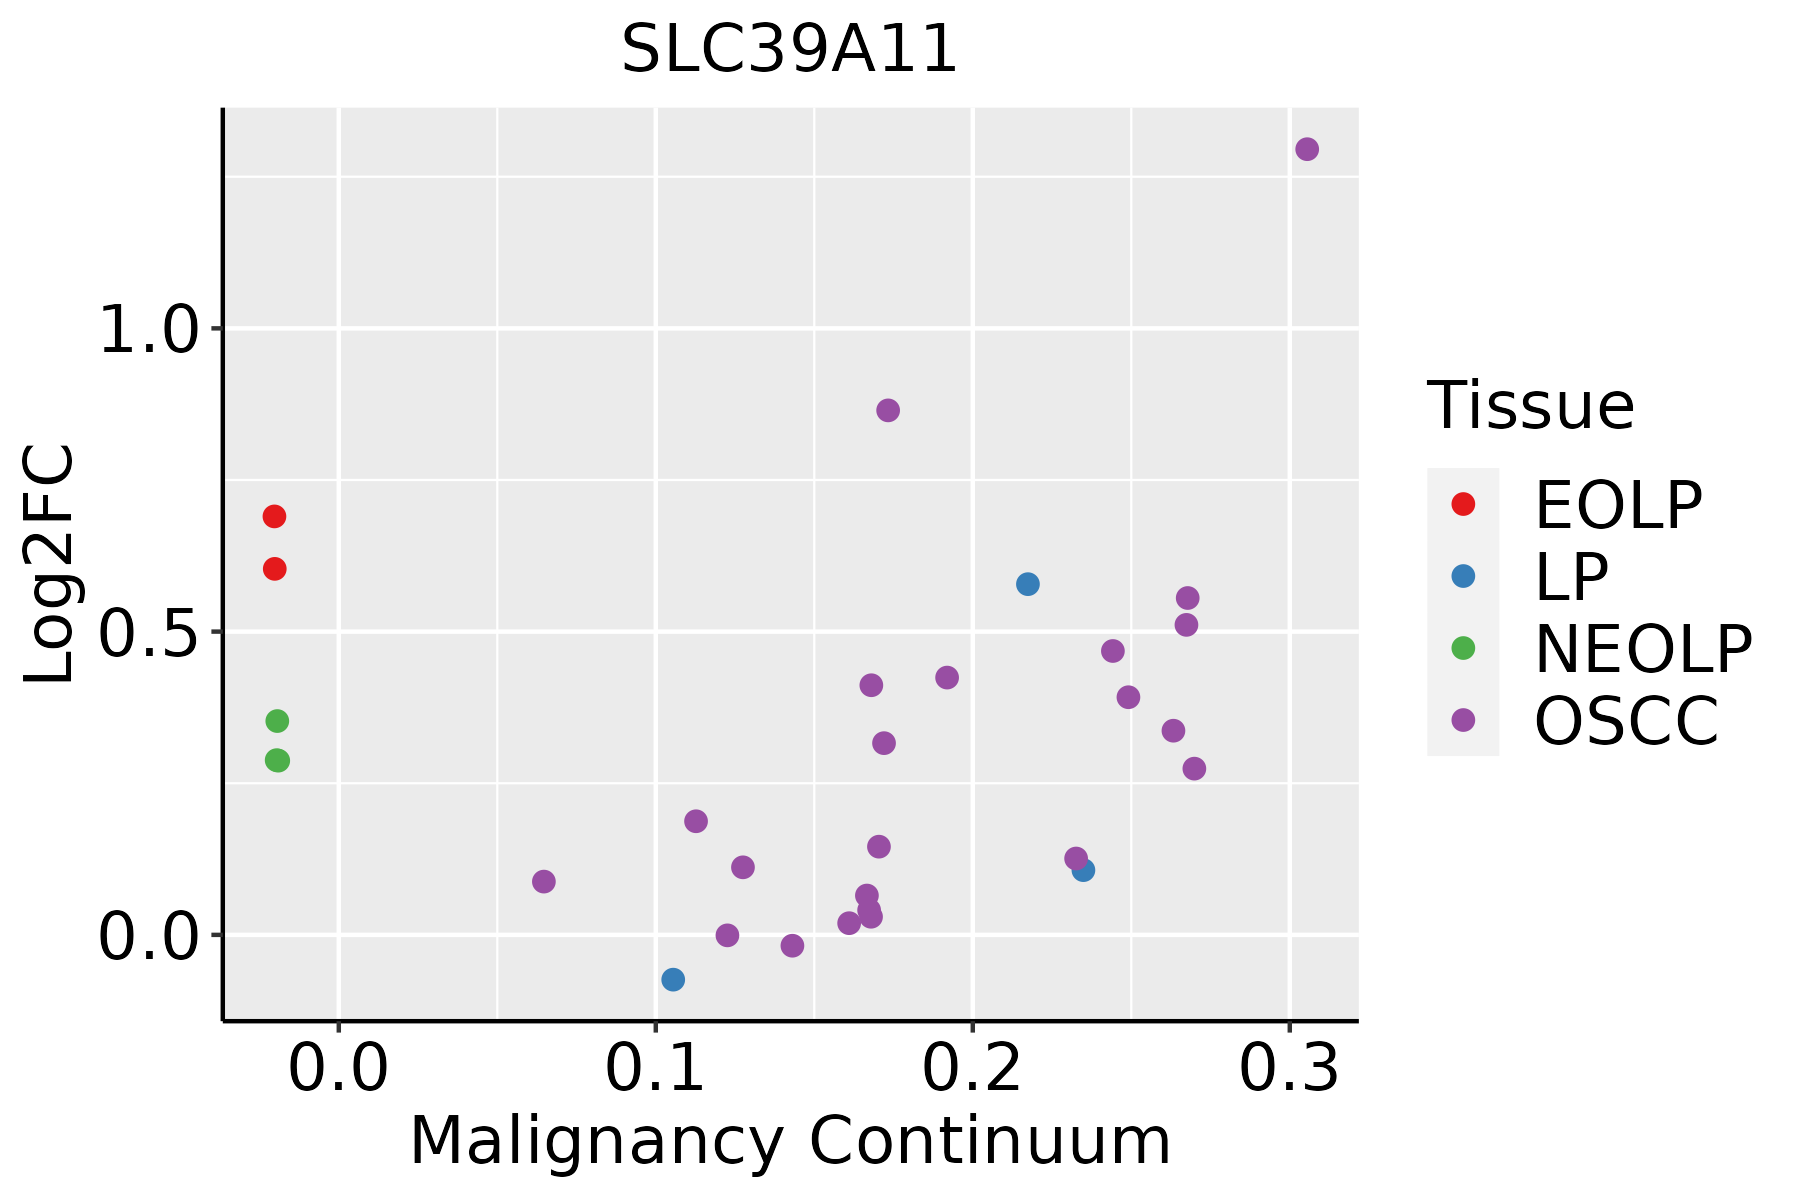 | EOLP: Erosive Oral lichen planus |
| LP: leukoplakia | ||
| NEOLP: Non-erosive oral lichen planus | ||
| OSCC: Oral squamous cell carcinoma | ||
| Skin | 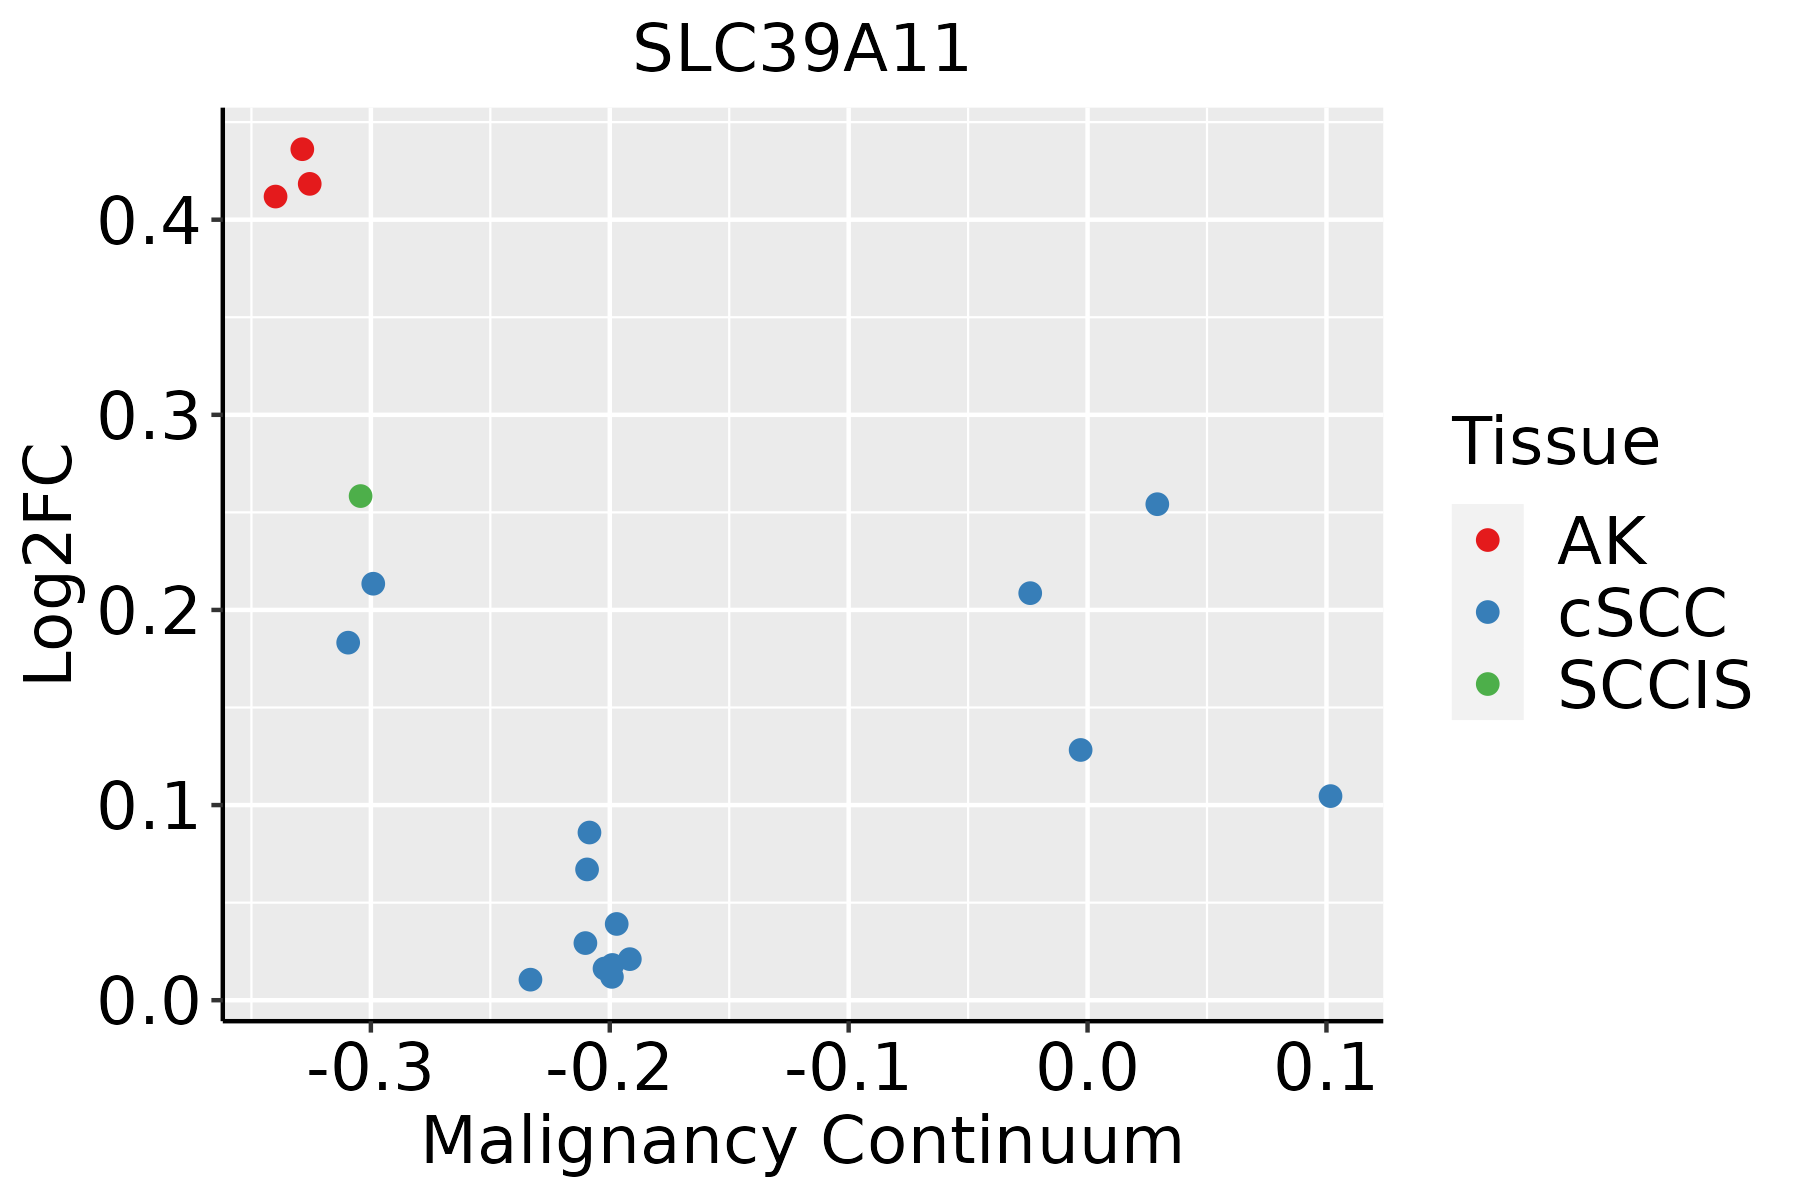 | AK: Actinic keratosis |
| cSCC: Cutaneous squamous cell carcinoma | ||
| SCCIS:squamous cell carcinoma in situ |
| ∗log2FC in expression of this searched gene in stem-like cells from each diseased tissue sample relative to stem-like cells in normal samples in each tissue plotted against the malignancy continuum. Samples are colored based on if they are from different disease stage. |
Top |
Malignant transformation related pathway analysis |
| Find out the enriched GO biological processes and KEGG pathways involved in transition from healthy to precancer to cancer |
| Tissue | Disease Stage | Enriched GO biological Processes |
| Colorectum | AD |  |
| Colorectum | SER |  |
| Colorectum | MSS |  |
| Colorectum | MSI-H |  |
| Colorectum | FAP |  |
| ∗Top 15 enriched GO BP terms are showed in the bar plot of each disease state in each tissue. Each row represents a significant GO biological process which is colored according to the -log10(p.adjust). |
| Page: 1 2 3 4 5 6 7 8 9 |
| GO ID | Tissue | Disease Stage | Description | Gene Ratio | Bg Ratio | pvalue | p.adjust | Count |
| GO:00000411 | Liver | HCC | transition metal ion transport | 59/7958 | 105/18723 | 3.18e-03 | 1.47e-02 | 59 |
| GO:0000041 | Stomach | GC | transition metal ion transport | 15/1159 | 105/18723 | 2.01e-03 | 2.03e-02 | 15 |
| Page: 1 |
| Pathway ID | Tissue | Disease Stage | Description | Gene Ratio | Bg Ratio | pvalue | p.adjust | qvalue | Count |
| hsa05012 | Colorectum | AD | Parkinson disease | 147/2092 | 266/8465 | 2.53e-27 | 8.48e-25 | 5.41e-25 | 147 |
| hsa05010 | Colorectum | AD | Alzheimer disease | 174/2092 | 384/8465 | 1.82e-19 | 9.26e-18 | 5.91e-18 | 174 |
| hsa050121 | Colorectum | AD | Parkinson disease | 147/2092 | 266/8465 | 2.53e-27 | 8.48e-25 | 5.41e-25 | 147 |
| hsa050101 | Colorectum | AD | Alzheimer disease | 174/2092 | 384/8465 | 1.82e-19 | 9.26e-18 | 5.91e-18 | 174 |
| hsa050122 | Colorectum | SER | Parkinson disease | 132/1580 | 266/8465 | 2.72e-31 | 9.03e-29 | 6.55e-29 | 132 |
| hsa050102 | Colorectum | SER | Alzheimer disease | 146/1580 | 384/8465 | 6.52e-20 | 2.40e-18 | 1.75e-18 | 146 |
| hsa050123 | Colorectum | SER | Parkinson disease | 132/1580 | 266/8465 | 2.72e-31 | 9.03e-29 | 6.55e-29 | 132 |
| hsa050103 | Colorectum | SER | Alzheimer disease | 146/1580 | 384/8465 | 6.52e-20 | 2.40e-18 | 1.75e-18 | 146 |
| hsa050124 | Colorectum | MSS | Parkinson disease | 140/1875 | 266/8465 | 2.32e-28 | 7.79e-26 | 4.77e-26 | 140 |
| hsa050104 | Colorectum | MSS | Alzheimer disease | 169/1875 | 384/8465 | 1.21e-22 | 1.01e-20 | 6.21e-21 | 169 |
| hsa050125 | Colorectum | MSS | Parkinson disease | 140/1875 | 266/8465 | 2.32e-28 | 7.79e-26 | 4.77e-26 | 140 |
| hsa050105 | Colorectum | MSS | Alzheimer disease | 169/1875 | 384/8465 | 1.21e-22 | 1.01e-20 | 6.21e-21 | 169 |
| hsa050128 | Colorectum | FAP | Parkinson disease | 80/1404 | 266/8465 | 2.04e-08 | 6.20e-07 | 3.77e-07 | 80 |
| hsa050108 | Colorectum | FAP | Alzheimer disease | 105/1404 | 384/8465 | 3.74e-08 | 1.04e-06 | 6.33e-07 | 105 |
| hsa050129 | Colorectum | FAP | Parkinson disease | 80/1404 | 266/8465 | 2.04e-08 | 6.20e-07 | 3.77e-07 | 80 |
| hsa050109 | Colorectum | FAP | Alzheimer disease | 105/1404 | 384/8465 | 3.74e-08 | 1.04e-06 | 6.33e-07 | 105 |
| hsa0501226 | Endometrium | AEH | Parkinson disease | 115/1197 | 266/8465 | 6.24e-32 | 1.01e-29 | 7.42e-30 | 115 |
| hsa0501020 | Endometrium | AEH | Alzheimer disease | 124/1197 | 384/8465 | 1.20e-20 | 3.91e-19 | 2.86e-19 | 124 |
| hsa05012111 | Endometrium | AEH | Parkinson disease | 115/1197 | 266/8465 | 6.24e-32 | 1.01e-29 | 7.42e-30 | 115 |
| hsa05010110 | Endometrium | AEH | Alzheimer disease | 124/1197 | 384/8465 | 1.20e-20 | 3.91e-19 | 2.86e-19 | 124 |
| Page: 1 2 3 4 |
Top |
Cell-cell communication analysis |
| Identification of potential cell-cell interactions between two cell types and their ligand-receptor pairs for different disease states |
| Ligand | Receptor | LRpair | Pathway | Tissue | Disease Stage |
| Page: 1 |
Top |
Single-cell gene regulatory network inference analysis |
| Find out the significant the regulons (TFs) and the target genes of each regulon across cell types for different disease states |
| TF | Cell Type | Tissue | Disease Stage | Target Gene | RSS | Regulon Activity |
| ∗The dot plots of a searched regulon are shown for all cell subpopulations in each disease state of each tissue based on the regulon specific score inferred using pySCENIC and by calculating the average expression. |
| Page: 1 |
Top |
Somatic mutation of malignant transformation related genes |
| Annotation of somatic variants for genes involved in malignant transformation |
| Hugo Symbol | Variant Class | Variant Classification | dbSNP RS | HGVSc | HGVSp | HGVSp Short | SWISSPROT | BIOTYPE | SIFT | PolyPhen | Tumor Sample Barcode | Tissue | Histology | Sex | Age | Stage | Therapy Types | Drugs | Outcome |
| SLC39A11 | SNV | Missense_Mutation | novel | c.467N>C | p.Gly156Ala | p.G156A | Q8N1S5 | protein_coding | tolerated(0.15) | possibly_damaging(0.542) | TCGA-A8-A079-01 | Breast | breast invasive carcinoma | Female | >=65 | III/IV | Chemotherapy | 5-fluorouracil | SD |
| SLC39A11 | insertion | Nonsense_Mutation | novel | c.854_855insATAAAGAATGAGTCGA | p.Leu286Ter | p.L286* | Q8N1S5 | protein_coding | TCGA-A8-A09B-01 | Breast | breast invasive carcinoma | Female | <65 | III/IV | Chemotherapy | 5-fluorouracil | SD | ||
| SLC39A11 | SNV | Missense_Mutation | rs763797008 | c.727C>T | p.Pro243Ser | p.P243S | Q8N1S5 | protein_coding | deleterious(0.02) | probably_damaging(1) | TCGA-EK-A3GK-01 | Cervix | cervical & endocervical cancer | Female | <65 | I/II | Unknown | Unknown | SD |
| SLC39A11 | SNV | Missense_Mutation | c.808G>A | p.Gly270Ser | p.G270S | Q8N1S5 | protein_coding | deleterious(0) | probably_damaging(1) | TCGA-AA-3715-01 | Colorectum | colon adenocarcinoma | Male | >=65 | I/II | Unknown | Unknown | PD | |
| SLC39A11 | SNV | Missense_Mutation | c.199G>A | p.Ala67Thr | p.A67T | Q8N1S5 | protein_coding | deleterious(0.04) | probably_damaging(0.951) | TCGA-AA-3966-01 | Colorectum | colon adenocarcinoma | Female | >=65 | I/II | Unknown | Unknown | SD | |
| SLC39A11 | SNV | Missense_Mutation | c.832G>A | p.Val278Ile | p.V278I | Q8N1S5 | protein_coding | tolerated(0.44) | benign(0.026) | TCGA-AA-A01V-01 | Colorectum | colon adenocarcinoma | Male | <65 | I/II | Unknown | Unknown | SD | |
| SLC39A11 | SNV | Missense_Mutation | c.583N>A | p.Ala195Thr | p.A195T | Q8N1S5 | protein_coding | tolerated(0.08) | benign(0.005) | TCGA-AD-5900-01 | Colorectum | colon adenocarcinoma | Male | >=65 | I/II | Unknown | Unknown | SD | |
| SLC39A11 | SNV | Missense_Mutation | rs201967760 | c.392C>T | p.Ala131Val | p.A131V | Q8N1S5 | protein_coding | tolerated(0.32) | benign(0.001) | TCGA-F4-6570-01 | Colorectum | colon adenocarcinoma | Female | >=65 | I/II | Unknown | Unknown | SD |
| SLC39A11 | SNV | Missense_Mutation | novel | c.628N>T | p.Leu210Phe | p.L210F | Q8N1S5 | protein_coding | deleterious(0) | probably_damaging(0.999) | TCGA-F5-6814-01 | Colorectum | rectum adenocarcinoma | Male | <65 | I/II | Unknown | Unknown | SD |
| SLC39A11 | SNV | Missense_Mutation | novel | c.110N>A | p.Arg37Lys | p.R37K | Q8N1S5 | protein_coding | tolerated(0.38) | benign(0.074) | TCGA-A5-A0G2-01 | Endometrium | uterine corpus endometrioid carcinoma | Female | <65 | III/IV | Unknown | Unknown | SD |
| Page: 1 2 3 4 |
Top |
Related drugs of malignant transformation related genes |
| Identification of chemicals and drugs interact with genes involved in malignant transfromation |
| (DGIdb 4.0) |
| Entrez ID | Symbol | Category | Interaction Types | Drug Claim Name | Drug Name | PMIDs |
| Page: 1 |

Copyright 2023-Present -The University of Texas Health Science Center at Houston |