
|
|||||
|
 | |
| |
| |
| |
| |
| |
|
Gene: SLC39A10 |
Gene summary for SLC39A10 |
| Gene information | Species | Human | Gene symbol | SLC39A10 | Gene ID | 57181 |
| Gene name | solute carrier family 39 member 10 | |
| Gene Alias | LZT-Hs2 | |
| Cytomap | 2q32.3 | |
| Gene Type | protein-coding | GO ID | GO:0000041 | UniProtAcc | A0A024R3W5 |
Top |
Malignant transformation analysis |
| Identification of the aberrant gene expression in precancerous and cancerous lesions by comparing the gene expression of stem-like cells in diseased tissues with normal stem cells |
| Entrez ID | Symbol | Replicates | Species | Organ | Tissue | Adj P-value | Log2FC | Malignancy |
| 57181 | SLC39A10 | LZE2T | Human | Esophagus | ESCC | 4.52e-02 | 2.70e-01 | 0.082 |
| 57181 | SLC39A10 | LZE4T | Human | Esophagus | ESCC | 2.82e-10 | 1.94e-01 | 0.0811 |
| 57181 | SLC39A10 | LZE7T | Human | Esophagus | ESCC | 3.30e-08 | 4.24e-01 | 0.0667 |
| 57181 | SLC39A10 | LZE8T | Human | Esophagus | ESCC | 3.03e-05 | 1.18e-01 | 0.067 |
| 57181 | SLC39A10 | LZE24T | Human | Esophagus | ESCC | 5.65e-05 | 1.05e-01 | 0.0596 |
| 57181 | SLC39A10 | P1T-E | Human | Esophagus | ESCC | 5.09e-07 | 2.03e-01 | 0.0875 |
| 57181 | SLC39A10 | P2T-E | Human | Esophagus | ESCC | 4.27e-25 | 4.35e-01 | 0.1177 |
| 57181 | SLC39A10 | P4T-E | Human | Esophagus | ESCC | 2.91e-20 | 4.86e-01 | 0.1323 |
| 57181 | SLC39A10 | P5T-E | Human | Esophagus | ESCC | 2.18e-20 | 4.39e-01 | 0.1327 |
| 57181 | SLC39A10 | P8T-E | Human | Esophagus | ESCC | 4.44e-20 | 3.83e-01 | 0.0889 |
| 57181 | SLC39A10 | P9T-E | Human | Esophagus | ESCC | 6.01e-12 | 1.51e-01 | 0.1131 |
| 57181 | SLC39A10 | P10T-E | Human | Esophagus | ESCC | 4.19e-28 | 5.68e-01 | 0.116 |
| 57181 | SLC39A10 | P11T-E | Human | Esophagus | ESCC | 3.27e-12 | 3.64e-01 | 0.1426 |
| 57181 | SLC39A10 | P12T-E | Human | Esophagus | ESCC | 3.47e-23 | 4.59e-01 | 0.1122 |
| 57181 | SLC39A10 | P15T-E | Human | Esophagus | ESCC | 1.70e-20 | 2.46e-01 | 0.1149 |
| 57181 | SLC39A10 | P16T-E | Human | Esophagus | ESCC | 1.07e-26 | 5.34e-01 | 0.1153 |
| 57181 | SLC39A10 | P17T-E | Human | Esophagus | ESCC | 1.74e-04 | 2.62e-01 | 0.1278 |
| 57181 | SLC39A10 | P19T-E | Human | Esophagus | ESCC | 3.26e-05 | 3.07e-01 | 0.1662 |
| 57181 | SLC39A10 | P20T-E | Human | Esophagus | ESCC | 2.51e-08 | 2.01e-01 | 0.1124 |
| 57181 | SLC39A10 | P21T-E | Human | Esophagus | ESCC | 4.50e-09 | 1.95e-01 | 0.1617 |
| Page: 1 2 3 4 5 |
| Tissue | Expression Dynamics | Abbreviation |
| Esophagus |  | ESCC: Esophageal squamous cell carcinoma |
| HGIN: High-grade intraepithelial neoplasias | ||
| LGIN: Low-grade intraepithelial neoplasias | ||
| Liver | 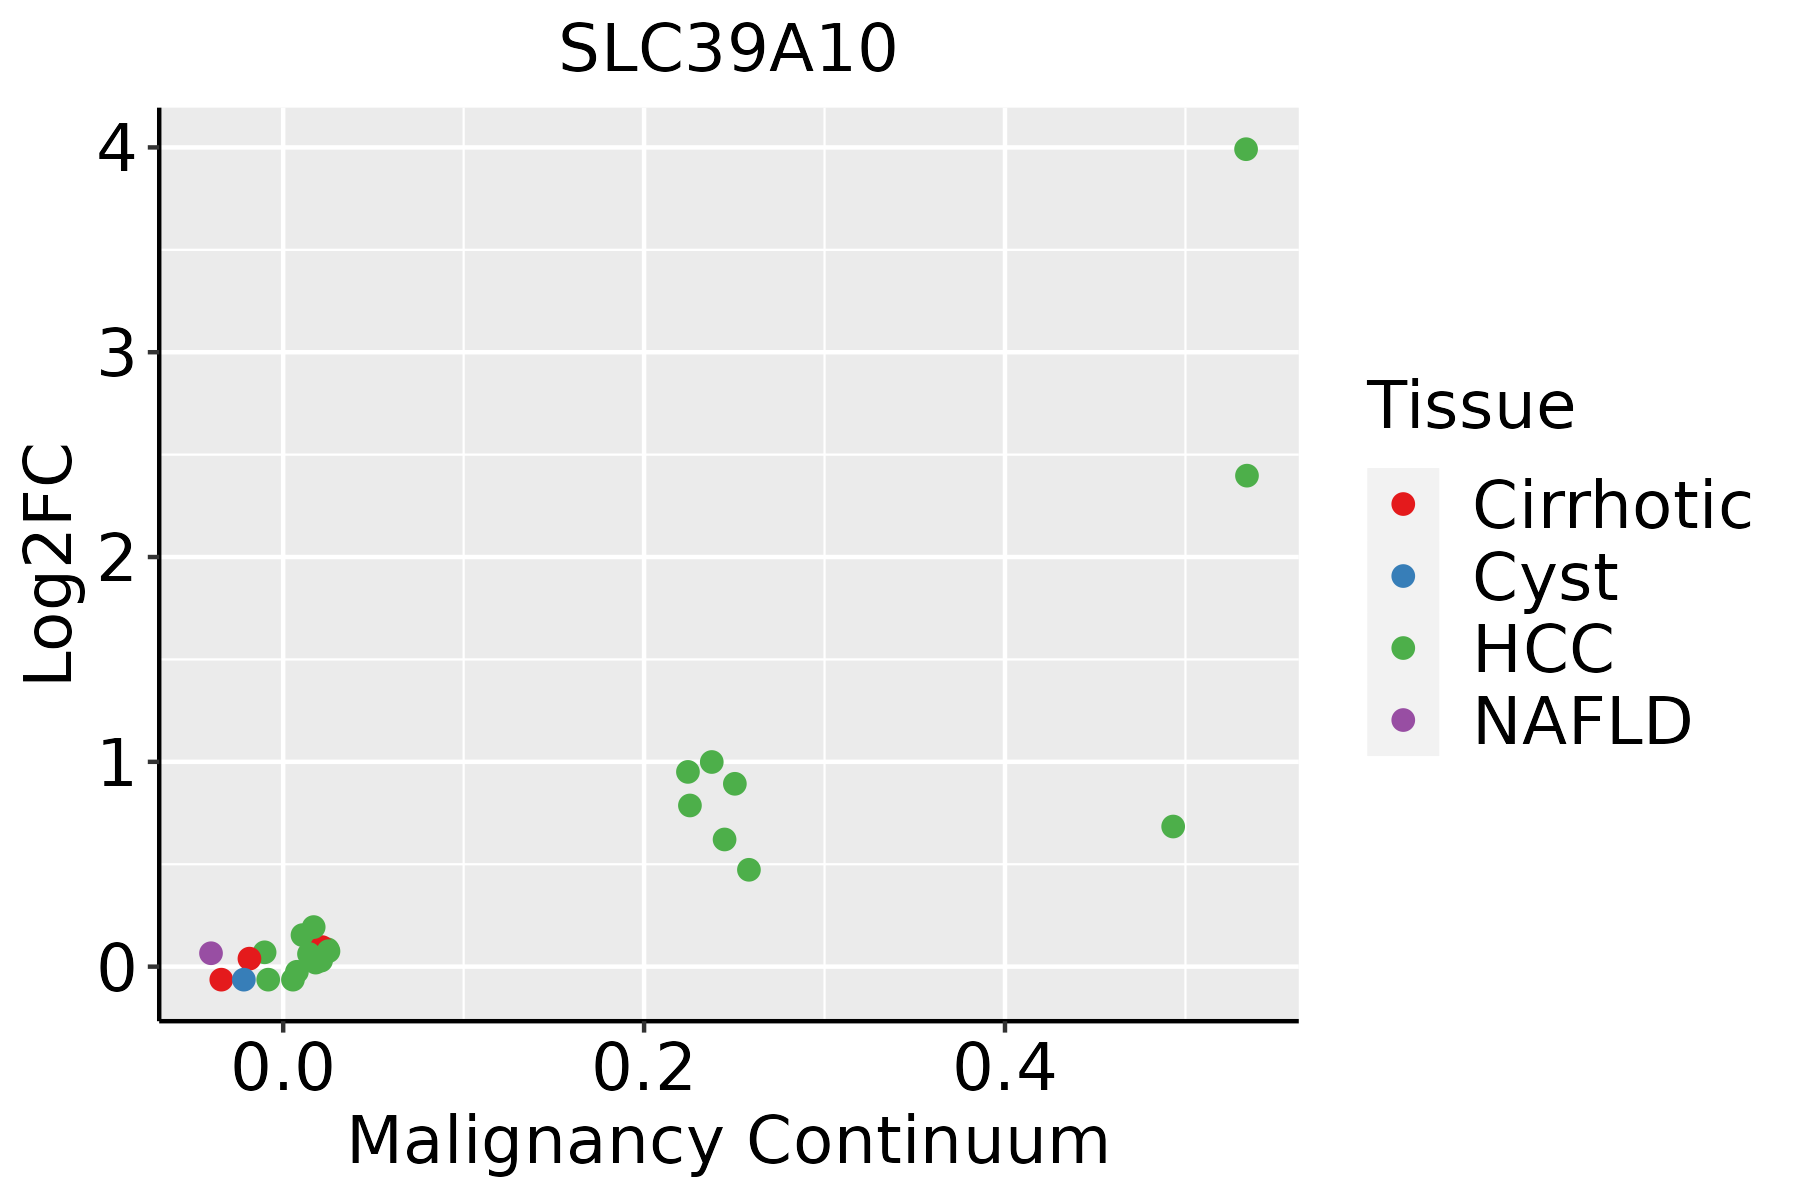 | HCC: Hepatocellular carcinoma |
| NAFLD: Non-alcoholic fatty liver disease | ||
| Oral Cavity | 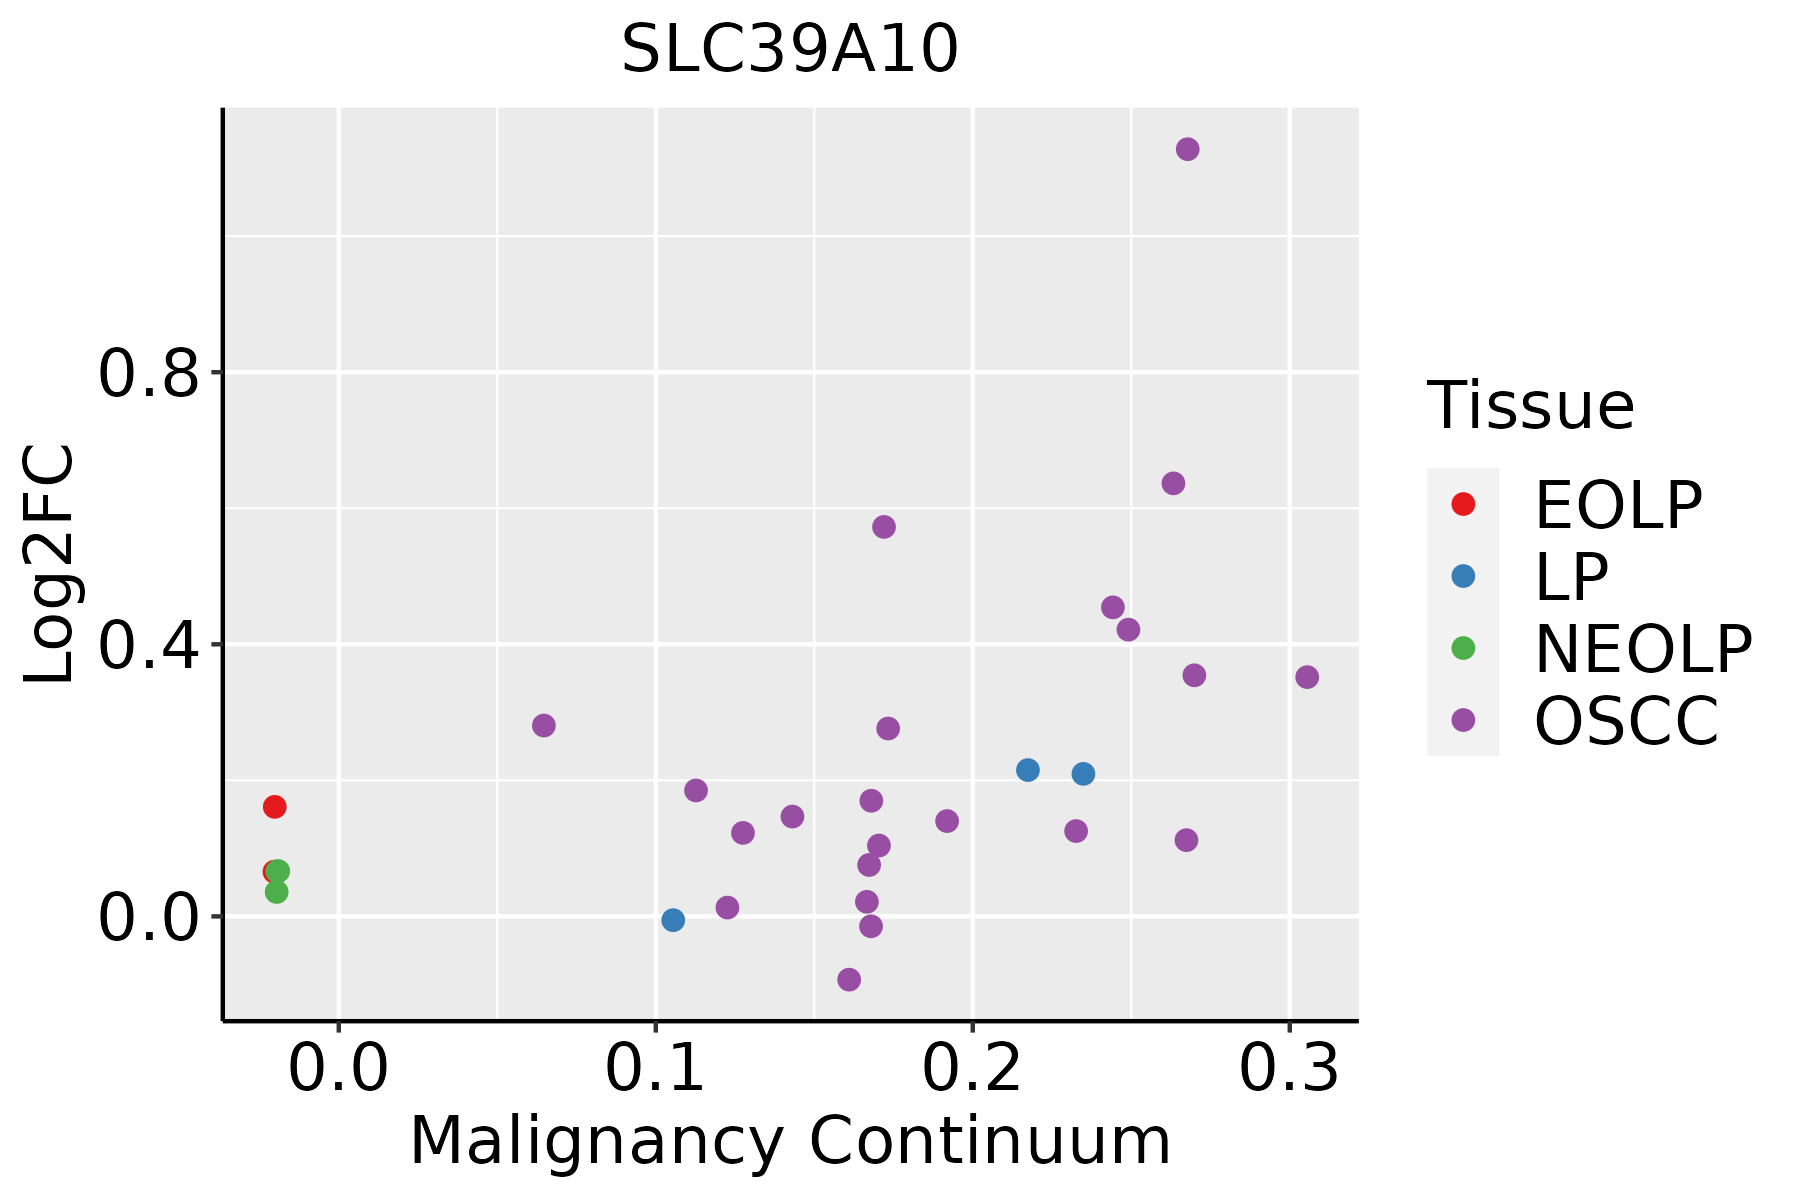 | EOLP: Erosive Oral lichen planus |
| LP: leukoplakia | ||
| NEOLP: Non-erosive oral lichen planus | ||
| OSCC: Oral squamous cell carcinoma | ||
| Prostate | 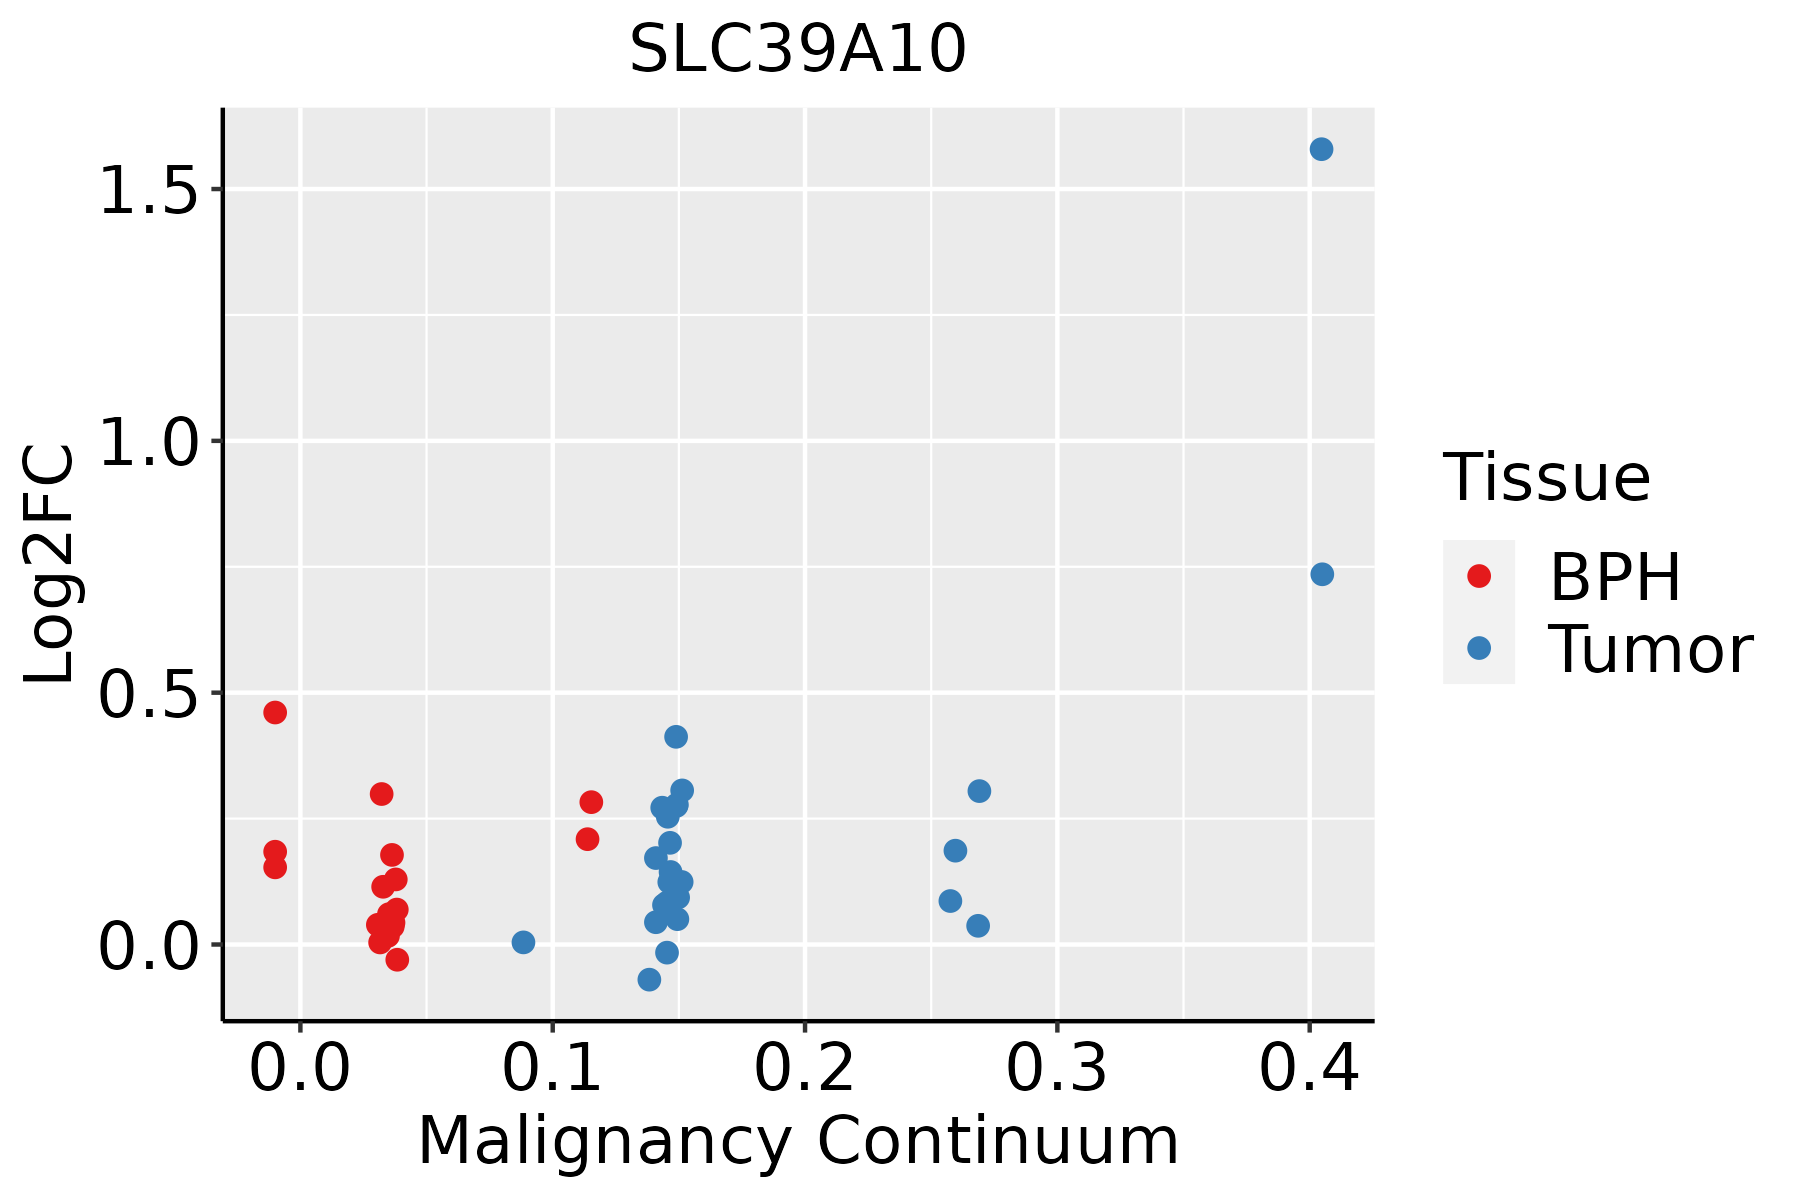 | BPH: Benign Prostatic Hyperplasia |
| Skin | 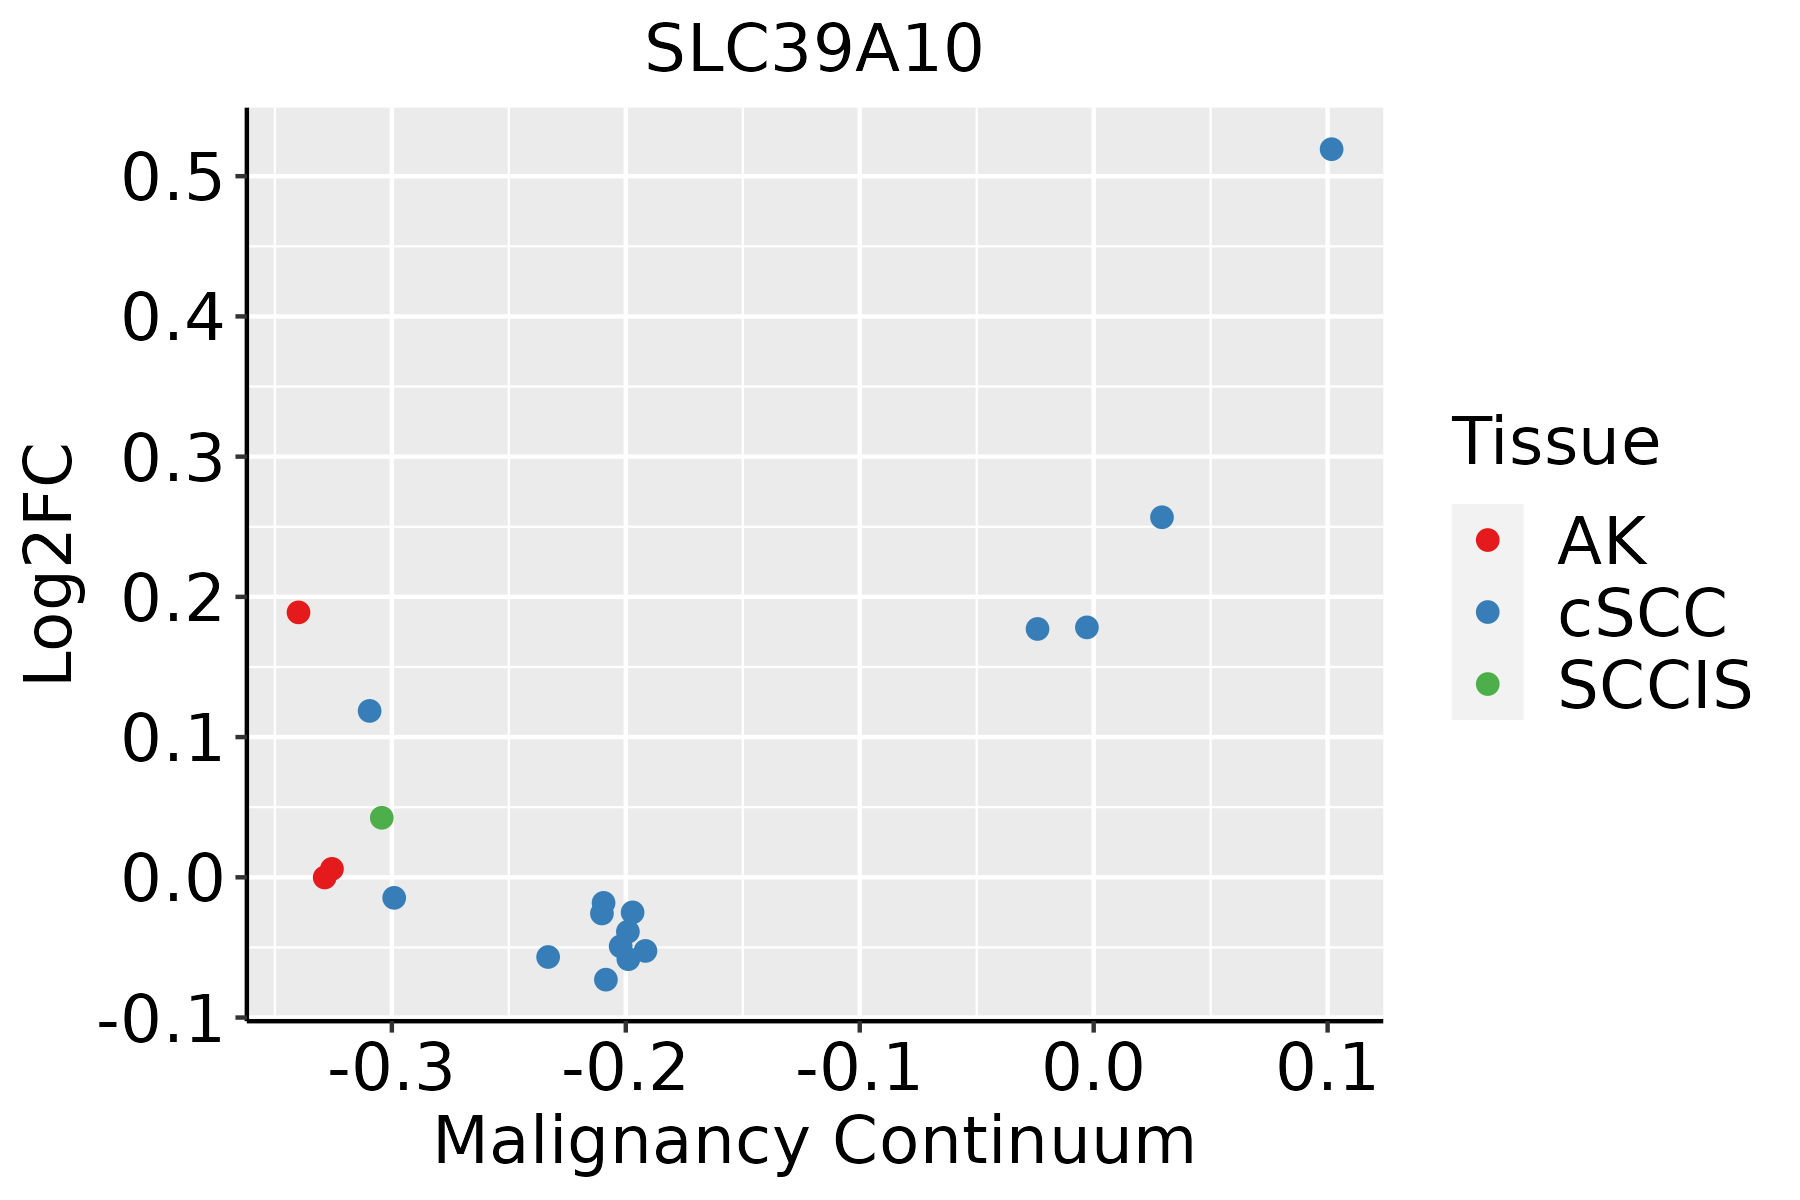 | AK: Actinic keratosis |
| cSCC: Cutaneous squamous cell carcinoma | ||
| SCCIS:squamous cell carcinoma in situ | ||
| Thyroid | 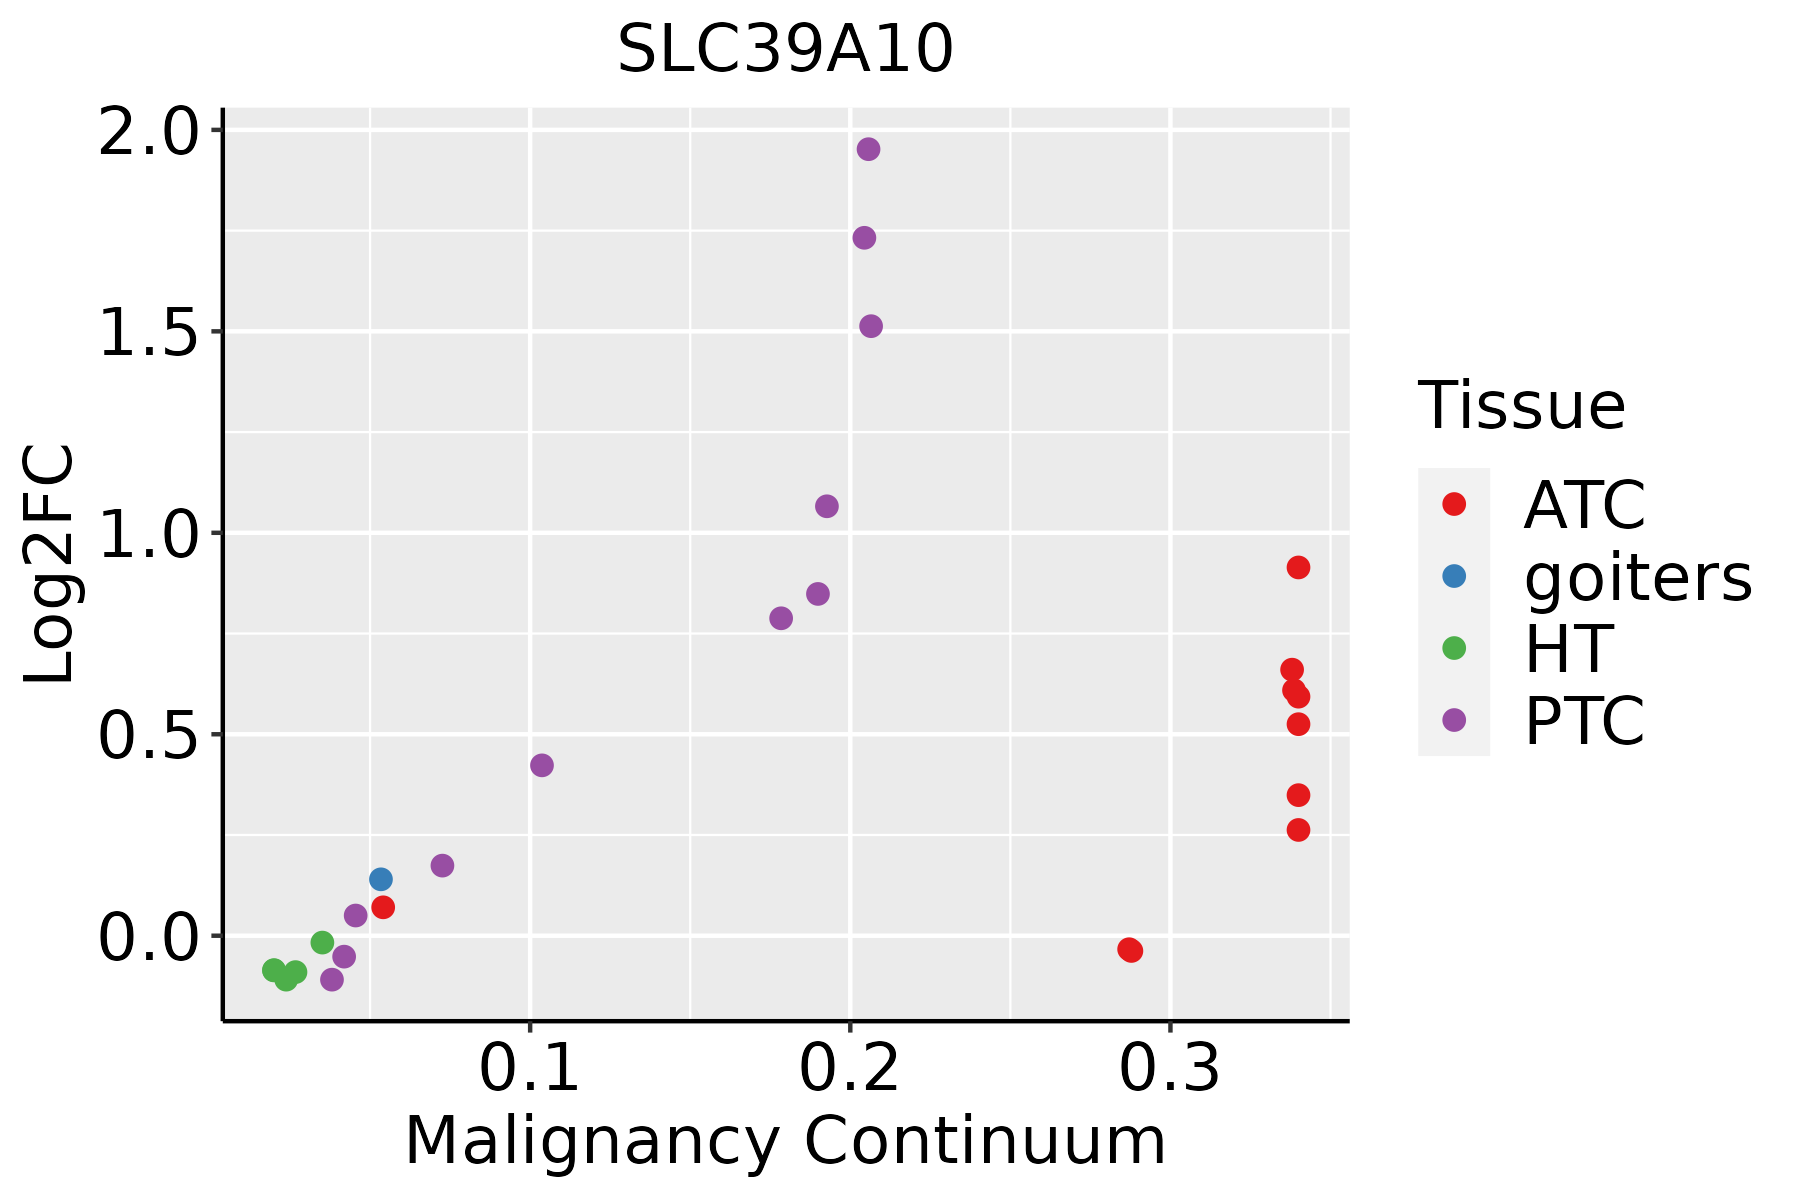 | ATC: Anaplastic thyroid cancer |
| HT: Hashimoto's thyroiditis | ||
| PTC: Papillary thyroid cancer |
| ∗log2FC in expression of this searched gene in stem-like cells from each diseased tissue sample relative to stem-like cells in normal samples in each tissue plotted against the malignancy continuum. Samples are colored based on if they are from different disease stage. |
Top |
Malignant transformation related pathway analysis |
| Find out the enriched GO biological processes and KEGG pathways involved in transition from healthy to precancer to cancer |
| Tissue | Disease Stage | Enriched GO biological Processes |
| Colorectum | AD |  |
| Colorectum | SER |  |
| Colorectum | MSS |  |
| Colorectum | MSI-H |  |
| Colorectum | FAP |  |
| ∗Top 15 enriched GO BP terms are showed in the bar plot of each disease state in each tissue. Each row represents a significant GO biological process which is colored according to the -log10(p.adjust). |
| Page: 1 2 3 4 5 6 7 8 9 |
| GO ID | Tissue | Disease Stage | Description | Gene Ratio | Bg Ratio | pvalue | p.adjust | Count |
| GO:001631110 | Esophagus | ESCC | dephosphorylation | 251/8552 | 417/18723 | 1.26e-09 | 2.99e-08 | 251 |
| GO:000647018 | Esophagus | ESCC | protein dephosphorylation | 177/8552 | 281/18723 | 3.13e-09 | 6.72e-08 | 177 |
| GO:0035304111 | Esophagus | ESCC | regulation of protein dephosphorylation | 66/8552 | 90/18723 | 8.82e-08 | 1.48e-06 | 66 |
| GO:0035303111 | Esophagus | ESCC | regulation of dephosphorylation | 88/8552 | 128/18723 | 1.04e-07 | 1.71e-06 | 88 |
| GO:005507617 | Esophagus | ESCC | transition metal ion homeostasis | 87/8552 | 138/18723 | 2.85e-05 | 2.37e-04 | 87 |
| GO:0043666110 | Esophagus | ESCC | regulation of phosphoprotein phosphatase activity | 40/8552 | 58/18723 | 2.83e-04 | 1.71e-03 | 40 |
| GO:00469169 | Esophagus | ESCC | cellular transition metal ion homeostasis | 70/8552 | 115/18723 | 7.28e-04 | 3.79e-03 | 70 |
| GO:00718871 | Esophagus | ESCC | leukocyte apoptotic process | 65/8552 | 106/18723 | 8.39e-04 | 4.32e-03 | 65 |
| GO:00017832 | Esophagus | ESCC | B cell apoptotic process | 19/8552 | 24/18723 | 8.53e-04 | 4.38e-03 | 19 |
| GO:00702271 | Esophagus | ESCC | lymphocyte apoptotic process | 46/8552 | 72/18723 | 1.39e-03 | 6.62e-03 | 46 |
| GO:00353074 | Esophagus | ESCC | positive regulation of protein dephosphorylation | 31/8552 | 45/18723 | 1.40e-03 | 6.62e-03 | 31 |
| GO:001092115 | Esophagus | ESCC | regulation of phosphatase activity | 52/8552 | 84/18723 | 1.98e-03 | 8.90e-03 | 52 |
| GO:00353066 | Esophagus | ESCC | positive regulation of dephosphorylation | 38/8552 | 59/18723 | 2.86e-03 | 1.21e-02 | 38 |
| GO:00029031 | Esophagus | ESCC | negative regulation of B cell apoptotic process | 10/8552 | 12/18723 | 8.94e-03 | 3.12e-02 | 10 |
| GO:00029021 | Esophagus | ESCC | regulation of B cell apoptotic process | 14/8552 | 19/18723 | 1.27e-02 | 4.21e-02 | 14 |
| GO:001631121 | Liver | HCC | dephosphorylation | 230/7958 | 417/18723 | 1.00e-07 | 1.96e-06 | 230 |
| GO:000647021 | Liver | HCC | protein dephosphorylation | 162/7958 | 281/18723 | 1.91e-07 | 3.46e-06 | 162 |
| GO:003530412 | Liver | HCC | regulation of protein dephosphorylation | 62/7958 | 90/18723 | 3.66e-07 | 6.22e-06 | 62 |
| GO:003530312 | Liver | HCC | regulation of dephosphorylation | 80/7958 | 128/18723 | 3.85e-06 | 4.98e-05 | 80 |
| GO:005507612 | Liver | HCC | transition metal ion homeostasis | 81/7958 | 138/18723 | 8.87e-05 | 7.72e-04 | 81 |
| Page: 1 2 3 4 5 6 7 8 |
| Pathway ID | Tissue | Disease Stage | Description | Gene Ratio | Bg Ratio | pvalue | p.adjust | qvalue | Count |
| hsa05012211 | Esophagus | ESCC | Parkinson disease | 201/4205 | 266/8465 | 1.56e-18 | 8.72e-17 | 4.46e-17 | 201 |
| hsa05010210 | Esophagus | ESCC | Alzheimer disease | 263/4205 | 384/8465 | 1.80e-14 | 5.47e-13 | 2.80e-13 | 263 |
| hsa05012310 | Esophagus | ESCC | Parkinson disease | 201/4205 | 266/8465 | 1.56e-18 | 8.72e-17 | 4.46e-17 | 201 |
| hsa0501038 | Esophagus | ESCC | Alzheimer disease | 263/4205 | 384/8465 | 1.80e-14 | 5.47e-13 | 2.80e-13 | 263 |
| hsa0501222 | Liver | HCC | Parkinson disease | 198/4020 | 266/8465 | 9.40e-20 | 1.58e-17 | 8.76e-18 | 198 |
| hsa0501022 | Liver | HCC | Alzheimer disease | 254/4020 | 384/8465 | 3.75e-14 | 8.97e-13 | 4.99e-13 | 254 |
| hsa0501232 | Liver | HCC | Parkinson disease | 198/4020 | 266/8465 | 9.40e-20 | 1.58e-17 | 8.76e-18 | 198 |
| hsa0501032 | Liver | HCC | Alzheimer disease | 254/4020 | 384/8465 | 3.75e-14 | 8.97e-13 | 4.99e-13 | 254 |
| hsa0501230 | Oral cavity | OSCC | Parkinson disease | 188/3704 | 266/8465 | 1.82e-19 | 1.52e-17 | 7.75e-18 | 188 |
| hsa0501028 | Oral cavity | OSCC | Alzheimer disease | 244/3704 | 384/8465 | 1.18e-15 | 3.60e-14 | 1.83e-14 | 244 |
| hsa05012113 | Oral cavity | OSCC | Parkinson disease | 188/3704 | 266/8465 | 1.82e-19 | 1.52e-17 | 7.75e-18 | 188 |
| hsa05010112 | Oral cavity | OSCC | Alzheimer disease | 244/3704 | 384/8465 | 1.18e-15 | 3.60e-14 | 1.83e-14 | 244 |
| hsa0501245 | Oral cavity | EOLP | Parkinson disease | 75/1218 | 266/8465 | 2.26e-09 | 5.62e-08 | 3.32e-08 | 75 |
| hsa0501045 | Oral cavity | EOLP | Alzheimer disease | 87/1218 | 384/8465 | 5.79e-06 | 3.67e-05 | 2.16e-05 | 87 |
| hsa0501255 | Oral cavity | EOLP | Parkinson disease | 75/1218 | 266/8465 | 2.26e-09 | 5.62e-08 | 3.32e-08 | 75 |
| hsa0501055 | Oral cavity | EOLP | Alzheimer disease | 87/1218 | 384/8465 | 5.79e-06 | 3.67e-05 | 2.16e-05 | 87 |
| hsa0501228 | Prostate | BPH | Parkinson disease | 143/1718 | 266/8465 | 1.19e-34 | 3.94e-32 | 2.44e-32 | 143 |
| hsa0501026 | Prostate | BPH | Alzheimer disease | 165/1718 | 384/8465 | 4.03e-25 | 1.66e-23 | 1.03e-23 | 165 |
| hsa05012112 | Prostate | BPH | Parkinson disease | 143/1718 | 266/8465 | 1.19e-34 | 3.94e-32 | 2.44e-32 | 143 |
| hsa05010111 | Prostate | BPH | Alzheimer disease | 165/1718 | 384/8465 | 4.03e-25 | 1.66e-23 | 1.03e-23 | 165 |
| Page: 1 2 |
Top |
Cell-cell communication analysis |
| Identification of potential cell-cell interactions between two cell types and their ligand-receptor pairs for different disease states |
| Ligand | Receptor | LRpair | Pathway | Tissue | Disease Stage |
| Page: 1 |
Top |
Single-cell gene regulatory network inference analysis |
| Find out the significant the regulons (TFs) and the target genes of each regulon across cell types for different disease states |
| TF | Cell Type | Tissue | Disease Stage | Target Gene | RSS | Regulon Activity |
| ∗The dot plots of a searched regulon are shown for all cell subpopulations in each disease state of each tissue based on the regulon specific score inferred using pySCENIC and by calculating the average expression. |
| Page: 1 |
Top |
Somatic mutation of malignant transformation related genes |
| Annotation of somatic variants for genes involved in malignant transformation |
| Hugo Symbol | Variant Class | Variant Classification | dbSNP RS | HGVSc | HGVSp | HGVSp Short | SWISSPROT | BIOTYPE | SIFT | PolyPhen | Tumor Sample Barcode | Tissue | Histology | Sex | Age | Stage | Therapy Types | Drugs | Outcome |
| SLC39A10 | SNV | Missense_Mutation | c.2213N>A | p.Ser738Tyr | p.S738Y | Q9ULF5 | protein_coding | deleterious(0) | probably_damaging(1) | TCGA-A8-A0A7-01 | Breast | breast invasive carcinoma | Female | <65 | I/II | Unknown | Unknown | SD | |
| SLC39A10 | SNV | Missense_Mutation | novel | c.733N>A | p.Glu245Lys | p.E245K | Q9ULF5 | protein_coding | tolerated(0.87) | benign(0.013) | TCGA-BH-A0HF-01 | Breast | breast invasive carcinoma | Female | >=65 | I/II | Hormone Therapy | arimidex | SD |
| SLC39A10 | SNV | Missense_Mutation | c.337N>T | p.Asp113Tyr | p.D113Y | Q9ULF5 | protein_coding | tolerated(0.18) | benign(0.041) | TCGA-C8-A274-01 | Breast | breast invasive carcinoma | Female | <65 | I/II | Hormone Therapy | tamoxiphen | SD | |
| SLC39A10 | insertion | Frame_Shift_Ins | novel | c.2000_2001insAAGTTTTTTGTTTTTTA | p.Asn668SerfsTer8 | p.N668Sfs*8 | Q9ULF5 | protein_coding | TCGA-A8-A08H-01 | Breast | breast invasive carcinoma | Female | >=65 | I/II | Unknown | Unknown | SD | ||
| SLC39A10 | insertion | Nonsense_Mutation | novel | c.1545_1546insGCAGCCTAGGTGACAGAGGG | p.Arg516AlafsTer3 | p.R516Afs*3 | Q9ULF5 | protein_coding | TCGA-A8-A09D-01 | Breast | breast invasive carcinoma | Female | <65 | I/II | Chemotherapy | doxorubicin | CR | ||
| SLC39A10 | insertion | Nonsense_Mutation | novel | c.1545_1546insGCAGCCTAGGTG | p.Ile515_Arg516insAlaAlaTerVal | p.I515_R516insAA*V | Q9ULF5 | protein_coding | TCGA-BH-A0HQ-01 | Breast | breast invasive carcinoma | Female | <65 | I/II | Hormone Therapy | arimidex | SD | ||
| SLC39A10 | SNV | Missense_Mutation | rs778580688 | c.209G>A | p.Arg70His | p.R70H | Q9ULF5 | protein_coding | tolerated(0.07) | possibly_damaging(0.877) | TCGA-2W-A8YY-01 | Cervix | cervical & endocervical cancer | Female | <65 | I/II | Chemotherapy | cisplatin | CR |
| SLC39A10 | SNV | Missense_Mutation | novel | c.1574G>T | p.Arg525Ile | p.R525I | Q9ULF5 | protein_coding | deleterious(0.01) | possibly_damaging(0.726) | TCGA-2W-A8YY-01 | Cervix | cervical & endocervical cancer | Female | <65 | I/II | Chemotherapy | cisplatin | CR |
| SLC39A10 | SNV | Missense_Mutation | c.1396N>A | p.Gly466Arg | p.G466R | Q9ULF5 | protein_coding | tolerated(0.06) | possibly_damaging(0.617) | TCGA-BI-A0VR-01 | Cervix | cervical & endocervical cancer | Female | <65 | III/IV | Unknown | Unknown | SD | |
| SLC39A10 | SNV | Missense_Mutation | rs867101036 | c.568N>T | p.His190Tyr | p.H190Y | Q9ULF5 | protein_coding | deleterious(0.02) | benign(0.188) | TCGA-C5-A1MK-01 | Cervix | cervical & endocervical cancer | Female | >=65 | III/IV | Chemotherapy | carboplatin | PD |
| Page: 1 2 3 4 5 6 7 8 9 10 |
Top |
Related drugs of malignant transformation related genes |
| Identification of chemicals and drugs interact with genes involved in malignant transfromation |
| (DGIdb 4.0) |
| Entrez ID | Symbol | Category | Interaction Types | Drug Claim Name | Drug Name | PMIDs |
| Page: 1 |

Copyright 2023-Present -The University of Texas Health Science Center at Houston |