
|
|||||
|
 | |
| |
| |
| |
| |
| |
|
Gene: SLC38A7 |
Gene summary for SLC38A7 |
| Gene information | Species | Human | Gene symbol | SLC38A7 | Gene ID | 55238 |
| Gene name | solute carrier family 38 member 7 | |
| Gene Alias | SNAT7 | |
| Cytomap | 16q21 | |
| Gene Type | protein-coding | GO ID | GO:0000101 | UniProtAcc | H3BMC5 |
Top |
Malignant transformation analysis |
| Identification of the aberrant gene expression in precancerous and cancerous lesions by comparing the gene expression of stem-like cells in diseased tissues with normal stem cells |
| Entrez ID | Symbol | Replicates | Species | Organ | Tissue | Adj P-value | Log2FC | Malignancy |
| 55238 | SLC38A7 | HCC1_Meng | Human | Liver | HCC | 4.86e-20 | -1.88e-02 | 0.0246 |
| 55238 | SLC38A7 | HCC2_Meng | Human | Liver | HCC | 4.99e-03 | -1.57e-02 | 0.0107 |
| 55238 | SLC38A7 | HCC2 | Human | Liver | HCC | 1.88e-27 | 4.86e+00 | 0.5341 |
| 55238 | SLC38A7 | S027 | Human | Liver | HCC | 1.43e-02 | 5.26e-01 | 0.2446 |
| 55238 | SLC38A7 | S028 | Human | Liver | HCC | 3.90e-22 | 8.10e-01 | 0.2503 |
| 55238 | SLC38A7 | S029 | Human | Liver | HCC | 2.77e-12 | 6.72e-01 | 0.2581 |
| 55238 | SLC38A7 | C04 | Human | Oral cavity | OSCC | 2.02e-04 | 1.76e-01 | 0.2633 |
| 55238 | SLC38A7 | C21 | Human | Oral cavity | OSCC | 4.07e-23 | 5.27e-01 | 0.2678 |
| 55238 | SLC38A7 | C30 | Human | Oral cavity | OSCC | 3.74e-18 | 5.19e-01 | 0.3055 |
| 55238 | SLC38A7 | C46 | Human | Oral cavity | OSCC | 3.93e-03 | 1.08e-01 | 0.1673 |
| 55238 | SLC38A7 | C51 | Human | Oral cavity | OSCC | 1.33e-05 | 2.78e-01 | 0.2674 |
| 55238 | SLC38A7 | C57 | Human | Oral cavity | OSCC | 1.02e-04 | 1.57e-01 | 0.1679 |
| 55238 | SLC38A7 | C06 | Human | Oral cavity | OSCC | 1.28e-06 | 4.36e-01 | 0.2699 |
| 55238 | SLC38A7 | C08 | Human | Oral cavity | OSCC | 5.02e-04 | 1.52e-01 | 0.1919 |
| 55238 | SLC38A7 | LP15 | Human | Oral cavity | LP | 4.58e-04 | 4.03e-01 | 0.2174 |
| 55238 | SLC38A7 | SYSMH2 | Human | Oral cavity | OSCC | 6.80e-03 | 1.83e-01 | 0.2326 |
| 55238 | SLC38A7 | SYSMH3 | Human | Oral cavity | OSCC | 4.47e-13 | 3.41e-01 | 0.2442 |
| 55238 | SLC38A7 | SYSMH5 | Human | Oral cavity | OSCC | 4.38e-02 | 1.61e-01 | 0.0647 |
| Page: 1 |
| Tissue | Expression Dynamics | Abbreviation |
| Liver | 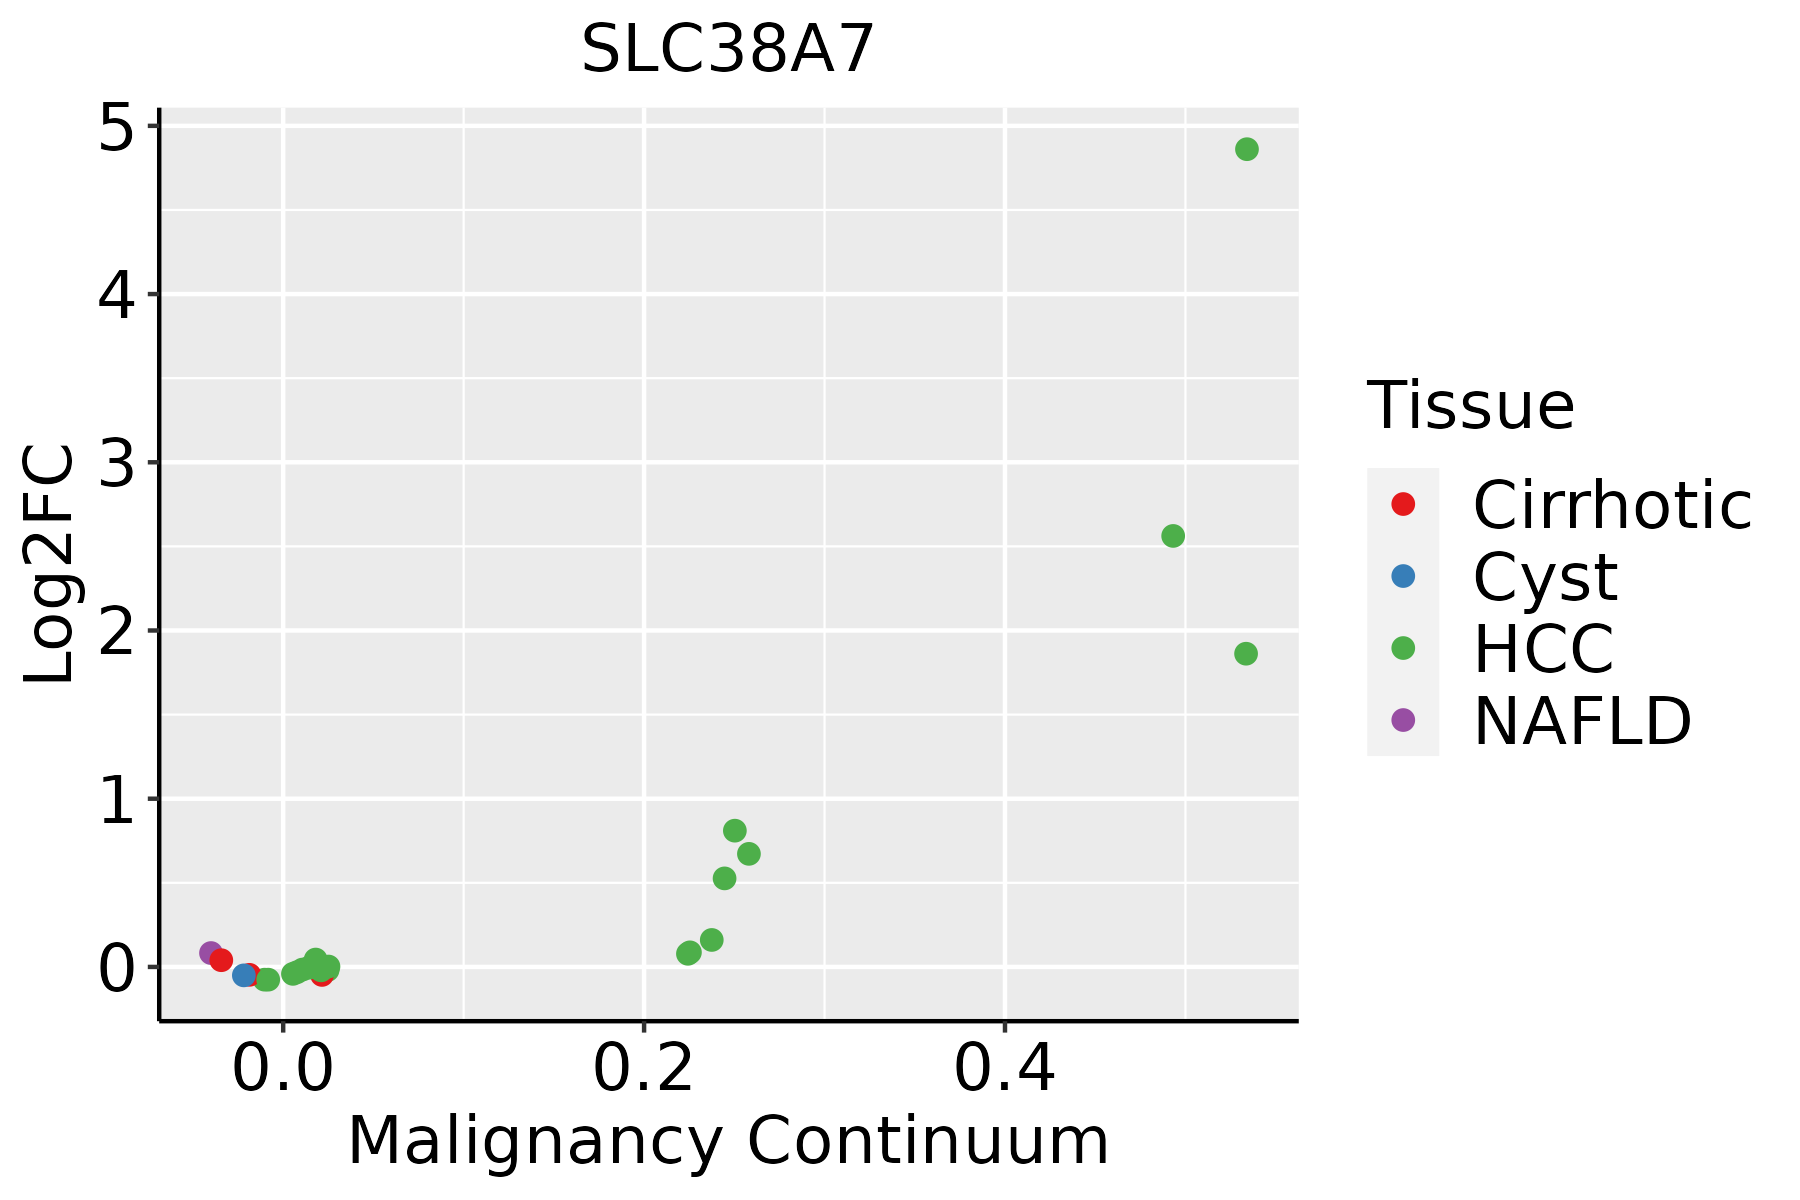 | HCC: Hepatocellular carcinoma |
| NAFLD: Non-alcoholic fatty liver disease | ||
| Oral Cavity |  | EOLP: Erosive Oral lichen planus |
| LP: leukoplakia | ||
| NEOLP: Non-erosive oral lichen planus | ||
| OSCC: Oral squamous cell carcinoma |
| ∗log2FC in expression of this searched gene in stem-like cells from each diseased tissue sample relative to stem-like cells in normal samples in each tissue plotted against the malignancy continuum. Samples are colored based on if they are from different disease stage. |
Top |
Malignant transformation related pathway analysis |
| Find out the enriched GO biological processes and KEGG pathways involved in transition from healthy to precancer to cancer |
| Tissue | Disease Stage | Enriched GO biological Processes |
| Colorectum | AD |  |
| Colorectum | SER |  |
| Colorectum | MSS |  |
| Colorectum | MSI-H |  |
| Colorectum | FAP |  |
| ∗Top 15 enriched GO BP terms are showed in the bar plot of each disease state in each tissue. Each row represents a significant GO biological process which is colored according to the -log10(p.adjust). |
| Page: 1 2 3 4 5 6 7 8 9 |
| GO ID | Tissue | Disease Stage | Description | Gene Ratio | Bg Ratio | pvalue | p.adjust | Count |
| GO:0032329 | Oral cavity | OSCC | serine transport | 9/7305 | 11/18723 | 4.85e-03 | 1.92e-02 | 9 |
| GO:00323291 | Oral cavity | LP | serine transport | 7/4623 | 11/18723 | 7.01e-03 | 3.96e-02 | 7 |
| Page: 1 |
| Pathway ID | Tissue | Disease Stage | Description | Gene Ratio | Bg Ratio | pvalue | p.adjust | qvalue | Count |
| Page: 1 |
Top |
Cell-cell communication analysis |
| Identification of potential cell-cell interactions between two cell types and their ligand-receptor pairs for different disease states |
| Ligand | Receptor | LRpair | Pathway | Tissue | Disease Stage |
| Page: 1 |
Top |
Single-cell gene regulatory network inference analysis |
| Find out the significant the regulons (TFs) and the target genes of each regulon across cell types for different disease states |
| TF | Cell Type | Tissue | Disease Stage | Target Gene | RSS | Regulon Activity |
| ∗The dot plots of a searched regulon are shown for all cell subpopulations in each disease state of each tissue based on the regulon specific score inferred using pySCENIC and by calculating the average expression. |
| Page: 1 |
Top |
Somatic mutation of malignant transformation related genes |
| Annotation of somatic variants for genes involved in malignant transformation |
| Hugo Symbol | Variant Class | Variant Classification | dbSNP RS | HGVSc | HGVSp | HGVSp Short | SWISSPROT | BIOTYPE | SIFT | PolyPhen | Tumor Sample Barcode | Tissue | Histology | Sex | Age | Stage | Therapy Types | Drugs | Outcome |
| SLC38A7 | SNV | Missense_Mutation | c.336N>C | p.Glu112Asp | p.E112D | Q9NVC3 | protein_coding | deleterious(0.04) | probably_damaging(0.992) | TCGA-AC-A23H-01 | Breast | breast invasive carcinoma | Female | >=65 | I/II | Unknown | Unknown | PD | |
| SLC38A7 | SNV | Missense_Mutation | novel | c.881N>A | p.Thr294Lys | p.T294K | Q9NVC3 | protein_coding | deleterious(0) | probably_damaging(0.998) | TCGA-AN-A0XN-01 | Breast | breast invasive carcinoma | Female | >=65 | III/IV | Unknown | Unknown | SD |
| SLC38A7 | SNV | Missense_Mutation | c.203N>A | p.Gly68Glu | p.G68E | Q9NVC3 | protein_coding | deleterious(0) | benign(0.231) | TCGA-BH-A0HF-01 | Breast | breast invasive carcinoma | Female | >=65 | I/II | Hormone Therapy | arimidex | SD | |
| SLC38A7 | SNV | Missense_Mutation | c.588N>T | p.Glu196Asp | p.E196D | Q9NVC3 | protein_coding | tolerated(0.08) | benign(0.362) | TCGA-E9-A244-01 | Breast | breast invasive carcinoma | Female | <65 | I/II | Chemotherapy | cyclophosphamide | SD | |
| SLC38A7 | insertion | In_Frame_Ins | novel | c.375_376insAGGGCCCTGGGACAT | p.Lys125_Leu126insArgAlaLeuGlyHis | p.K125_L126insRALGH | Q9NVC3 | protein_coding | TCGA-BH-A0BJ-01 | Breast | breast invasive carcinoma | Female | <65 | I/II | Chemotherapy | doxorubicin | SD | ||
| SLC38A7 | deletion | Frame_Shift_Del | novel | c.61delG | p.Glu21SerfsTer106 | p.E21Sfs*106 | Q9NVC3 | protein_coding | TCGA-EW-A2FV-01 | Breast | breast invasive carcinoma | Female | <65 | III/IV | Chemotherapy | docetaxel | SD | ||
| SLC38A7 | SNV | Missense_Mutation | novel | c.101C>T | p.Ala34Val | p.A34V | Q9NVC3 | protein_coding | tolerated(0.39) | benign(0) | TCGA-2W-A8YY-01 | Cervix | cervical & endocervical cancer | Female | <65 | I/II | Chemotherapy | cisplatin | CR |
| SLC38A7 | SNV | Missense_Mutation | c.1286G>T | p.Ser429Ile | p.S429I | Q9NVC3 | protein_coding | tolerated(0.5) | possibly_damaging(0.894) | TCGA-A6-3810-01 | Colorectum | colon adenocarcinoma | Male | <65 | I/II | Unknown | Unknown | SD | |
| SLC38A7 | SNV | Missense_Mutation | rs143684477 | c.1099C>T | p.Arg367Trp | p.R367W | Q9NVC3 | protein_coding | tolerated(0.18) | possibly_damaging(0.643) | TCGA-A5-A2K5-01 | Endometrium | uterine corpus endometrioid carcinoma | Female | >=65 | I/II | Unknown | Unknown | SD |
| SLC38A7 | SNV | Missense_Mutation | novel | c.1201N>A | p.Leu401Met | p.L401M | Q9NVC3 | protein_coding | deleterious(0.01) | probably_damaging(0.999) | TCGA-AP-A059-01 | Endometrium | uterine corpus endometrioid carcinoma | Female | >=65 | I/II | Unknown | Unknown | SD |
| Page: 1 2 3 4 |
Top |
Related drugs of malignant transformation related genes |
| Identification of chemicals and drugs interact with genes involved in malignant transfromation |
| (DGIdb 4.0) |
| Entrez ID | Symbol | Category | Interaction Types | Drug Claim Name | Drug Name | PMIDs |
| Page: 1 |

Copyright 2023-Present -The University of Texas Health Science Center at Houston |