
|
|||||
|
 | |
| |
| |
| |
| |
| |
|
Gene: SLC38A5 |
Gene summary for SLC38A5 |
| Gene information | Species | Human | Gene symbol | SLC38A5 | Gene ID | 92745 |
| Gene name | solute carrier family 38 member 5 | |
| Gene Alias | JM24 | |
| Cytomap | Xp11.23 | |
| Gene Type | protein-coding | GO ID | GO:0003008 | UniProtAcc | A0A024QYY0 |
Top |
Malignant transformation analysis |
| Identification of the aberrant gene expression in precancerous and cancerous lesions by comparing the gene expression of stem-like cells in diseased tissues with normal stem cells |
| Entrez ID | Symbol | Replicates | Species | Organ | Tissue | Adj P-value | Log2FC | Malignancy |
| 92745 | SLC38A5 | P2T-E | Human | Esophagus | ESCC | 3.95e-02 | -5.43e-02 | 0.1177 |
| 92745 | SLC38A5 | P4T-E | Human | Esophagus | ESCC | 4.76e-16 | 4.61e-01 | 0.1323 |
| 92745 | SLC38A5 | P5T-E | Human | Esophagus | ESCC | 3.01e-02 | 2.06e-01 | 0.1327 |
| 92745 | SLC38A5 | P9T-E | Human | Esophagus | ESCC | 2.45e-04 | 1.80e-01 | 0.1131 |
| 92745 | SLC38A5 | P10T-E | Human | Esophagus | ESCC | 6.62e-26 | 5.48e-01 | 0.116 |
| 92745 | SLC38A5 | P11T-E | Human | Esophagus | ESCC | 3.20e-19 | 1.67e+00 | 0.1426 |
| 92745 | SLC38A5 | P12T-E | Human | Esophagus | ESCC | 3.76e-07 | 1.54e-01 | 0.1122 |
| 92745 | SLC38A5 | P21T-E | Human | Esophagus | ESCC | 1.75e-61 | 1.30e+00 | 0.1617 |
| 92745 | SLC38A5 | P24T-E | Human | Esophagus | ESCC | 4.39e-12 | 3.30e-01 | 0.1287 |
| 92745 | SLC38A5 | P26T-E | Human | Esophagus | ESCC | 1.16e-19 | 5.59e-01 | 0.1276 |
| 92745 | SLC38A5 | P27T-E | Human | Esophagus | ESCC | 3.10e-19 | 7.97e-01 | 0.1055 |
| 92745 | SLC38A5 | P31T-E | Human | Esophagus | ESCC | 2.03e-33 | 7.49e-01 | 0.1251 |
| 92745 | SLC38A5 | P37T-E | Human | Esophagus | ESCC | 1.30e-39 | 1.20e+00 | 0.1371 |
| 92745 | SLC38A5 | P44T-E | Human | Esophagus | ESCC | 4.33e-04 | 4.56e-01 | 0.1096 |
| 92745 | SLC38A5 | P49T-E | Human | Esophagus | ESCC | 1.56e-08 | 1.11e+00 | 0.1768 |
| 92745 | SLC38A5 | P52T-E | Human | Esophagus | ESCC | 8.93e-06 | 3.57e-01 | 0.1555 |
| 92745 | SLC38A5 | P62T-E | Human | Esophagus | ESCC | 2.98e-31 | 9.36e-01 | 0.1302 |
| 92745 | SLC38A5 | P65T-E | Human | Esophagus | ESCC | 6.25e-10 | 3.78e-01 | 0.0978 |
| 92745 | SLC38A5 | P74T-E | Human | Esophagus | ESCC | 2.27e-20 | 7.59e-01 | 0.1479 |
| 92745 | SLC38A5 | P89T-E | Human | Esophagus | ESCC | 2.09e-07 | 7.17e-01 | 0.1752 |
| Page: 1 2 3 |
| Tissue | Expression Dynamics | Abbreviation |
| Esophagus | 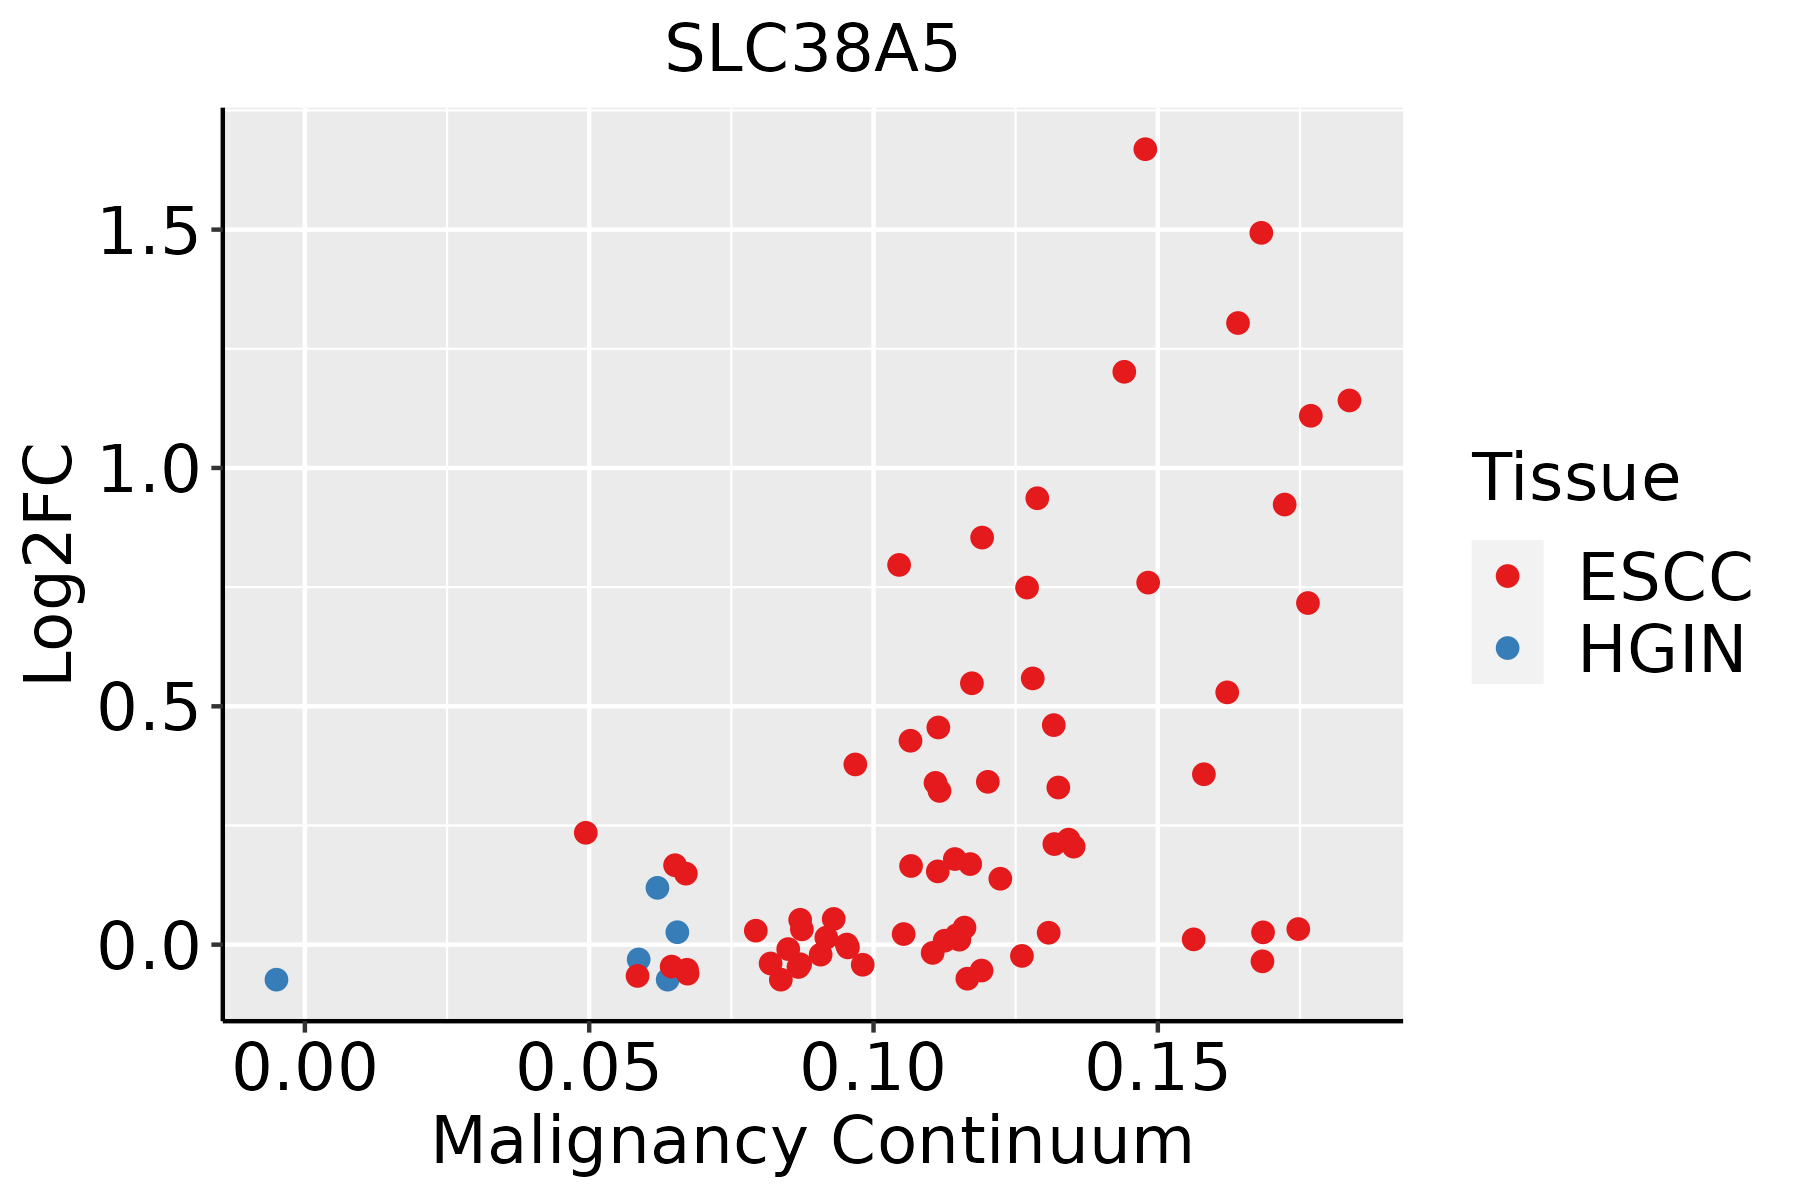 | ESCC: Esophageal squamous cell carcinoma |
| HGIN: High-grade intraepithelial neoplasias | ||
| LGIN: Low-grade intraepithelial neoplasias | ||
| Oral Cavity | 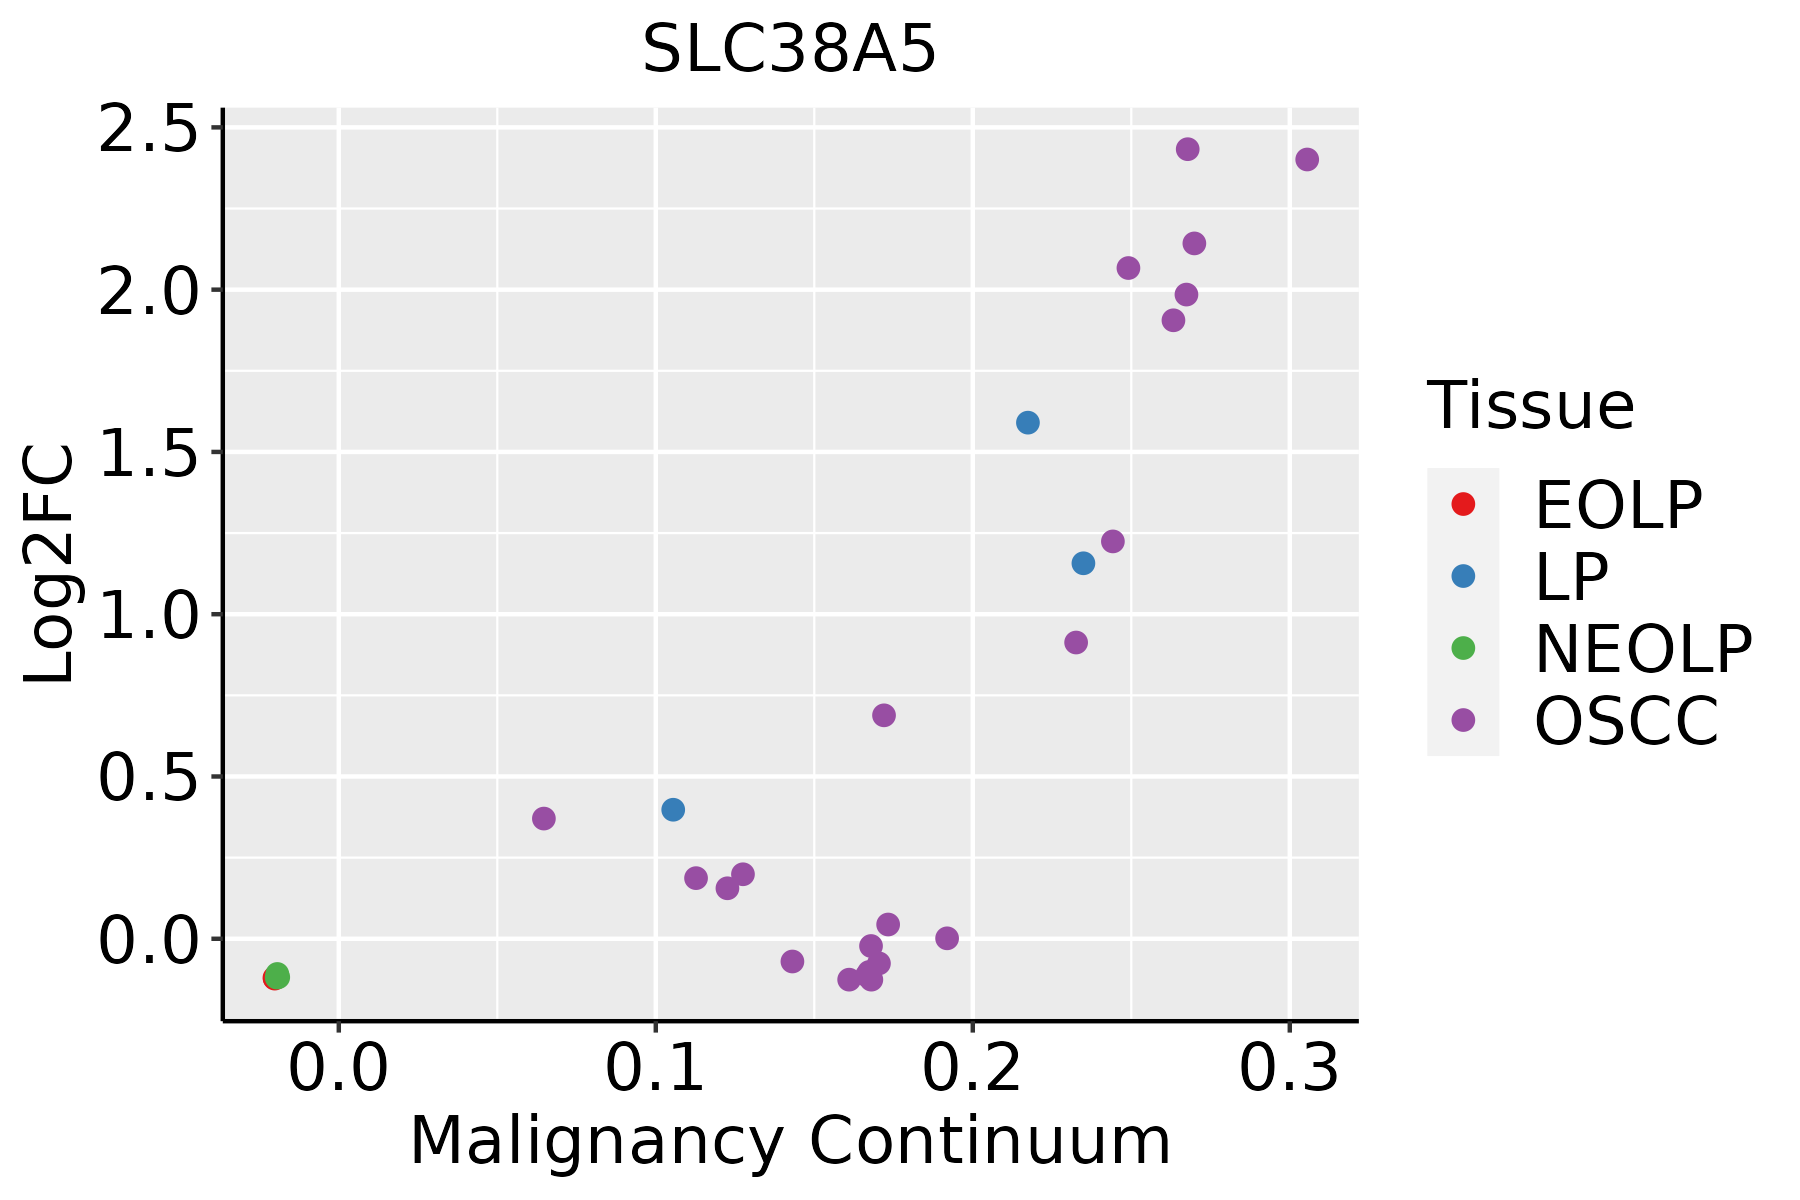 | EOLP: Erosive Oral lichen planus |
| LP: leukoplakia | ||
| NEOLP: Non-erosive oral lichen planus | ||
| OSCC: Oral squamous cell carcinoma | ||
| Skin | 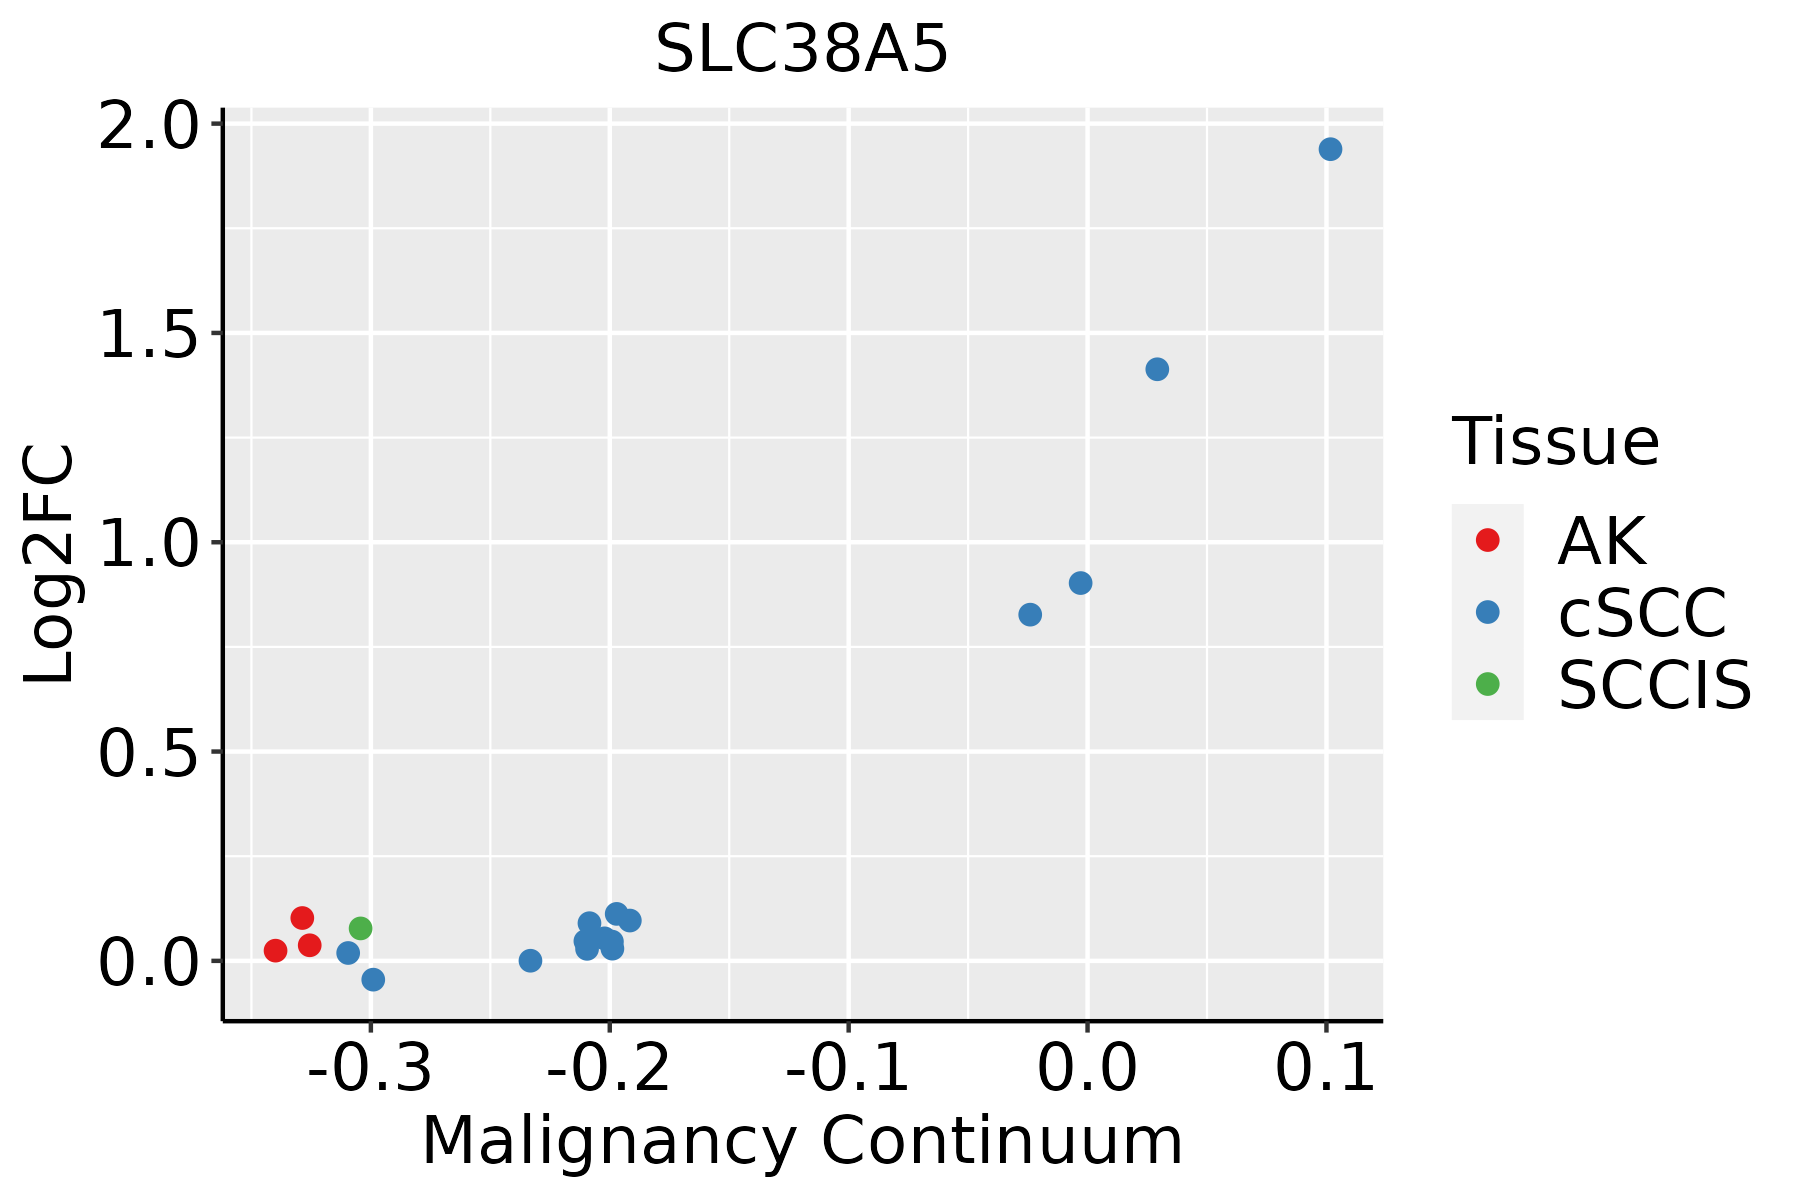 | AK: Actinic keratosis |
| cSCC: Cutaneous squamous cell carcinoma | ||
| SCCIS:squamous cell carcinoma in situ | ||
| Thyroid |  | ATC: Anaplastic thyroid cancer |
| HT: Hashimoto's thyroiditis | ||
| PTC: Papillary thyroid cancer |
| ∗log2FC in expression of this searched gene in stem-like cells from each diseased tissue sample relative to stem-like cells in normal samples in each tissue plotted against the malignancy continuum. Samples are colored based on if they are from different disease stage. |
Top |
Malignant transformation related pathway analysis |
| Find out the enriched GO biological processes and KEGG pathways involved in transition from healthy to precancer to cancer |
| Tissue | Disease Stage | Enriched GO biological Processes |
| Colorectum | AD |  |
| Colorectum | SER |  |
| Colorectum | MSS |  |
| Colorectum | MSI-H |  |
| Colorectum | FAP |  |
| ∗Top 15 enriched GO BP terms are showed in the bar plot of each disease state in each tissue. Each row represents a significant GO biological process which is colored according to the -log10(p.adjust). |
| Page: 1 2 3 4 5 6 7 8 9 |
| GO ID | Tissue | Disease Stage | Description | Gene Ratio | Bg Ratio | pvalue | p.adjust | Count |
| GO:0032329 | Oral cavity | OSCC | serine transport | 9/7305 | 11/18723 | 4.85e-03 | 1.92e-02 | 9 |
| GO:00323291 | Oral cavity | LP | serine transport | 7/4623 | 11/18723 | 7.01e-03 | 3.96e-02 | 7 |
| GO:00323292 | Thyroid | ATC | serine transport | 8/6293 | 11/18723 | 9.31e-03 | 3.44e-02 | 8 |
| Page: 1 |
| Pathway ID | Tissue | Disease Stage | Description | Gene Ratio | Bg Ratio | pvalue | p.adjust | qvalue | Count |
| Page: 1 |
Top |
Cell-cell communication analysis |
| Identification of potential cell-cell interactions between two cell types and their ligand-receptor pairs for different disease states |
| Ligand | Receptor | LRpair | Pathway | Tissue | Disease Stage |
| Page: 1 |
Top |
Single-cell gene regulatory network inference analysis |
| Find out the significant the regulons (TFs) and the target genes of each regulon across cell types for different disease states |
| TF | Cell Type | Tissue | Disease Stage | Target Gene | RSS | Regulon Activity |
| ∗The dot plots of a searched regulon are shown for all cell subpopulations in each disease state of each tissue based on the regulon specific score inferred using pySCENIC and by calculating the average expression. |
| Page: 1 |
Top |
Somatic mutation of malignant transformation related genes |
| Annotation of somatic variants for genes involved in malignant transformation |
| Hugo Symbol | Variant Class | Variant Classification | dbSNP RS | HGVSc | HGVSp | HGVSp Short | SWISSPROT | BIOTYPE | SIFT | PolyPhen | Tumor Sample Barcode | Tissue | Histology | Sex | Age | Stage | Therapy Types | Drugs | Outcome |
| SLC38A5 | SNV | Missense_Mutation | c.123C>G | p.Phe41Leu | p.F41L | Q8WUX1 | protein_coding | tolerated(0.08) | benign(0.206) | TCGA-BH-A209-01 | Breast | breast invasive carcinoma | Female | >=65 | I/II | Unknown | Unknown | SD | |
| SLC38A5 | SNV | Missense_Mutation | c.104N>T | p.Gly35Val | p.G35V | Q8WUX1 | protein_coding | deleterious(0.04) | benign(0.045) | TCGA-C8-A1HJ-01 | Breast | breast invasive carcinoma | Female | <65 | I/II | Unknown | Unknown | SD | |
| SLC38A5 | SNV | Missense_Mutation | c.1350N>A | p.Phe450Leu | p.F450L | Q8WUX1 | protein_coding | tolerated(0.19) | benign(0.327) | TCGA-D8-A1JA-01 | Breast | breast invasive carcinoma | Female | <65 | III/IV | Chemotherapy | adriamycin | PD | |
| SLC38A5 | SNV | Missense_Mutation | rs782175819 | c.104N>A | p.Gly35Glu | p.G35E | Q8WUX1 | protein_coding | tolerated(0.13) | benign(0.011) | TCGA-2W-A8YY-01 | Cervix | cervical & endocervical cancer | Female | <65 | I/II | Chemotherapy | cisplatin | CR |
| SLC38A5 | SNV | Missense_Mutation | rs781983928 | c.1192C>T | p.Arg398Trp | p.R398W | Q8WUX1 | protein_coding | deleterious(0.02) | possibly_damaging(0.893) | TCGA-FU-A3HZ-01 | Cervix | cervical & endocervical cancer | Female | <65 | I/II | Chemotherapy | cisplatin | CR |
| SLC38A5 | SNV | Missense_Mutation | c.1296N>G | p.Phe432Leu | p.F432L | Q8WUX1 | protein_coding | tolerated(1) | benign(0) | TCGA-MU-A5YI-01 | Cervix | cervical & endocervical cancer | Female | <65 | I/II | Unknown | Unknown | PD | |
| SLC38A5 | SNV | Missense_Mutation | c.307G>A | p.Ala103Thr | p.A103T | Q8WUX1 | protein_coding | deleterious(0.01) | benign(0.362) | TCGA-AA-3710-01 | Colorectum | colon adenocarcinoma | Female | >=65 | I/II | Unknown | Unknown | SD | |
| SLC38A5 | SNV | Missense_Mutation | c.1184N>A | p.Pro395Gln | p.P395Q | Q8WUX1 | protein_coding | deleterious(0.01) | probably_damaging(0.968) | TCGA-CM-5861-01 | Colorectum | colon adenocarcinoma | Female | <65 | I/II | Unknown | Unknown | PD | |
| SLC38A5 | SNV | Missense_Mutation | novel | c.1409C>A | p.Ser470Tyr | p.S470Y | Q8WUX1 | protein_coding | deleterious(0.02) | possibly_damaging(0.593) | TCGA-A5-A0G1-01 | Endometrium | uterine corpus endometrioid carcinoma | Female | >=65 | I/II | Unknown | Unknown | SD |
| SLC38A5 | SNV | Missense_Mutation | c.1225G>A | p.Ala409Thr | p.A409T | Q8WUX1 | protein_coding | deleterious(0) | probably_damaging(0.987) | TCGA-A5-A0G9-01 | Endometrium | uterine corpus endometrioid carcinoma | Female | >=65 | I/II | Unknown | Unknown | SD |
| Page: 1 2 3 4 5 |
Top |
Related drugs of malignant transformation related genes |
| Identification of chemicals and drugs interact with genes involved in malignant transfromation |
| (DGIdb 4.0) |
| Entrez ID | Symbol | Category | Interaction Types | Drug Claim Name | Drug Name | PMIDs |
| 92745 | SLC38A5 | TRANSPORTER | 178101385 | |||
| 92745 | SLC38A5 | TRANSPORTER | 178101341 |
| Page: 1 |

Copyright 2023-Present -The University of Texas Health Science Center at Houston |