
|
|||||
|
 | |
| |
| |
| |
| |
| |
|
Gene: SLC38A4 |
Gene summary for SLC38A4 |
| Gene information | Species | Human | Gene symbol | SLC38A4 | Gene ID | 55089 |
| Gene name | solute carrier family 38 member 4 | |
| Gene Alias | ATA3 | |
| Cytomap | 12q13.11 | |
| Gene Type | protein-coding | GO ID | GO:0003333 | UniProtAcc | A0A024R0X7 |
Top |
Malignant transformation analysis |
| Identification of the aberrant gene expression in precancerous and cancerous lesions by comparing the gene expression of stem-like cells in diseased tissues with normal stem cells |
| Entrez ID | Symbol | Replicates | Species | Organ | Tissue | Adj P-value | Log2FC | Malignancy |
| 55089 | SLC38A4 | NAFLD1 | Human | Liver | NAFLD | 3.88e-12 | 9.39e-01 | -0.04 |
| 55089 | SLC38A4 | S41 | Human | Liver | Cirrhotic | 6.72e-06 | 8.65e-01 | -0.0343 |
| 55089 | SLC38A4 | S43 | Human | Liver | Cirrhotic | 1.11e-04 | -2.39e-01 | -0.0187 |
| 55089 | SLC38A4 | HCC1_Meng | Human | Liver | HCC | 1.25e-96 | 2.81e-02 | 0.0246 |
| 55089 | SLC38A4 | HCC2_Meng | Human | Liver | HCC | 2.09e-11 | -3.68e-01 | 0.0107 |
| 55089 | SLC38A4 | cirrhotic1 | Human | Liver | Cirrhotic | 1.48e-09 | -3.62e-01 | 0.0202 |
| 55089 | SLC38A4 | cirrhotic2 | Human | Liver | Cirrhotic | 6.08e-06 | -3.20e-01 | 0.0201 |
| 55089 | SLC38A4 | HCC2 | Human | Liver | HCC | 2.09e-15 | 3.34e+00 | 0.5341 |
| 55089 | SLC38A4 | Pt13.a | Human | Liver | HCC | 1.64e-04 | -2.91e-01 | 0.021 |
| 55089 | SLC38A4 | Pt13.b | Human | Liver | HCC | 5.88e-06 | -2.45e-01 | 0.0251 |
| 55089 | SLC38A4 | Pt14.b | Human | Liver | HCC | 1.39e-02 | -2.28e-02 | 0.018 |
| 55089 | SLC38A4 | Pt14.d | Human | Liver | HCC | 3.37e-05 | -2.97e-01 | 0.0143 |
| 55089 | SLC38A4 | HTA12-25-1 | Human | Pancreas | PDAC | 3.77e-05 | 5.13e-01 | 0.313 |
| 55089 | SLC38A4 | HTA12-26-1 | Human | Pancreas | PDAC | 1.48e-12 | 6.53e-01 | 0.3728 |
| 55089 | SLC38A4 | HTA12-29-1 | Human | Pancreas | PDAC | 1.33e-15 | 4.20e-01 | 0.3722 |
| Page: 1 |
| Tissue | Expression Dynamics | Abbreviation |
| Liver | 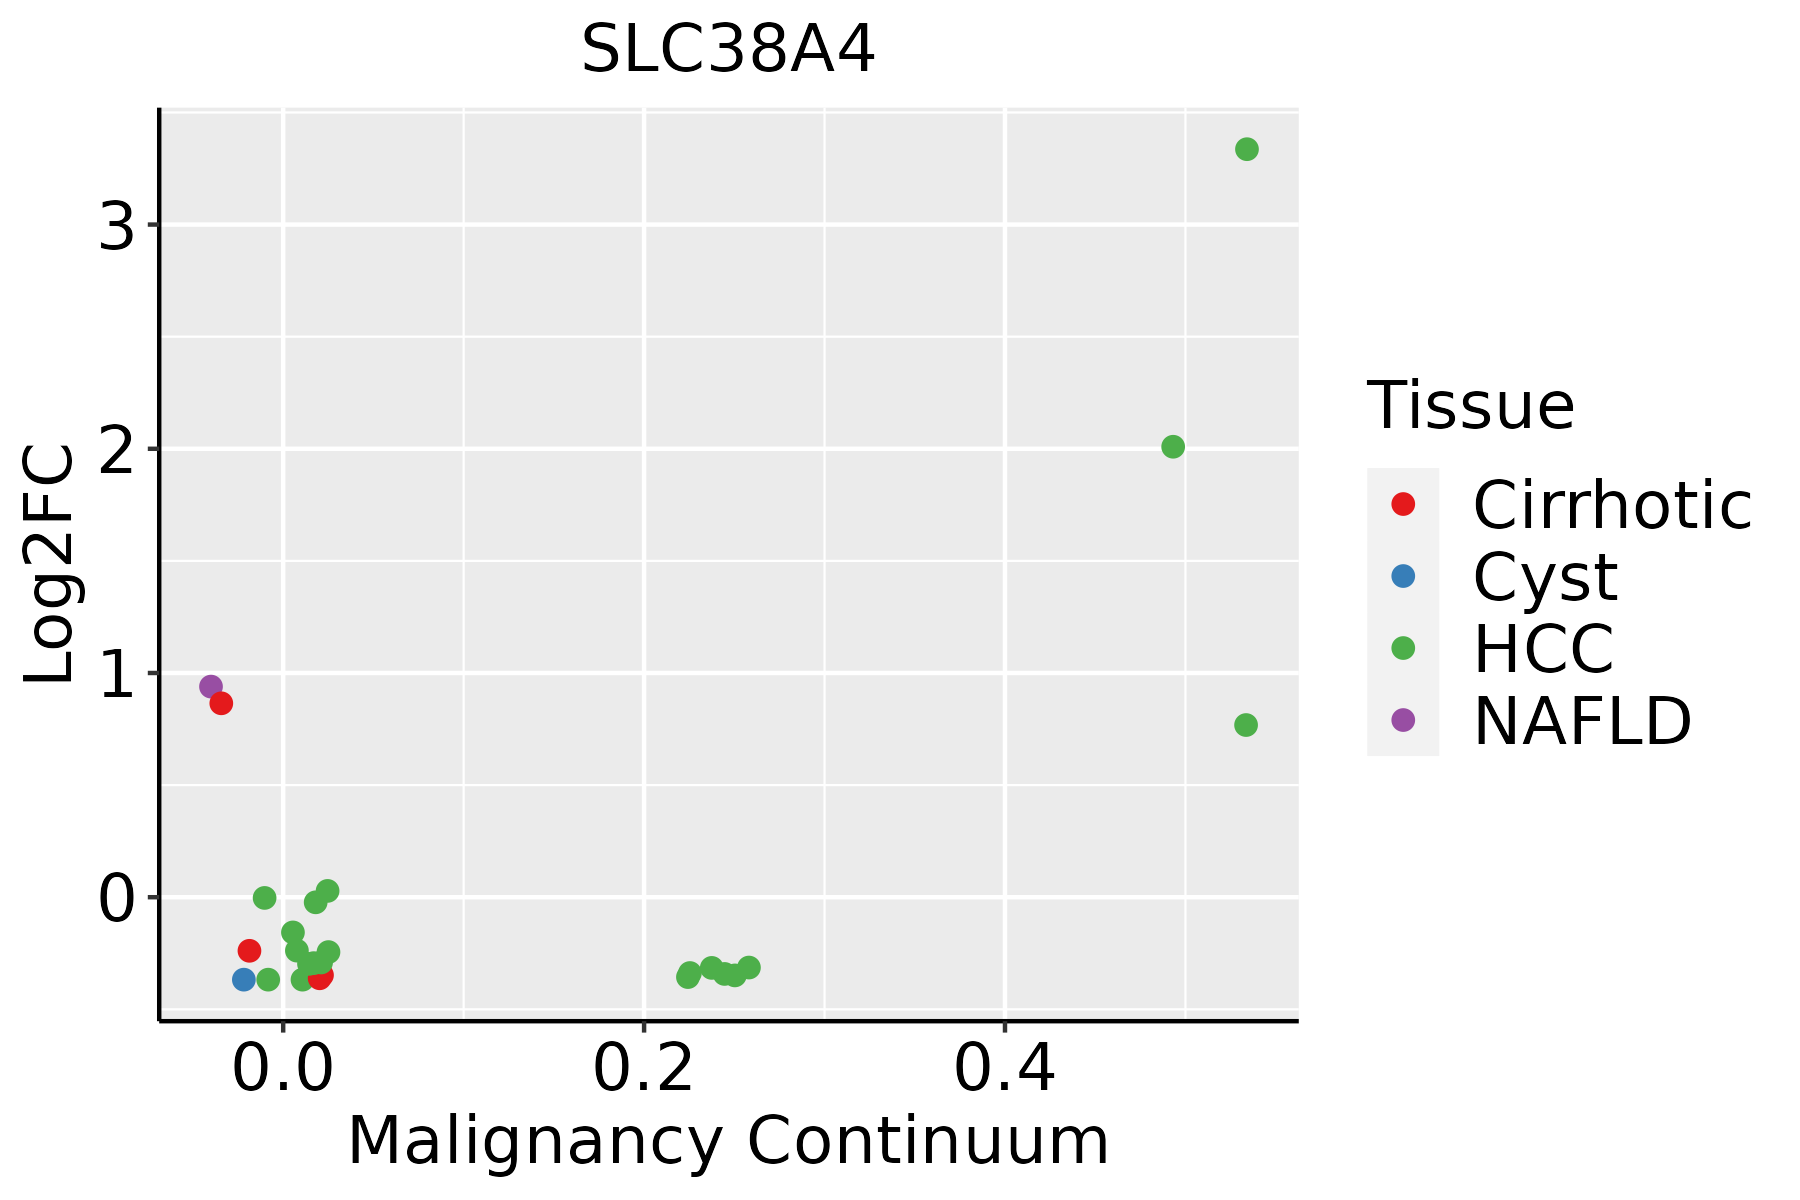 | HCC: Hepatocellular carcinoma |
| NAFLD: Non-alcoholic fatty liver disease |
| ∗log2FC in expression of this searched gene in stem-like cells from each diseased tissue sample relative to stem-like cells in normal samples in each tissue plotted against the malignancy continuum. Samples are colored based on if they are from different disease stage. |
Top |
Malignant transformation related pathway analysis |
| Find out the enriched GO biological processes and KEGG pathways involved in transition from healthy to precancer to cancer |
| Tissue | Disease Stage | Enriched GO biological Processes |
| Colorectum | AD |  |
| Colorectum | SER |  |
| Colorectum | MSS |  |
| Colorectum | MSI-H |  |
| Colorectum | FAP |  |
| ∗Top 15 enriched GO BP terms are showed in the bar plot of each disease state in each tissue. Each row represents a significant GO biological process which is colored according to the -log10(p.adjust). |
| Page: 1 2 3 4 5 6 7 8 9 |
| GO ID | Tissue | Disease Stage | Description | Gene Ratio | Bg Ratio | pvalue | p.adjust | Count |
| Page: 1 |
| Pathway ID | Tissue | Disease Stage | Description | Gene Ratio | Bg Ratio | pvalue | p.adjust | qvalue | Count |
| Page: 1 |
Top |
Cell-cell communication analysis |
| Identification of potential cell-cell interactions between two cell types and their ligand-receptor pairs for different disease states |
| Ligand | Receptor | LRpair | Pathway | Tissue | Disease Stage |
| Page: 1 |
Top |
Single-cell gene regulatory network inference analysis |
| Find out the significant the regulons (TFs) and the target genes of each regulon across cell types for different disease states |
| TF | Cell Type | Tissue | Disease Stage | Target Gene | RSS | Regulon Activity |
| ∗The dot plots of a searched regulon are shown for all cell subpopulations in each disease state of each tissue based on the regulon specific score inferred using pySCENIC and by calculating the average expression. |
| Page: 1 |
Top |
Somatic mutation of malignant transformation related genes |
| Annotation of somatic variants for genes involved in malignant transformation |
| Hugo Symbol | Variant Class | Variant Classification | dbSNP RS | HGVSc | HGVSp | HGVSp Short | SWISSPROT | BIOTYPE | SIFT | PolyPhen | Tumor Sample Barcode | Tissue | Histology | Sex | Age | Stage | Therapy Types | Drugs | Outcome |
| SLC38A4 | SNV | Missense_Mutation | c.167N>T | p.Gly56Val | p.G56V | Q969I6 | protein_coding | deleterious(0.03) | benign(0.261) | TCGA-A7-A0CJ-01 | Breast | breast invasive carcinoma | Female | <65 | I/II | Chemotherapy | cytoxan | SD | |
| SLC38A4 | SNV | Missense_Mutation | novel | c.1451N>T | p.Ser484Phe | p.S484F | Q969I6 | protein_coding | deleterious(0.01) | probably_damaging(1) | TCGA-A7-A26I-01 | Breast | breast invasive carcinoma | Female | >=65 | I/II | Chemotherapy | cytoxan | SD |
| SLC38A4 | SNV | Missense_Mutation | c.551N>C | p.Phe184Ser | p.F184S | Q969I6 | protein_coding | deleterious(0) | possibly_damaging(0.686) | TCGA-A8-A07B-01 | Breast | breast invasive carcinoma | Female | >=65 | I/II | Unknown | Unknown | SD | |
| SLC38A4 | SNV | Missense_Mutation | c.631N>T | p.Leu211Phe | p.L211F | Q969I6 | protein_coding | deleterious(0.03) | possibly_damaging(0.617) | TCGA-AC-A23H-01 | Breast | breast invasive carcinoma | Female | >=65 | I/II | Unknown | Unknown | PD | |
| SLC38A4 | SNV | Missense_Mutation | novel | c.73N>A | p.Asp25Asn | p.D25N | Q969I6 | protein_coding | tolerated(0.56) | benign(0.01) | TCGA-AN-A046-01 | Breast | breast invasive carcinoma | Female | >=65 | I/II | Unknown | Unknown | SD |
| SLC38A4 | SNV | Missense_Mutation | c.979N>C | p.Val327Leu | p.V327L | Q969I6 | protein_coding | tolerated(0.09) | benign(0.158) | TCGA-AR-A24H-01 | Breast | breast invasive carcinoma | Female | >=65 | I/II | Hormone Therapy | tamoxiphen | SD | |
| SLC38A4 | insertion | Frame_Shift_Ins | novel | c.964_965insCCCTCTTTGGTTAC | p.Glu322AlafsTer23 | p.E322Afs*23 | Q969I6 | protein_coding | TCGA-A8-A095-01 | Breast | breast invasive carcinoma | Female | <65 | I/II | Chemotherapy | 5-fluorouracil | CR | ||
| SLC38A4 | insertion | Frame_Shift_Ins | novel | c.503_504insTAGCTTTGATATT | p.Tyr169SerfsTer10 | p.Y169Sfs*10 | Q969I6 | protein_coding | TCGA-A8-A096-01 | Breast | breast invasive carcinoma | Female | >=65 | I/II | Unknown | Unknown | SD | ||
| SLC38A4 | insertion | Frame_Shift_Ins | novel | c.1318_1319insTA | p.Thr440IlefsTer17 | p.T440Ifs*17 | Q969I6 | protein_coding | TCGA-AR-A0TU-01 | Breast | breast invasive carcinoma | Female | <65 | I/II | Unspecific | Doxorubicin | SD | ||
| SLC38A4 | insertion | Nonsense_Mutation | novel | c.1317_1318insTAATAAT | p.Thr440Ter | p.T440* | Q969I6 | protein_coding | TCGA-AR-A0U0-01 | Breast | breast invasive carcinoma | Female | >=65 | I/II | Unknown | Unknown | SD |
| Page: 1 2 3 4 5 6 7 8 9 |
Top |
Related drugs of malignant transformation related genes |
| Identification of chemicals and drugs interact with genes involved in malignant transfromation |
| (DGIdb 4.0) |
| Entrez ID | Symbol | Category | Interaction Types | Drug Claim Name | Drug Name | PMIDs |
| 55089 | SLC38A4 | TRANSPORTER | 178101263 | |||
| 55089 | SLC38A4 | TRANSPORTER | 178100907 | |||
| 55089 | SLC38A4 | TRANSPORTER | 178101353 | |||
| 55089 | SLC38A4 | TRANSPORTER | 178101264 |
| Page: 1 |

Copyright 2023-Present -The University of Texas Health Science Center at Houston |