
|
|||||
|
 | |
| |
| |
| |
| |
| |
|
Gene: SLC38A2 |
Gene summary for SLC38A2 |
| Gene information | Species | Human | Gene symbol | SLC38A2 | Gene ID | 54407 |
| Gene name | solute carrier family 38 member 2 | |
| Gene Alias | ATA2 | |
| Cytomap | 12q13.11 | |
| Gene Type | protein-coding | GO ID | GO:0000003 | UniProtAcc | Q8NHT5 |
Top |
Malignant transformation analysis |
| Identification of the aberrant gene expression in precancerous and cancerous lesions by comparing the gene expression of stem-like cells in diseased tissues with normal stem cells |
| Entrez ID | Symbol | Replicates | Species | Organ | Tissue | Adj P-value | Log2FC | Malignancy |
| 54407 | SLC38A2 | GSM4909280 | Human | Breast | Precancer | 7.04e-03 | 3.81e-01 | 0.0305 |
| 54407 | SLC38A2 | GSM4909281 | Human | Breast | IDC | 7.87e-07 | -4.41e-01 | 0.21 |
| 54407 | SLC38A2 | GSM4909282 | Human | Breast | IDC | 3.00e-14 | -5.19e-01 | -0.0288 |
| 54407 | SLC38A2 | GSM4909285 | Human | Breast | IDC | 3.45e-07 | -3.95e-01 | 0.21 |
| 54407 | SLC38A2 | GSM4909286 | Human | Breast | IDC | 2.37e-08 | -4.48e-01 | 0.1081 |
| 54407 | SLC38A2 | GSM4909287 | Human | Breast | IDC | 2.65e-08 | -4.15e-01 | 0.2057 |
| 54407 | SLC38A2 | GSM4909288 | Human | Breast | IDC | 7.40e-04 | -4.88e-01 | 0.0988 |
| 54407 | SLC38A2 | GSM4909290 | Human | Breast | IDC | 4.20e-02 | -2.90e-01 | 0.2096 |
| 54407 | SLC38A2 | GSM4909293 | Human | Breast | IDC | 1.97e-03 | 2.42e-01 | 0.1581 |
| 54407 | SLC38A2 | GSM4909294 | Human | Breast | IDC | 5.91e-06 | -3.85e-01 | 0.2022 |
| 54407 | SLC38A2 | GSM4909296 | Human | Breast | IDC | 1.38e-12 | -3.86e-01 | 0.1524 |
| 54407 | SLC38A2 | GSM4909297 | Human | Breast | IDC | 1.27e-17 | -4.61e-01 | 0.1517 |
| 54407 | SLC38A2 | GSM4909302 | Human | Breast | IDC | 5.18e-08 | -3.88e-01 | 0.1545 |
| 54407 | SLC38A2 | GSM4909304 | Human | Breast | IDC | 2.30e-02 | 2.51e-01 | 0.1636 |
| 54407 | SLC38A2 | GSM4909307 | Human | Breast | IDC | 1.13e-16 | -5.72e-01 | 0.1569 |
| 54407 | SLC38A2 | GSM4909308 | Human | Breast | IDC | 4.68e-18 | -5.74e-01 | 0.158 |
| 54407 | SLC38A2 | GSM4909309 | Human | Breast | IDC | 1.67e-02 | -2.94e-01 | 0.0483 |
| 54407 | SLC38A2 | GSM4909311 | Human | Breast | IDC | 8.79e-33 | -4.58e-01 | 0.1534 |
| 54407 | SLC38A2 | GSM4909312 | Human | Breast | IDC | 1.30e-08 | -3.23e-01 | 0.1552 |
| 54407 | SLC38A2 | GSM4909316 | Human | Breast | IDC | 6.59e-04 | -4.17e-01 | 0.21 |
| Page: 1 2 3 4 5 6 7 8 9 10 11 |
| Tissue | Expression Dynamics | Abbreviation |
| Breast | 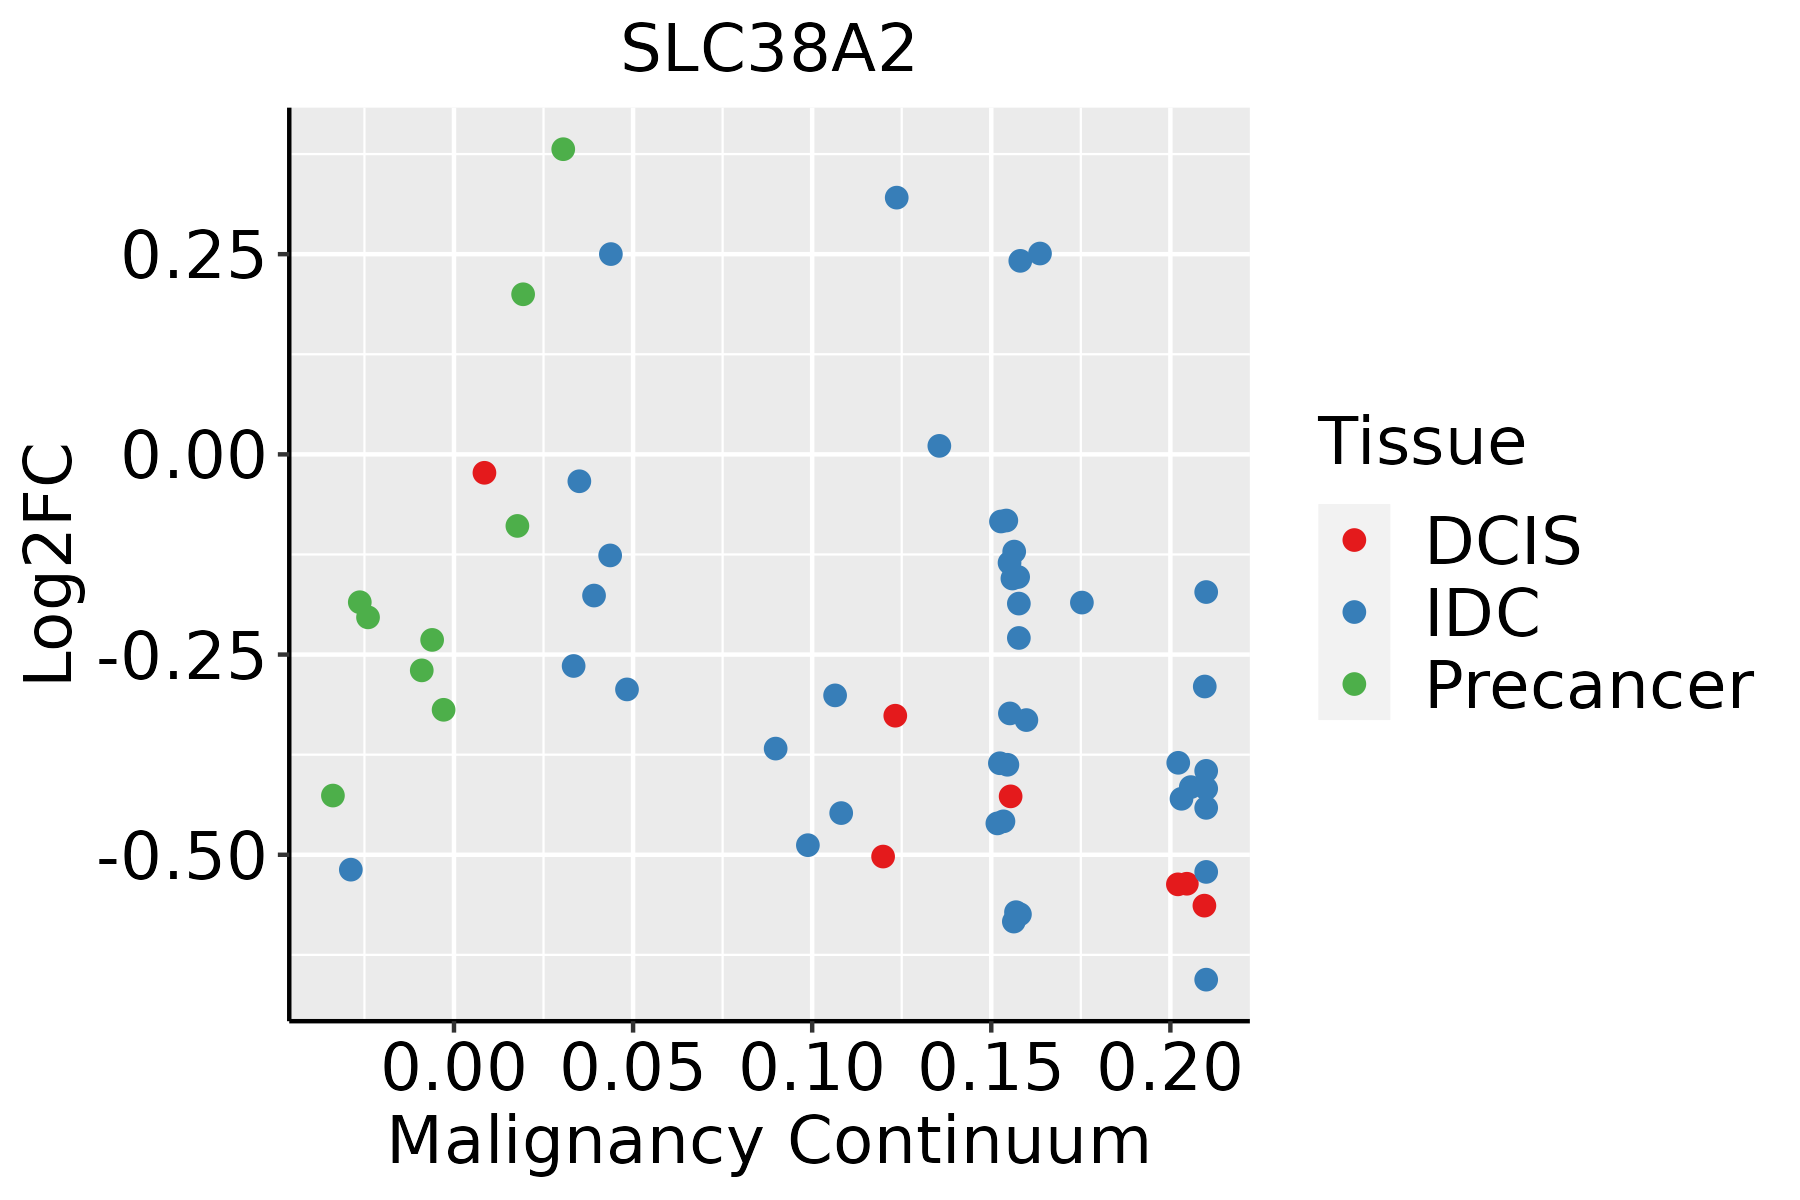 | IDC: Invasive ductal carcinoma |
| DCIS: Ductal carcinoma in situ | ||
| Precancer(BRCA1-mut): Precancerous lesion from BRCA1 mutation carriers | ||
| Cervix | 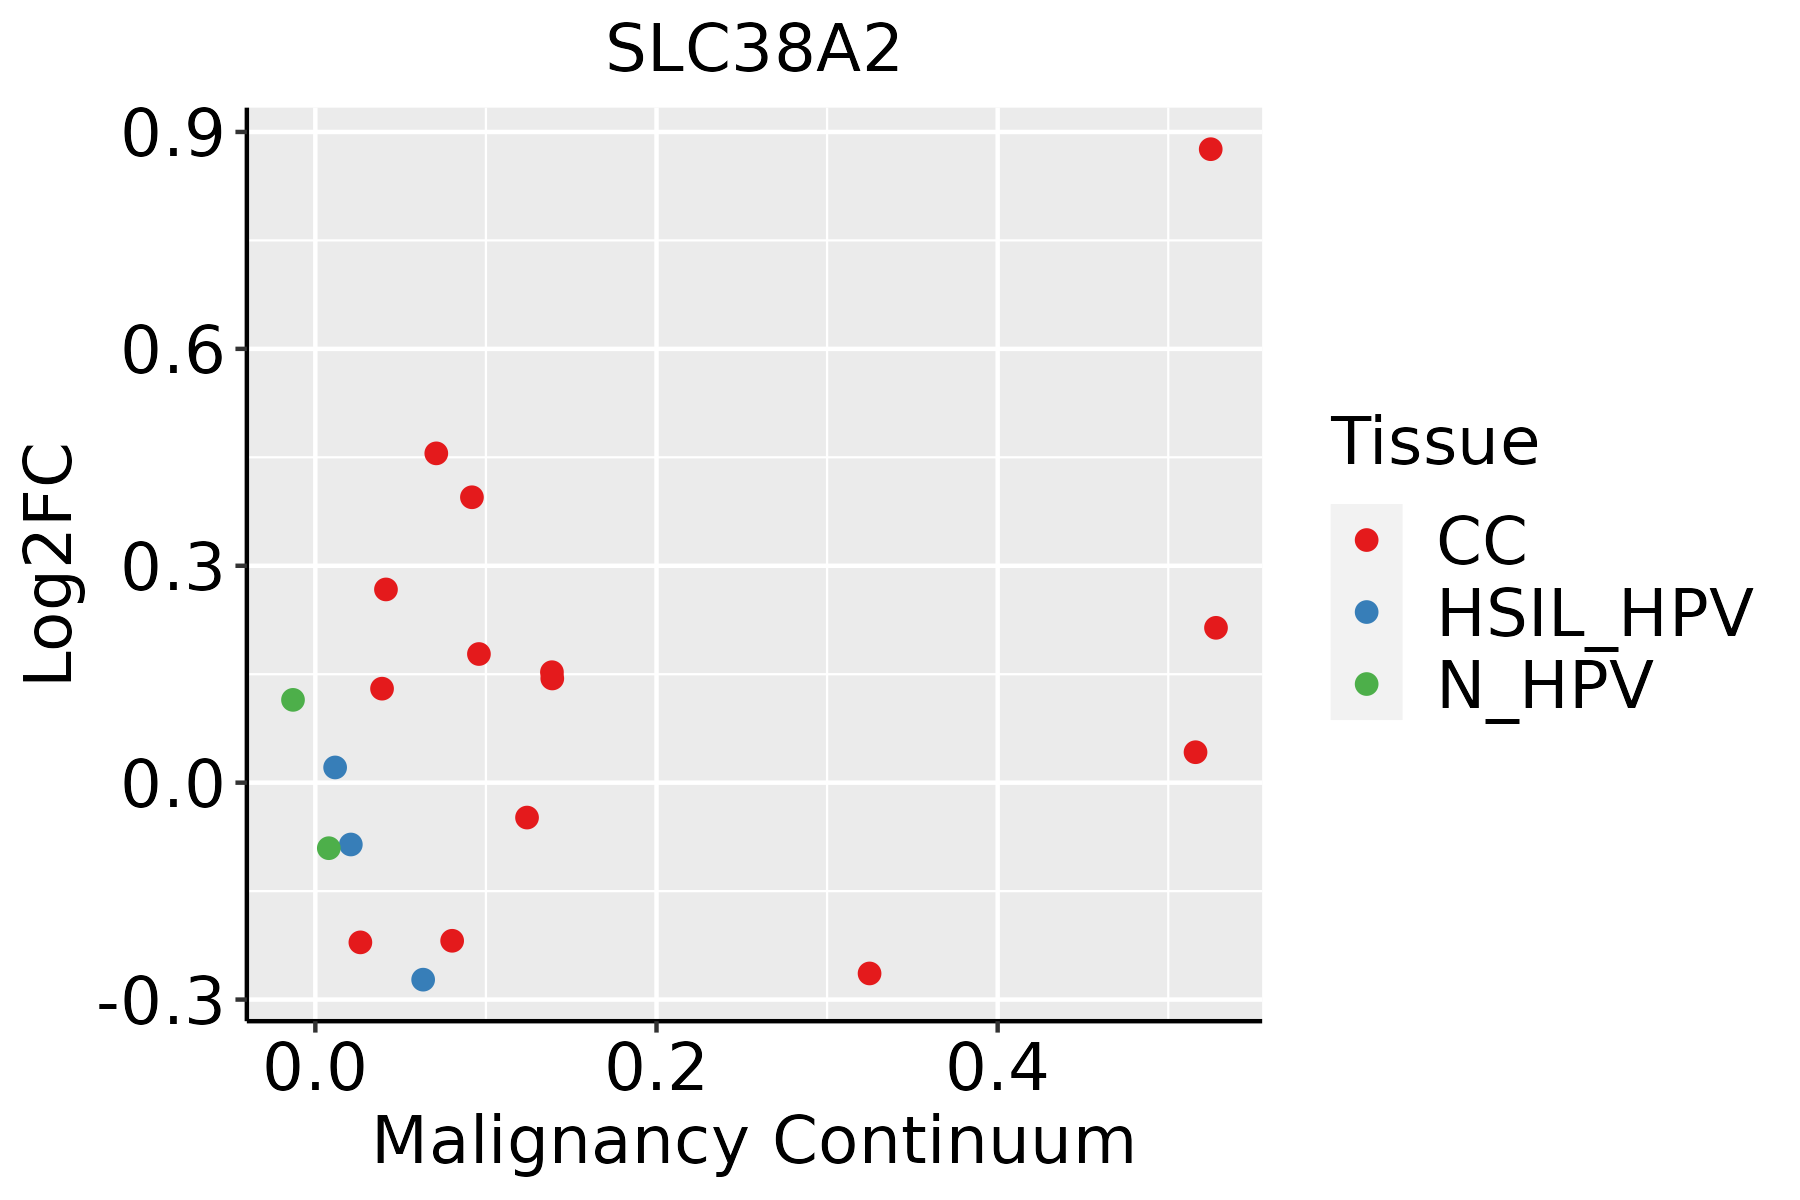 | CC: Cervix cancer |
| HSIL_HPV: HPV-infected high-grade squamous intraepithelial lesions | ||
| N_HPV: HPV-infected normal cervix | ||
| Endometrium | 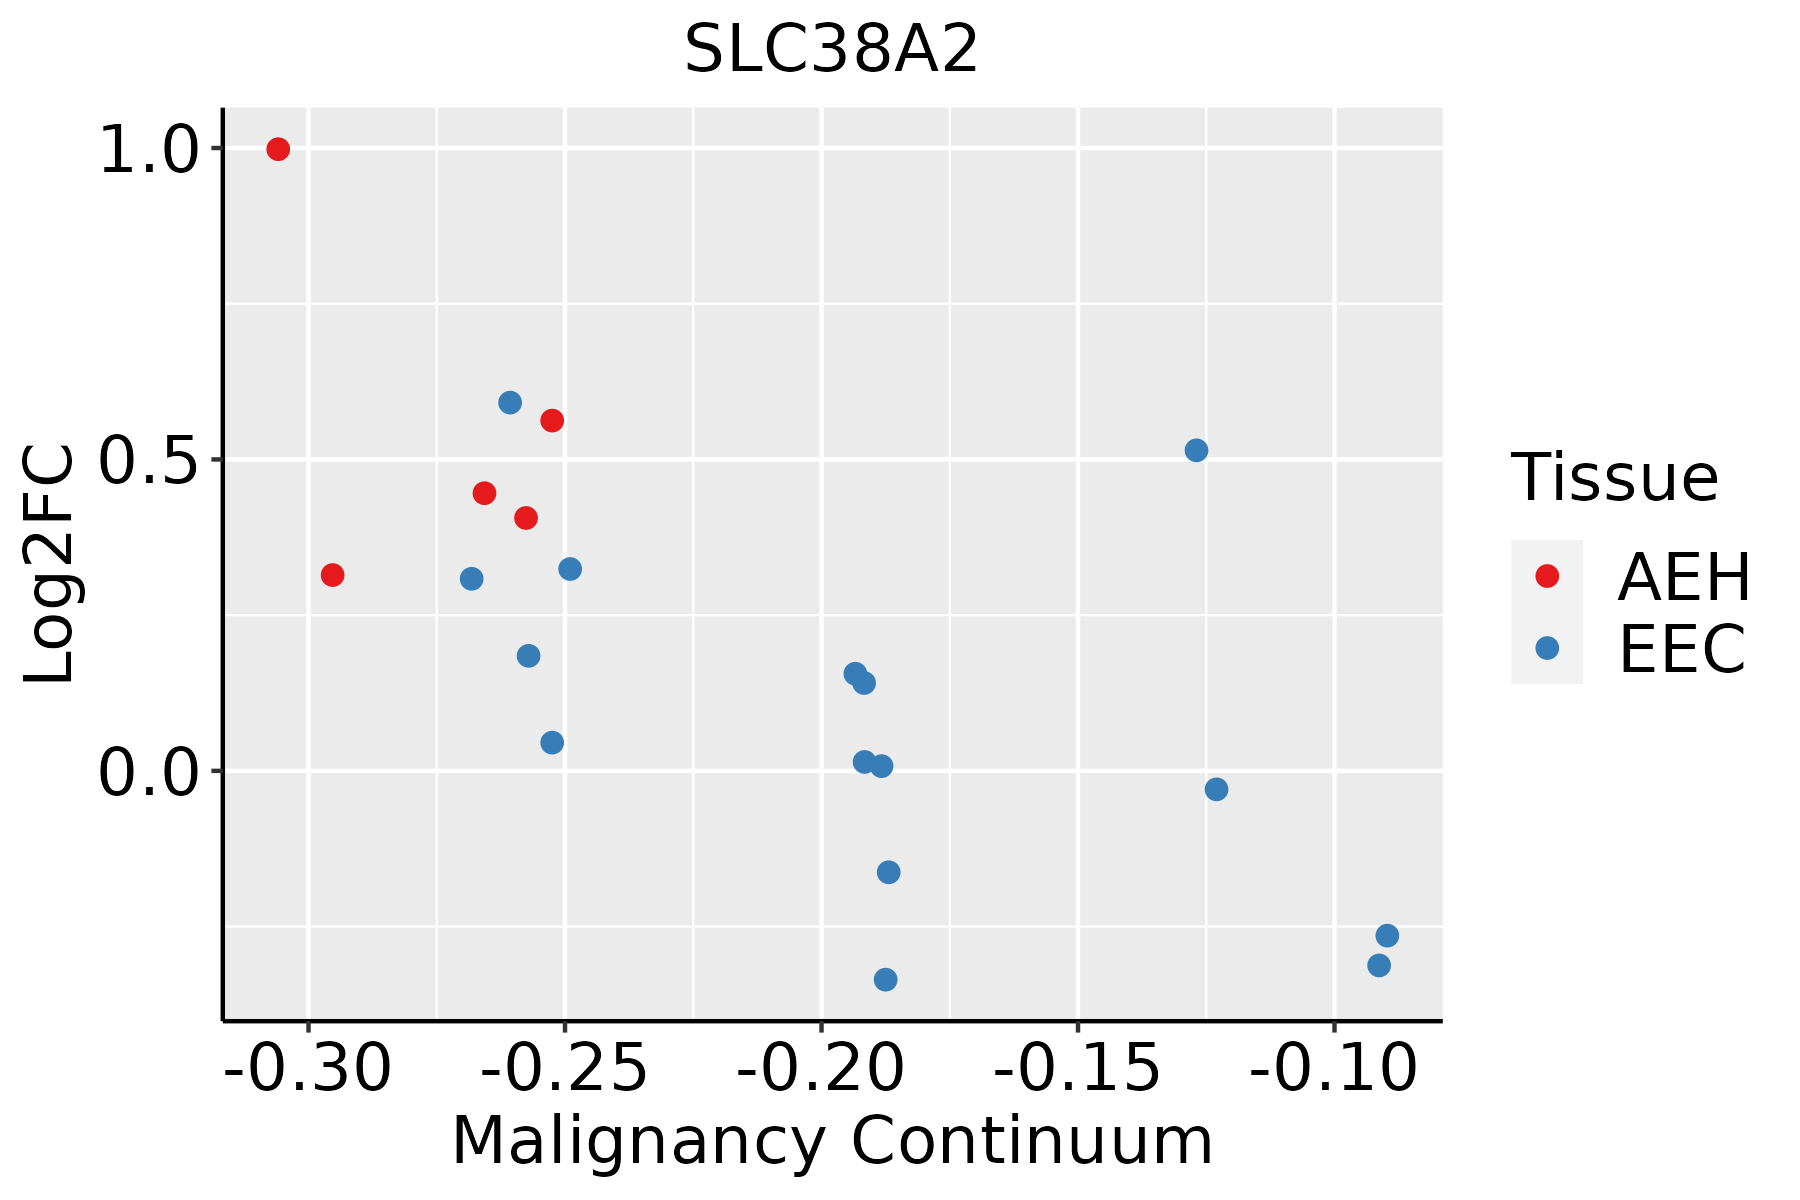 | AEH: Atypical endometrial hyperplasia |
| EEC: Endometrioid Cancer | ||
| Esophagus |  | ESCC: Esophageal squamous cell carcinoma |
| HGIN: High-grade intraepithelial neoplasias | ||
| LGIN: Low-grade intraepithelial neoplasias | ||
| Liver |  | HCC: Hepatocellular carcinoma |
| NAFLD: Non-alcoholic fatty liver disease | ||
| Oral Cavity | 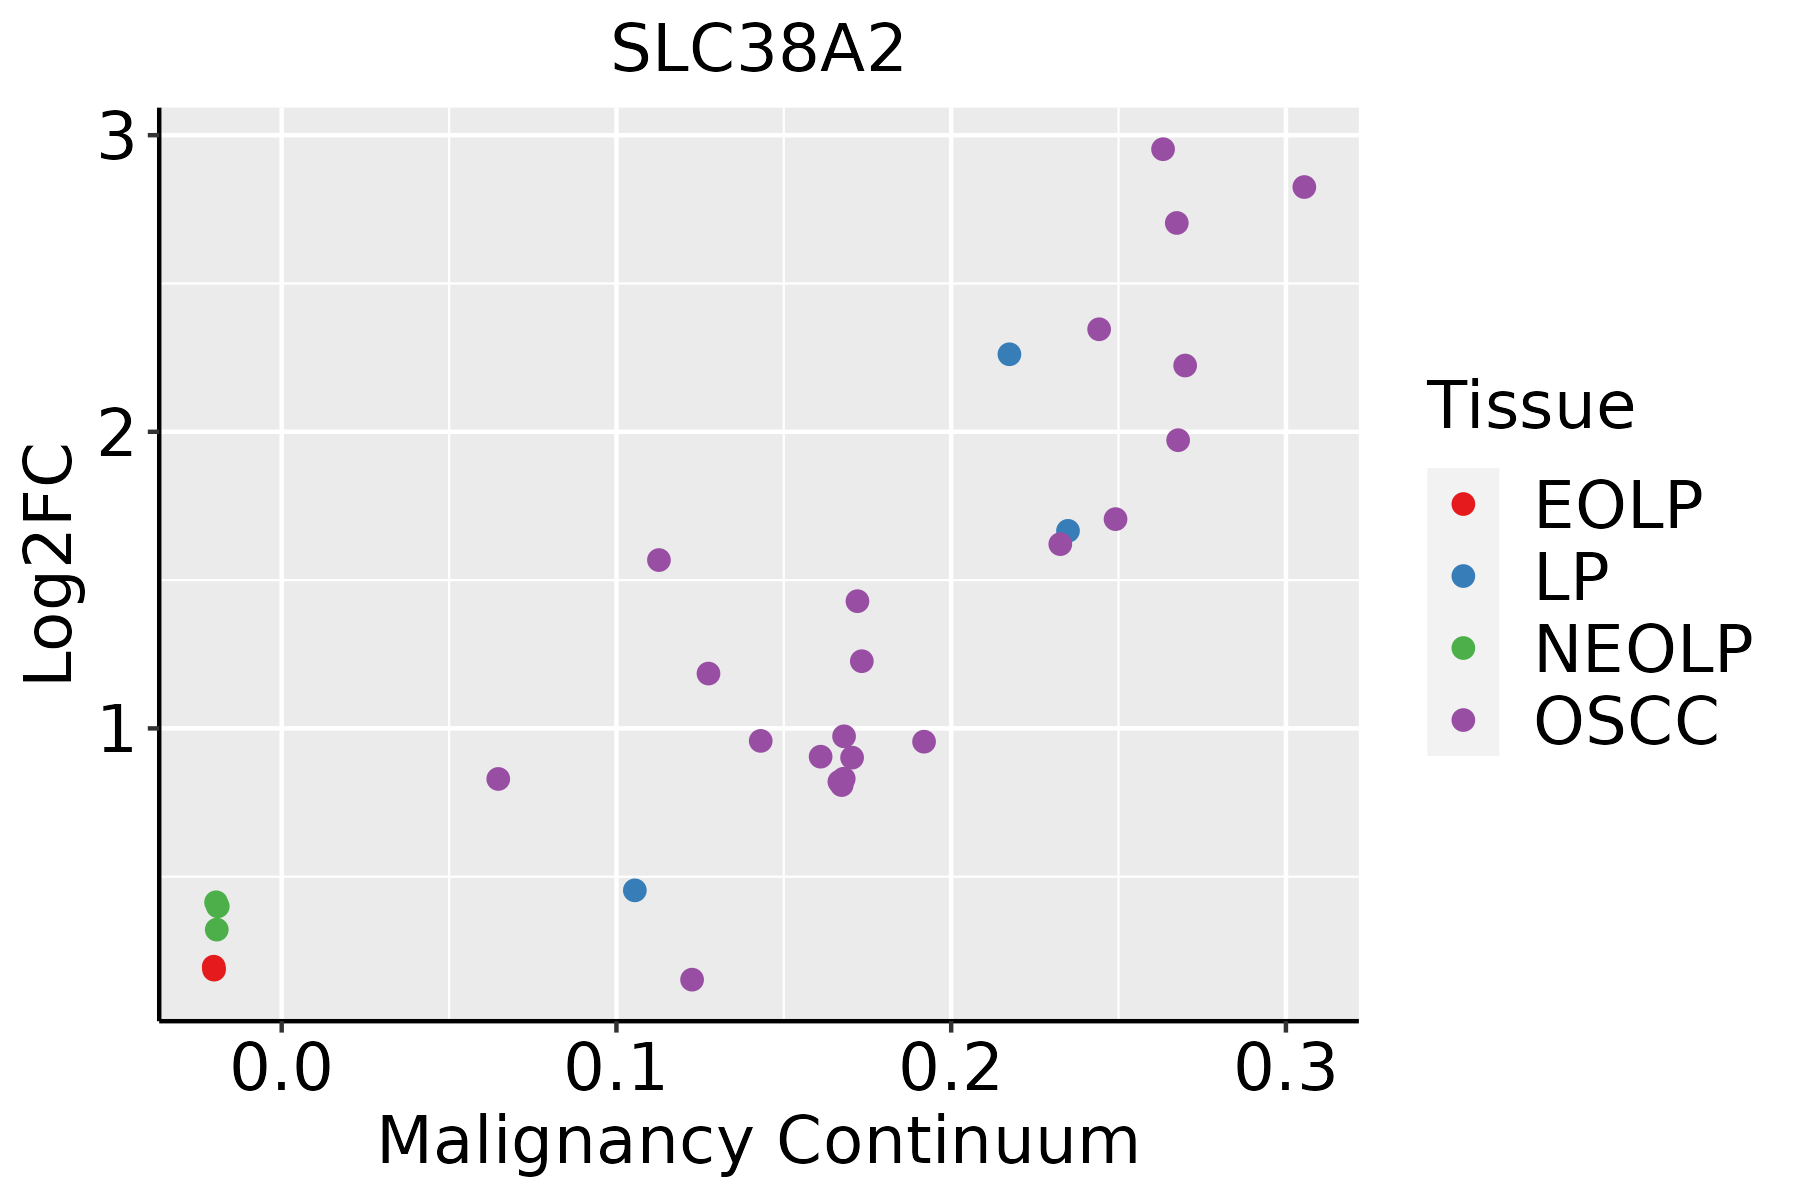 | EOLP: Erosive Oral lichen planus |
| LP: leukoplakia | ||
| NEOLP: Non-erosive oral lichen planus | ||
| OSCC: Oral squamous cell carcinoma | ||
| Prostate |  | BPH: Benign Prostatic Hyperplasia |
| Skin | 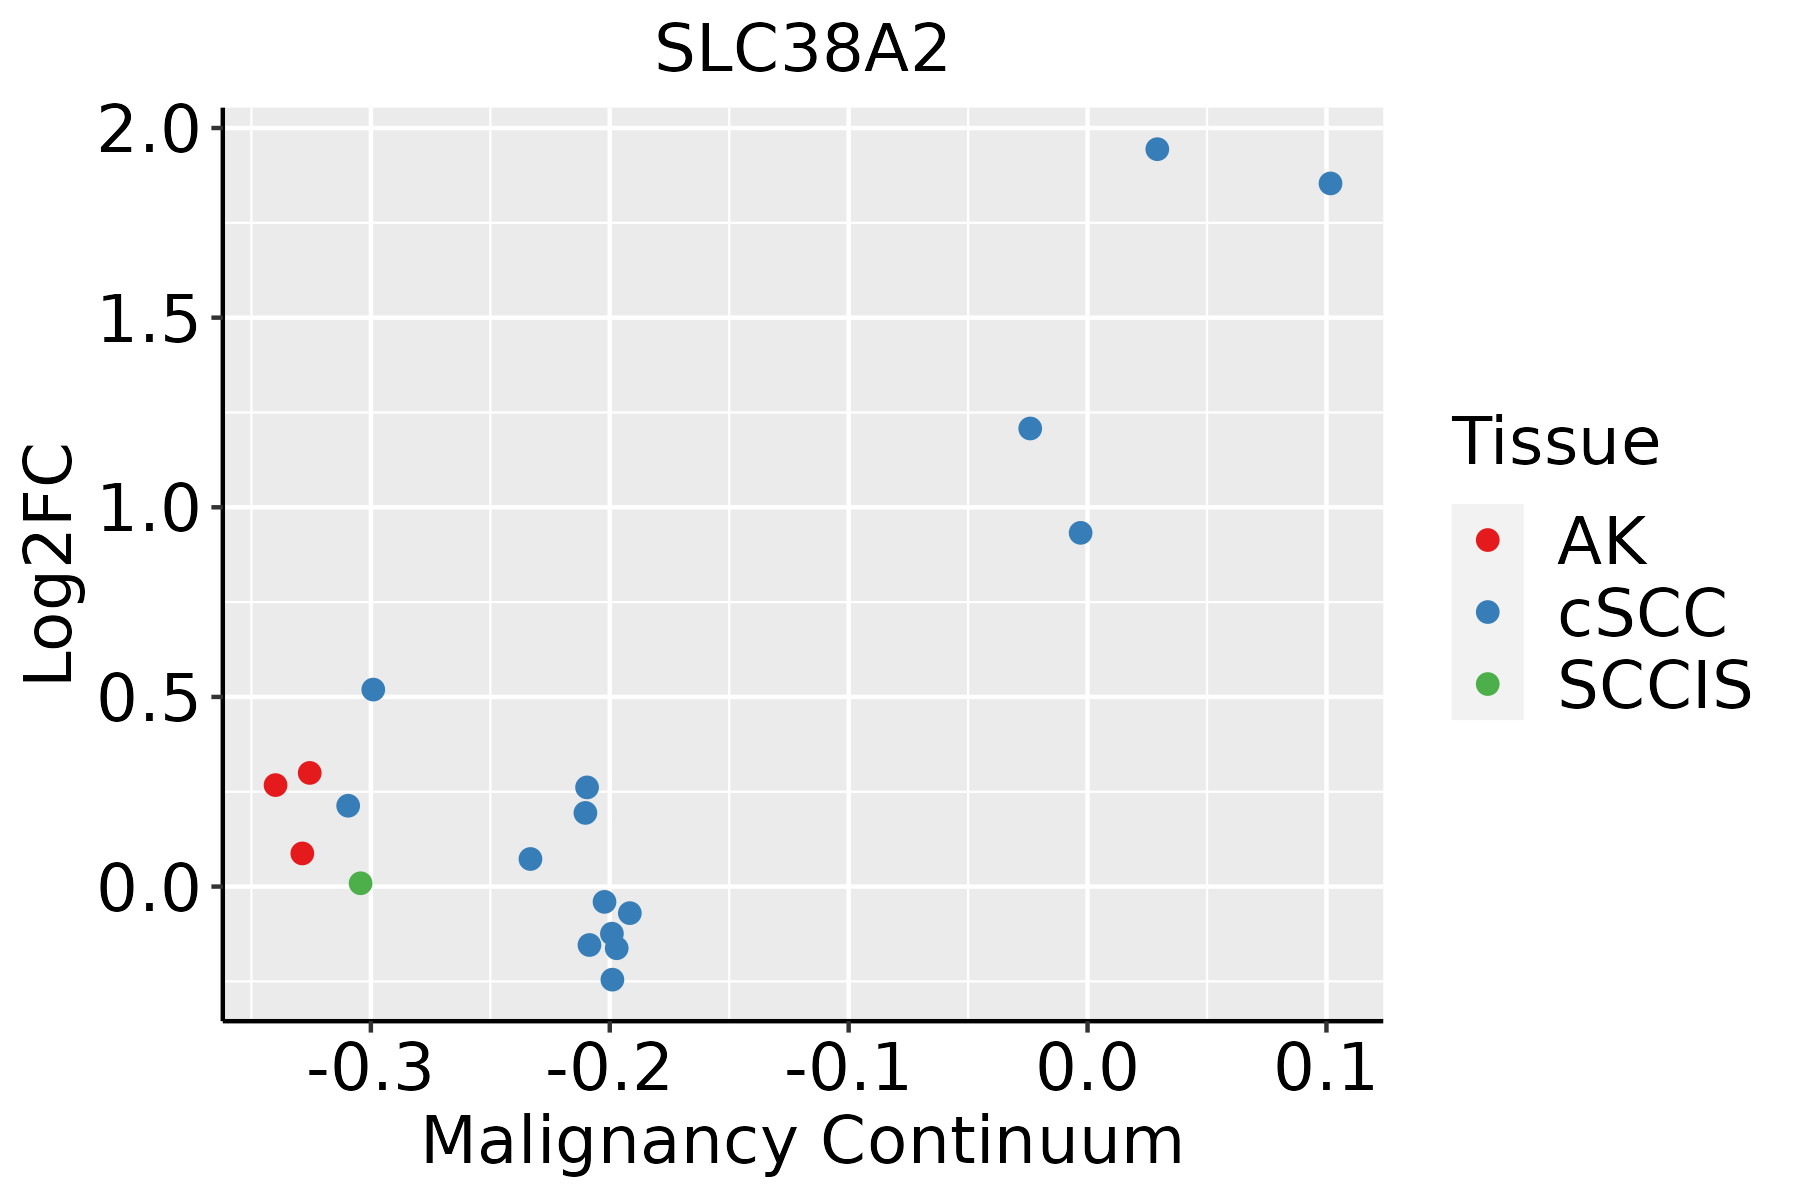 | AK: Actinic keratosis |
| cSCC: Cutaneous squamous cell carcinoma | ||
| SCCIS:squamous cell carcinoma in situ | ||
| Thyroid | 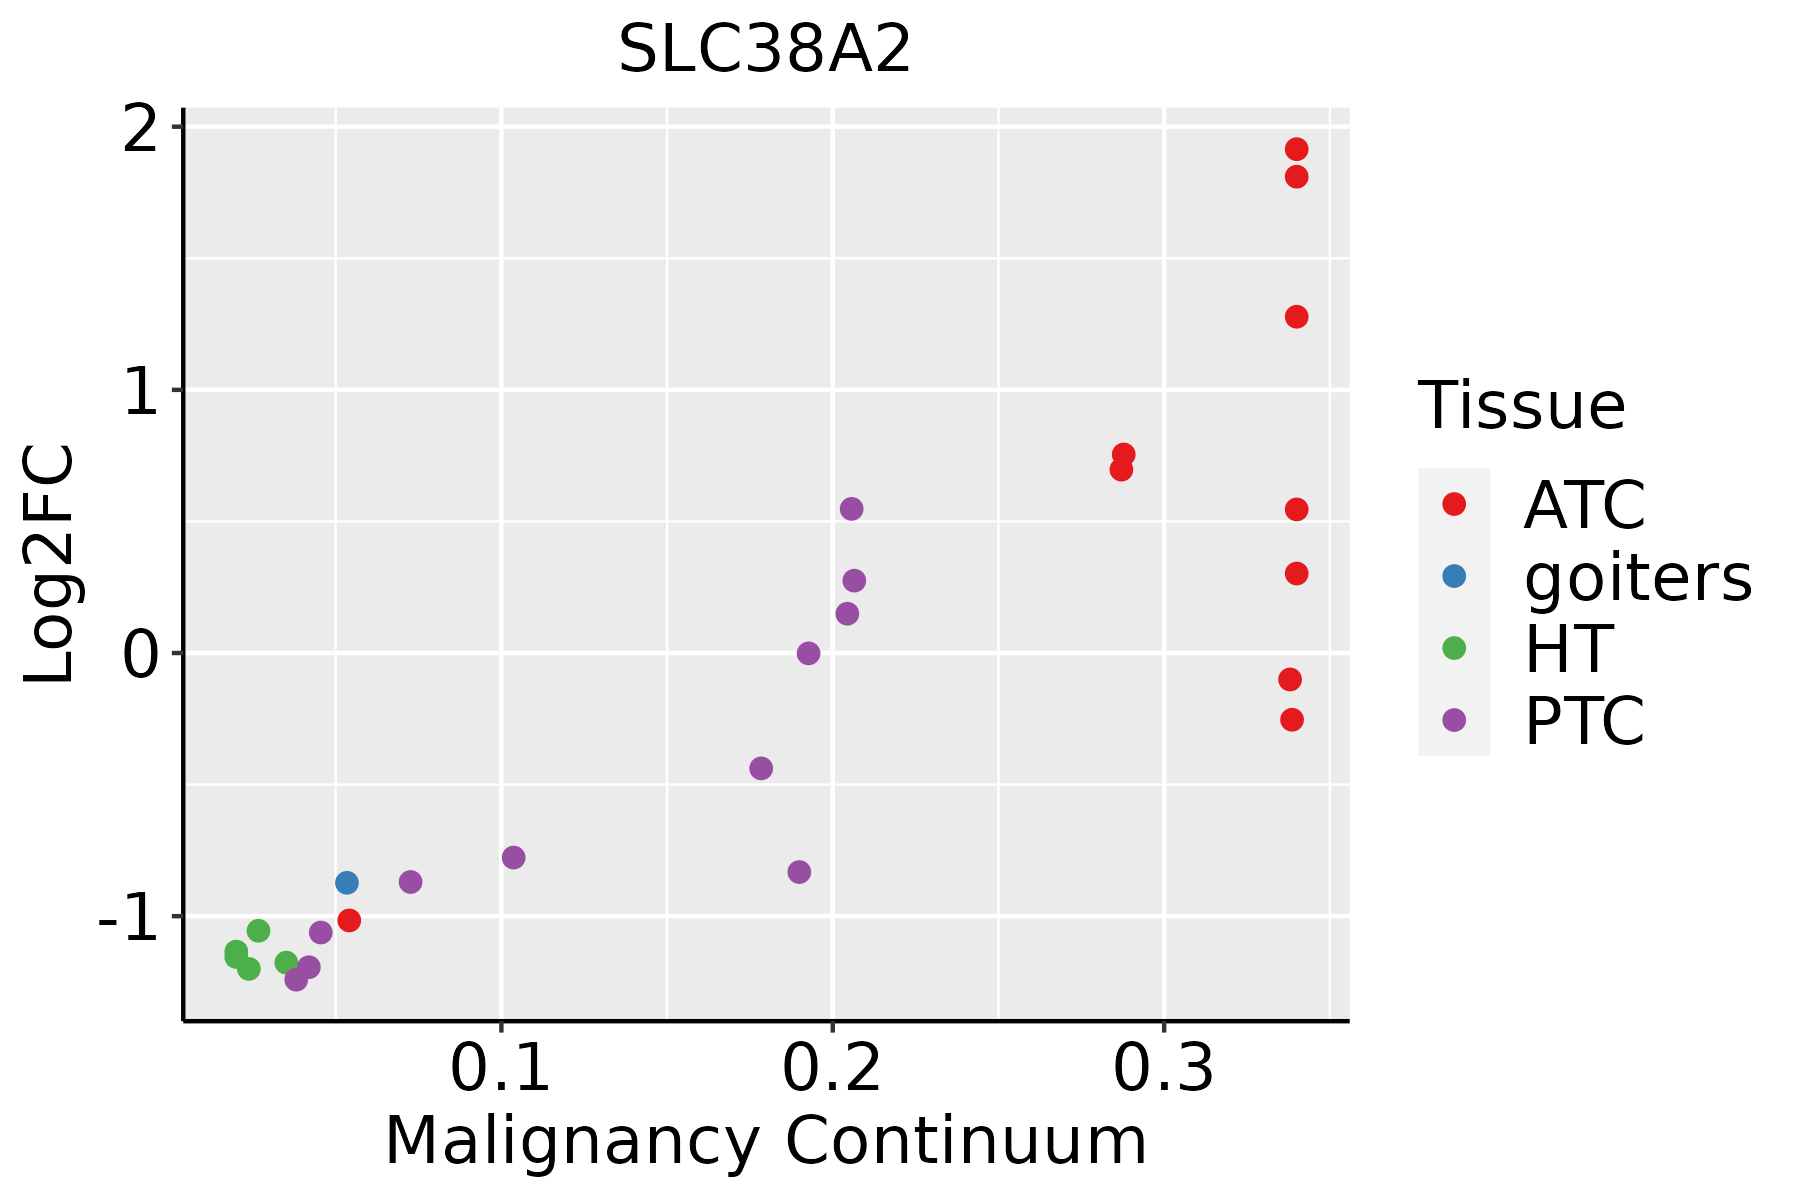 | ATC: Anaplastic thyroid cancer |
| HT: Hashimoto's thyroiditis | ||
| PTC: Papillary thyroid cancer |
| ∗log2FC in expression of this searched gene in stem-like cells from each diseased tissue sample relative to stem-like cells in normal samples in each tissue plotted against the malignancy continuum. Samples are colored based on if they are from different disease stage. |
Top |
Malignant transformation related pathway analysis |
| Find out the enriched GO biological processes and KEGG pathways involved in transition from healthy to precancer to cancer |
| Tissue | Disease Stage | Enriched GO biological Processes |
| Colorectum | AD |  |
| Colorectum | SER |  |
| Colorectum | MSS |  |
| Colorectum | MSI-H |  |
| Colorectum | FAP |  |
| ∗Top 15 enriched GO BP terms are showed in the bar plot of each disease state in each tissue. Each row represents a significant GO biological process which is colored according to the -log10(p.adjust). |
| Page: 1 2 3 4 5 6 7 8 9 |
| GO ID | Tissue | Disease Stage | Description | Gene Ratio | Bg Ratio | pvalue | p.adjust | Count |
| GO:00083809 | Breast | Precancer | RNA splicing | 65/1080 | 434/18723 | 1.27e-12 | 2.53e-10 | 65 |
| GO:00434849 | Breast | Precancer | regulation of RNA splicing | 34/1080 | 148/18723 | 2.66e-12 | 4.75e-10 | 34 |
| GO:00075653 | Breast | Precancer | female pregnancy | 29/1080 | 193/18723 | 2.07e-06 | 7.31e-05 | 29 |
| GO:00447063 | Breast | Precancer | multi-multicellular organism process | 31/1080 | 220/18723 | 3.73e-06 | 1.19e-04 | 31 |
| GO:00712435 | Breast | Precancer | cellular response to arsenic-containing substance | 7/1080 | 20/18723 | 8.31e-05 | 1.61e-03 | 7 |
| GO:00712147 | Breast | Precancer | cellular response to abiotic stimulus | 37/1080 | 331/18723 | 9.12e-05 | 1.73e-03 | 37 |
| GO:01040047 | Breast | Precancer | cellular response to environmental stimulus | 37/1080 | 331/18723 | 9.12e-05 | 1.73e-03 | 37 |
| GO:00331207 | Breast | Precancer | positive regulation of RNA splicing | 9/1080 | 37/18723 | 1.96e-04 | 3.10e-03 | 9 |
| GO:00316679 | Breast | Precancer | response to nutrient levels | 47/1080 | 474/18723 | 2.09e-04 | 3.27e-03 | 47 |
| GO:00714969 | Breast | Precancer | cellular response to external stimulus | 33/1080 | 320/18723 | 9.01e-04 | 1.03e-02 | 33 |
| GO:00316688 | Breast | Precancer | cellular response to extracellular stimulus | 27/1080 | 246/18723 | 1.02e-03 | 1.13e-02 | 27 |
| GO:00092677 | Breast | Precancer | cellular response to starvation | 19/1080 | 156/18723 | 1.65e-03 | 1.67e-02 | 19 |
| GO:00425947 | Breast | Precancer | response to starvation | 22/1080 | 197/18723 | 2.30e-03 | 2.15e-02 | 22 |
| GO:00466855 | Breast | Precancer | response to arsenic-containing substance | 7/1080 | 33/18723 | 2.37e-03 | 2.19e-02 | 7 |
| GO:00096126 | Breast | Precancer | response to mechanical stimulus | 23/1080 | 216/18723 | 3.41e-03 | 2.85e-02 | 23 |
| GO:00316697 | Breast | Precancer | cellular response to nutrient levels | 22/1080 | 215/18723 | 6.58e-03 | 4.53e-02 | 22 |
| GO:000838014 | Breast | IDC | RNA splicing | 73/1434 | 434/18723 | 1.27e-10 | 1.57e-08 | 73 |
| GO:004348414 | Breast | IDC | regulation of RNA splicing | 36/1434 | 148/18723 | 3.32e-10 | 3.77e-08 | 36 |
| GO:000756511 | Breast | IDC | female pregnancy | 39/1434 | 193/18723 | 1.81e-08 | 1.27e-06 | 39 |
| GO:00447061 | Breast | IDC | multi-multicellular organism process | 41/1434 | 220/18723 | 8.58e-08 | 5.19e-06 | 41 |
| Page: 1 2 3 4 5 6 7 8 9 10 11 12 13 14 15 16 17 18 19 20 |
| Pathway ID | Tissue | Disease Stage | Description | Gene Ratio | Bg Ratio | pvalue | p.adjust | qvalue | Count |
| Page: 1 |
Top |
Cell-cell communication analysis |
| Identification of potential cell-cell interactions between two cell types and their ligand-receptor pairs for different disease states |
| Ligand | Receptor | LRpair | Pathway | Tissue | Disease Stage |
| Page: 1 |
Top |
Single-cell gene regulatory network inference analysis |
| Find out the significant the regulons (TFs) and the target genes of each regulon across cell types for different disease states |
| TF | Cell Type | Tissue | Disease Stage | Target Gene | RSS | Regulon Activity |
| ∗The dot plots of a searched regulon are shown for all cell subpopulations in each disease state of each tissue based on the regulon specific score inferred using pySCENIC and by calculating the average expression. |
| Page: 1 |
Top |
Somatic mutation of malignant transformation related genes |
| Annotation of somatic variants for genes involved in malignant transformation |
| Hugo Symbol | Variant Class | Variant Classification | dbSNP RS | HGVSc | HGVSp | HGVSp Short | SWISSPROT | BIOTYPE | SIFT | PolyPhen | Tumor Sample Barcode | Tissue | Histology | Sex | Age | Stage | Therapy Types | Drugs | Outcome |
| SLC38A2 | SNV | Missense_Mutation | c.501N>A | p.Phe167Leu | p.F167L | Q96QD8 | protein_coding | tolerated(0.12) | benign(0.248) | TCGA-AN-A046-01 | Breast | breast invasive carcinoma | Female | >=65 | I/II | Unknown | Unknown | SD | |
| SLC38A2 | SNV | Missense_Mutation | c.527T>C | p.Val176Ala | p.V176A | Q96QD8 | protein_coding | tolerated(0.22) | probably_damaging(0.996) | TCGA-D8-A1XQ-01 | Breast | breast invasive carcinoma | Female | >=65 | I/II | Unknown | Unknown | SD | |
| SLC38A2 | SNV | Missense_Mutation | novel | c.23N>A | p.Arg8Gln | p.R8Q | Q96QD8 | protein_coding | tolerated(0.14) | benign(0.078) | TCGA-D8-A73U-01 | Breast | breast invasive carcinoma | Female | >=65 | I/II | Hormone Therapy | tamoxiphen | SD |
| SLC38A2 | insertion | Frame_Shift_Ins | novel | c.11_12insATCTCCAAGATACTTCAAATATGTATGTGCAGGTA | p.Glu5SerfsTer45 | p.E5Sfs*45 | Q96QD8 | protein_coding | TCGA-A8-A06X-01 | Breast | breast invasive carcinoma | Female | >=65 | I/II | Unknown | Unknown | SD | ||
| SLC38A2 | SNV | Missense_Mutation | c.1476N>C | p.Leu492Phe | p.L492F | Q96QD8 | protein_coding | tolerated(0.78) | probably_damaging(0.994) | TCGA-DR-A0ZM-01 | Cervix | cervical & endocervical cancer | Female | <65 | III/IV | Unspecific | Cisplatin | SD | |
| SLC38A2 | SNV | Missense_Mutation | rs771981553 | c.1126N>T | p.Arg376Cys | p.R376C | Q96QD8 | protein_coding | deleterious(0) | probably_damaging(0.999) | TCGA-IR-A3LK-01 | Cervix | cervical & endocervical cancer | Female | >=65 | I/II | Chemotherapy | cisplatin | PD |
| SLC38A2 | SNV | Missense_Mutation | rs773343163 | c.1297N>G | p.Thr433Ala | p.T433A | Q96QD8 | protein_coding | deleterious(0.04) | benign(0.223) | TCGA-AA-3664-01 | Colorectum | colon adenocarcinoma | Female | >=65 | I/II | Unknown | Unknown | SD |
| SLC38A2 | SNV | Missense_Mutation | novel | c.319N>A | p.Leu107Ile | p.L107I | Q96QD8 | protein_coding | deleterious(0.01) | probably_damaging(0.998) | TCGA-F5-6814-01 | Colorectum | rectum adenocarcinoma | Male | <65 | I/II | Unknown | Unknown | SD |
| SLC38A2 | insertion | Frame_Shift_Ins | novel | c.994_995insGTTTTTGTTTTTG | p.Phe332CysfsTer28 | p.F332Cfs*28 | Q96QD8 | protein_coding | TCGA-AM-5820-01 | Colorectum | colon adenocarcinoma | Female | <65 | I/II | Unknown | Unknown | SD | ||
| SLC38A2 | insertion | Frame_Shift_Ins | novel | c.14_15insTAGCAAATTAAAGC | p.Glu5AspfsTer38 | p.E5Dfs*38 | Q96QD8 | protein_coding | TCGA-AM-5820-01 | Colorectum | colon adenocarcinoma | Female | <65 | I/II | Unknown | Unknown | SD |
| Page: 1 2 3 4 5 |
Top |
Related drugs of malignant transformation related genes |
| Identification of chemicals and drugs interact with genes involved in malignant transfromation |
| (DGIdb 4.0) |
| Entrez ID | Symbol | Category | Interaction Types | Drug Claim Name | Drug Name | PMIDs |
| 54407 | SLC38A2 | TRANSPORTER | 178101264 | |||
| 54407 | SLC38A2 | TRANSPORTER | 178101263 |
| Page: 1 |

Copyright 2023-Present -The University of Texas Health Science Center at Houston |