
|
|||||
|
 | |
| |
| |
| |
| |
| |
|
Gene: SLC38A10 |
Gene summary for SLC38A10 |
| Gene information | Species | Human | Gene symbol | SLC38A10 | Gene ID | 124565 |
| Gene name | solute carrier family 38 member 10 | |
| Gene Alias | PP1744 | |
| Cytomap | 17q25.3 | |
| Gene Type | protein-coding | GO ID | GO:0001501 | UniProtAcc | Q9HBR0 |
Top |
Malignant transformation analysis |
| Identification of the aberrant gene expression in precancerous and cancerous lesions by comparing the gene expression of stem-like cells in diseased tissues with normal stem cells |
| Entrez ID | Symbol | Replicates | Species | Organ | Tissue | Adj P-value | Log2FC | Malignancy |
| 124565 | SLC38A10 | HTA11_2487_2000001011 | Human | Colorectum | SER | 9.51e-05 | 3.24e-01 | -0.1808 |
| 124565 | SLC38A10 | HTA11_1938_2000001011 | Human | Colorectum | AD | 4.54e-02 | 2.08e-01 | -0.0811 |
| 124565 | SLC38A10 | HTA11_347_2000001011 | Human | Colorectum | AD | 2.33e-03 | 2.66e-01 | -0.1954 |
| 124565 | SLC38A10 | HTA11_696_2000001011 | Human | Colorectum | AD | 8.00e-10 | 4.95e-01 | -0.1464 |
| 124565 | SLC38A10 | HTA11_1391_2000001011 | Human | Colorectum | AD | 4.78e-03 | 3.10e-01 | -0.059 |
| 124565 | SLC38A10 | HTA11_546_2000001011 | Human | Colorectum | AD | 1.75e-02 | 4.14e-01 | -0.0842 |
| 124565 | SLC38A10 | HTA11_7696_3000711011 | Human | Colorectum | AD | 1.57e-03 | 2.68e-01 | 0.0674 |
| 124565 | SLC38A10 | HTA11_99999965062_69753 | Human | Colorectum | MSI-H | 8.26e-03 | 6.64e-01 | 0.3487 |
| 124565 | SLC38A10 | HTA11_99999974143_84620 | Human | Colorectum | MSS | 9.08e-07 | 4.49e-01 | 0.3005 |
| 124565 | SLC38A10 | A015-C-203 | Human | Colorectum | FAP | 1.71e-02 | 1.09e-01 | -0.1294 |
| 124565 | SLC38A10 | A015-C-104 | Human | Colorectum | FAP | 1.82e-04 | 6.55e-03 | -0.1899 |
| 124565 | SLC38A10 | A002-C-116 | Human | Colorectum | FAP | 1.17e-03 | -2.98e-02 | -0.0452 |
| 124565 | SLC38A10 | LZE2T | Human | Esophagus | ESCC | 2.29e-02 | 6.46e-01 | 0.082 |
| 124565 | SLC38A10 | LZE7T | Human | Esophagus | ESCC | 7.09e-10 | 2.43e-01 | 0.0667 |
| 124565 | SLC38A10 | LZE22D1 | Human | Esophagus | HGIN | 1.06e-02 | 1.82e-01 | 0.0595 |
| 124565 | SLC38A10 | LZE24T | Human | Esophagus | ESCC | 6.84e-21 | 4.96e-01 | 0.0596 |
| 124565 | SLC38A10 | LZE21T | Human | Esophagus | ESCC | 3.54e-07 | 4.94e-01 | 0.0655 |
| 124565 | SLC38A10 | P1T-E | Human | Esophagus | ESCC | 1.06e-08 | 4.03e-01 | 0.0875 |
| 124565 | SLC38A10 | P2T-E | Human | Esophagus | ESCC | 1.13e-22 | 2.56e-01 | 0.1177 |
| 124565 | SLC38A10 | P4T-E | Human | Esophagus | ESCC | 9.28e-11 | 2.84e-01 | 0.1323 |
| Page: 1 2 3 4 5 6 7 |
| Tissue | Expression Dynamics | Abbreviation |
| Colorectum (GSE201348) |  | FAP: Familial adenomatous polyposis |
| CRC: Colorectal cancer | ||
| Colorectum (HTA11) |  | AD: Adenomas |
| SER: Sessile serrated lesions | ||
| MSI-H: Microsatellite-high colorectal cancer | ||
| MSS: Microsatellite stable colorectal cancer | ||
| Esophagus | 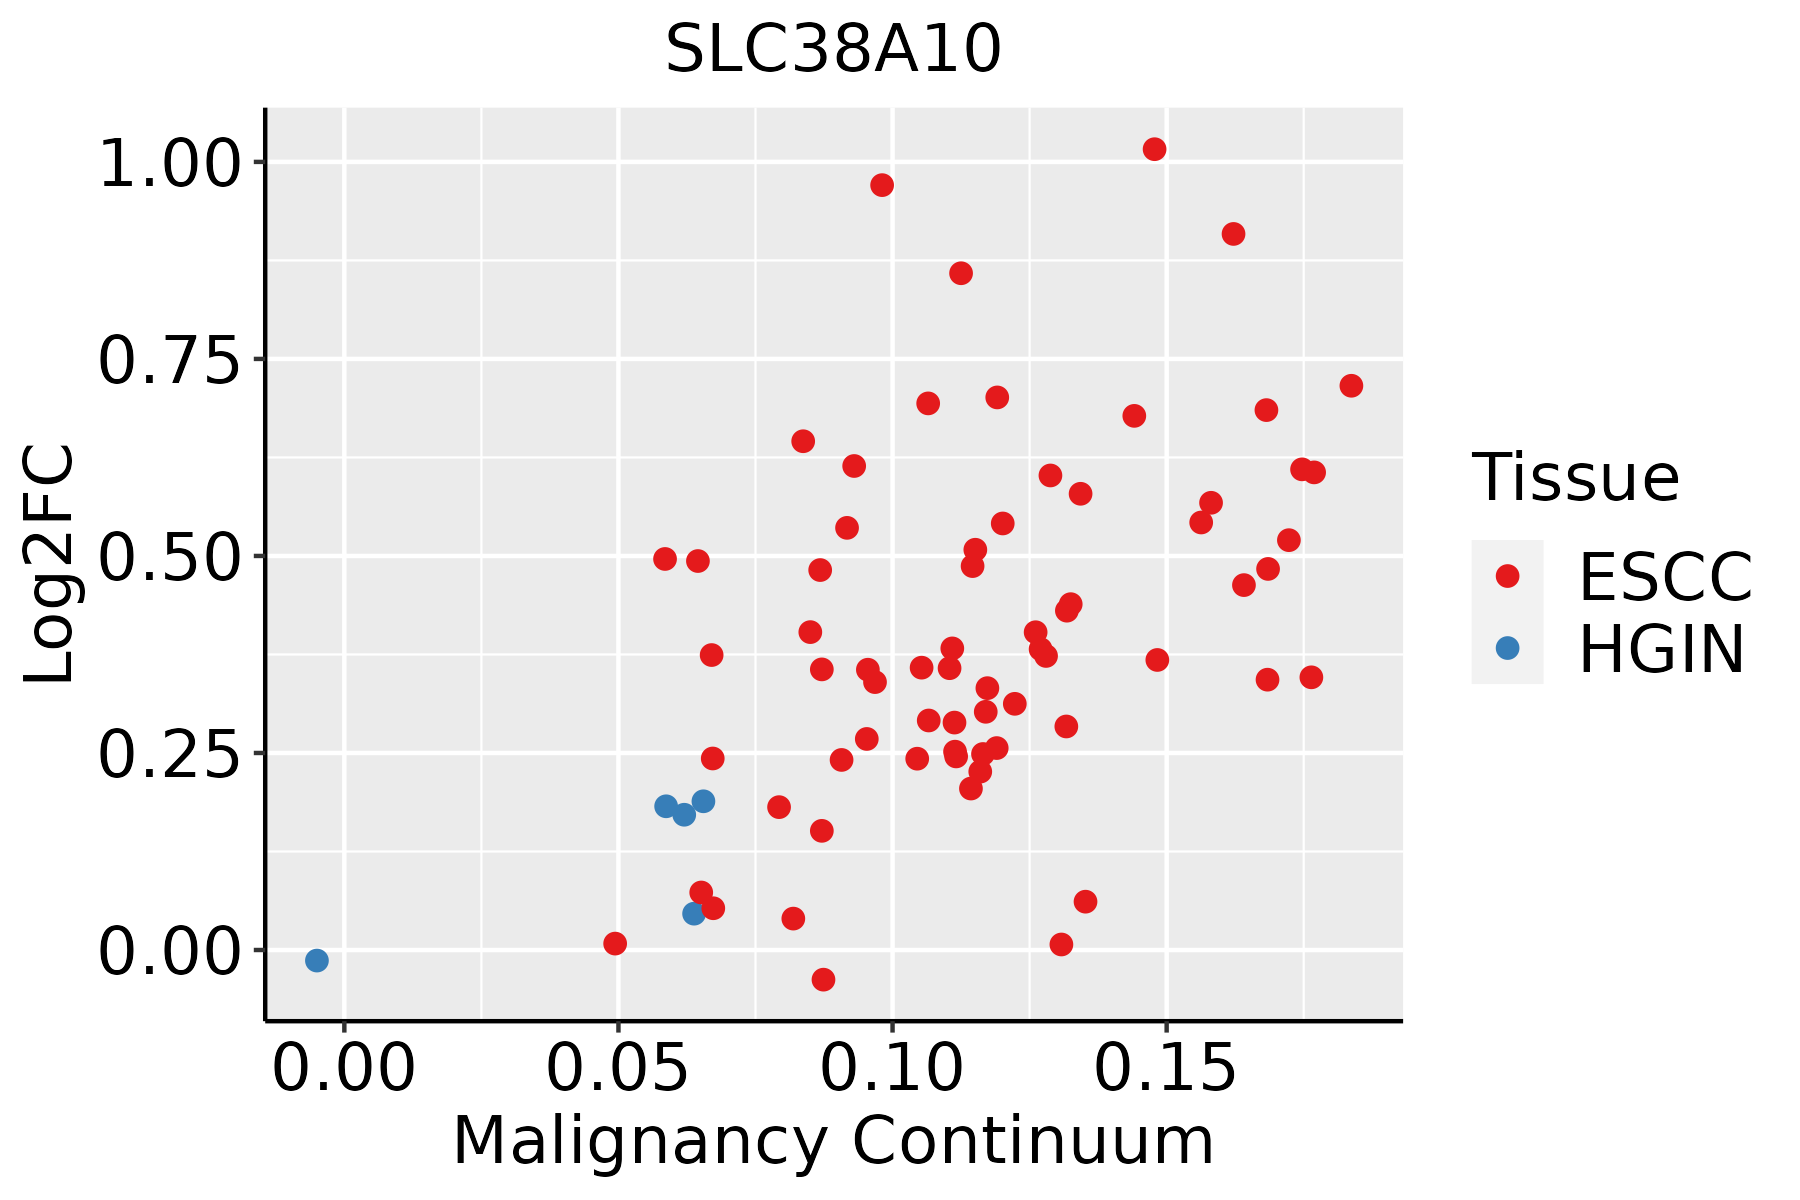 | ESCC: Esophageal squamous cell carcinoma |
| HGIN: High-grade intraepithelial neoplasias | ||
| LGIN: Low-grade intraepithelial neoplasias | ||
| Liver | 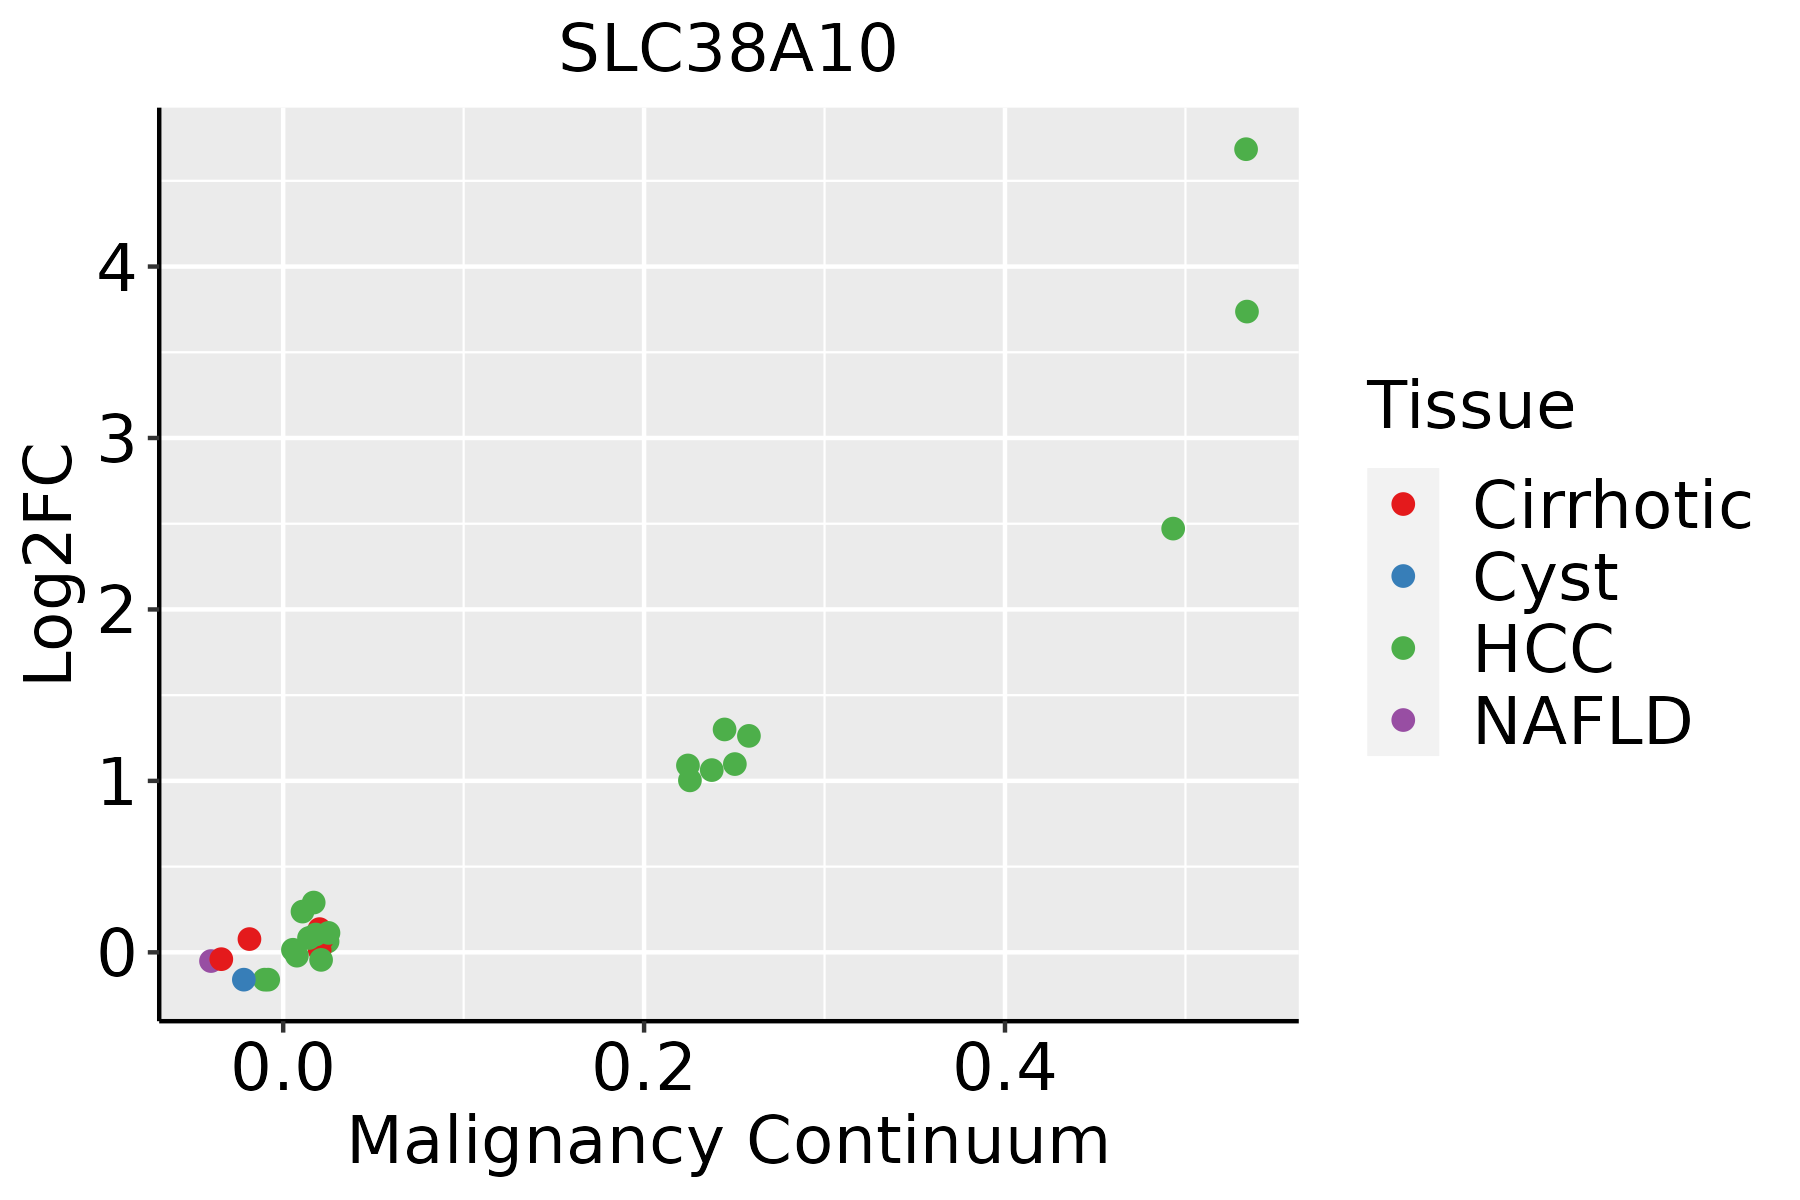 | HCC: Hepatocellular carcinoma |
| NAFLD: Non-alcoholic fatty liver disease | ||
| Oral Cavity | 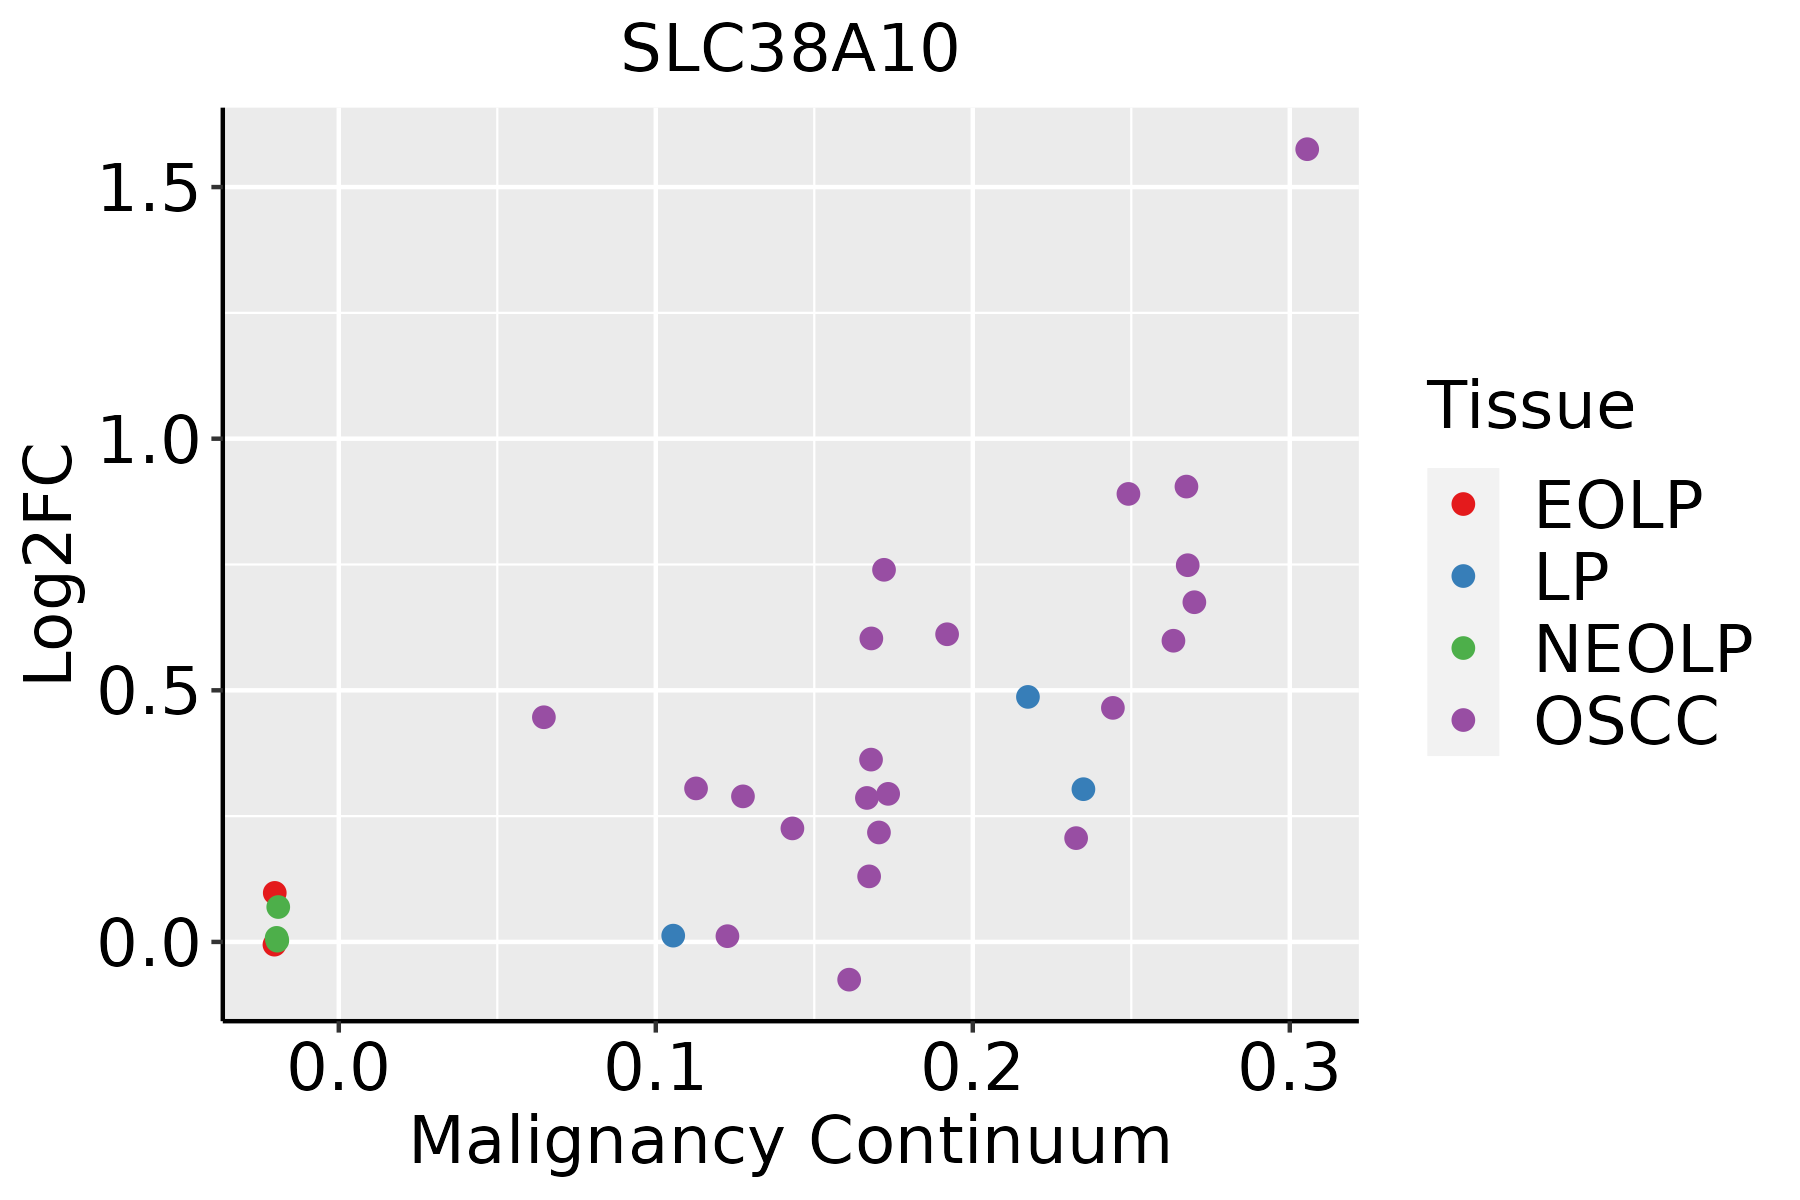 | EOLP: Erosive Oral lichen planus |
| LP: leukoplakia | ||
| NEOLP: Non-erosive oral lichen planus | ||
| OSCC: Oral squamous cell carcinoma | ||
| Prostate | 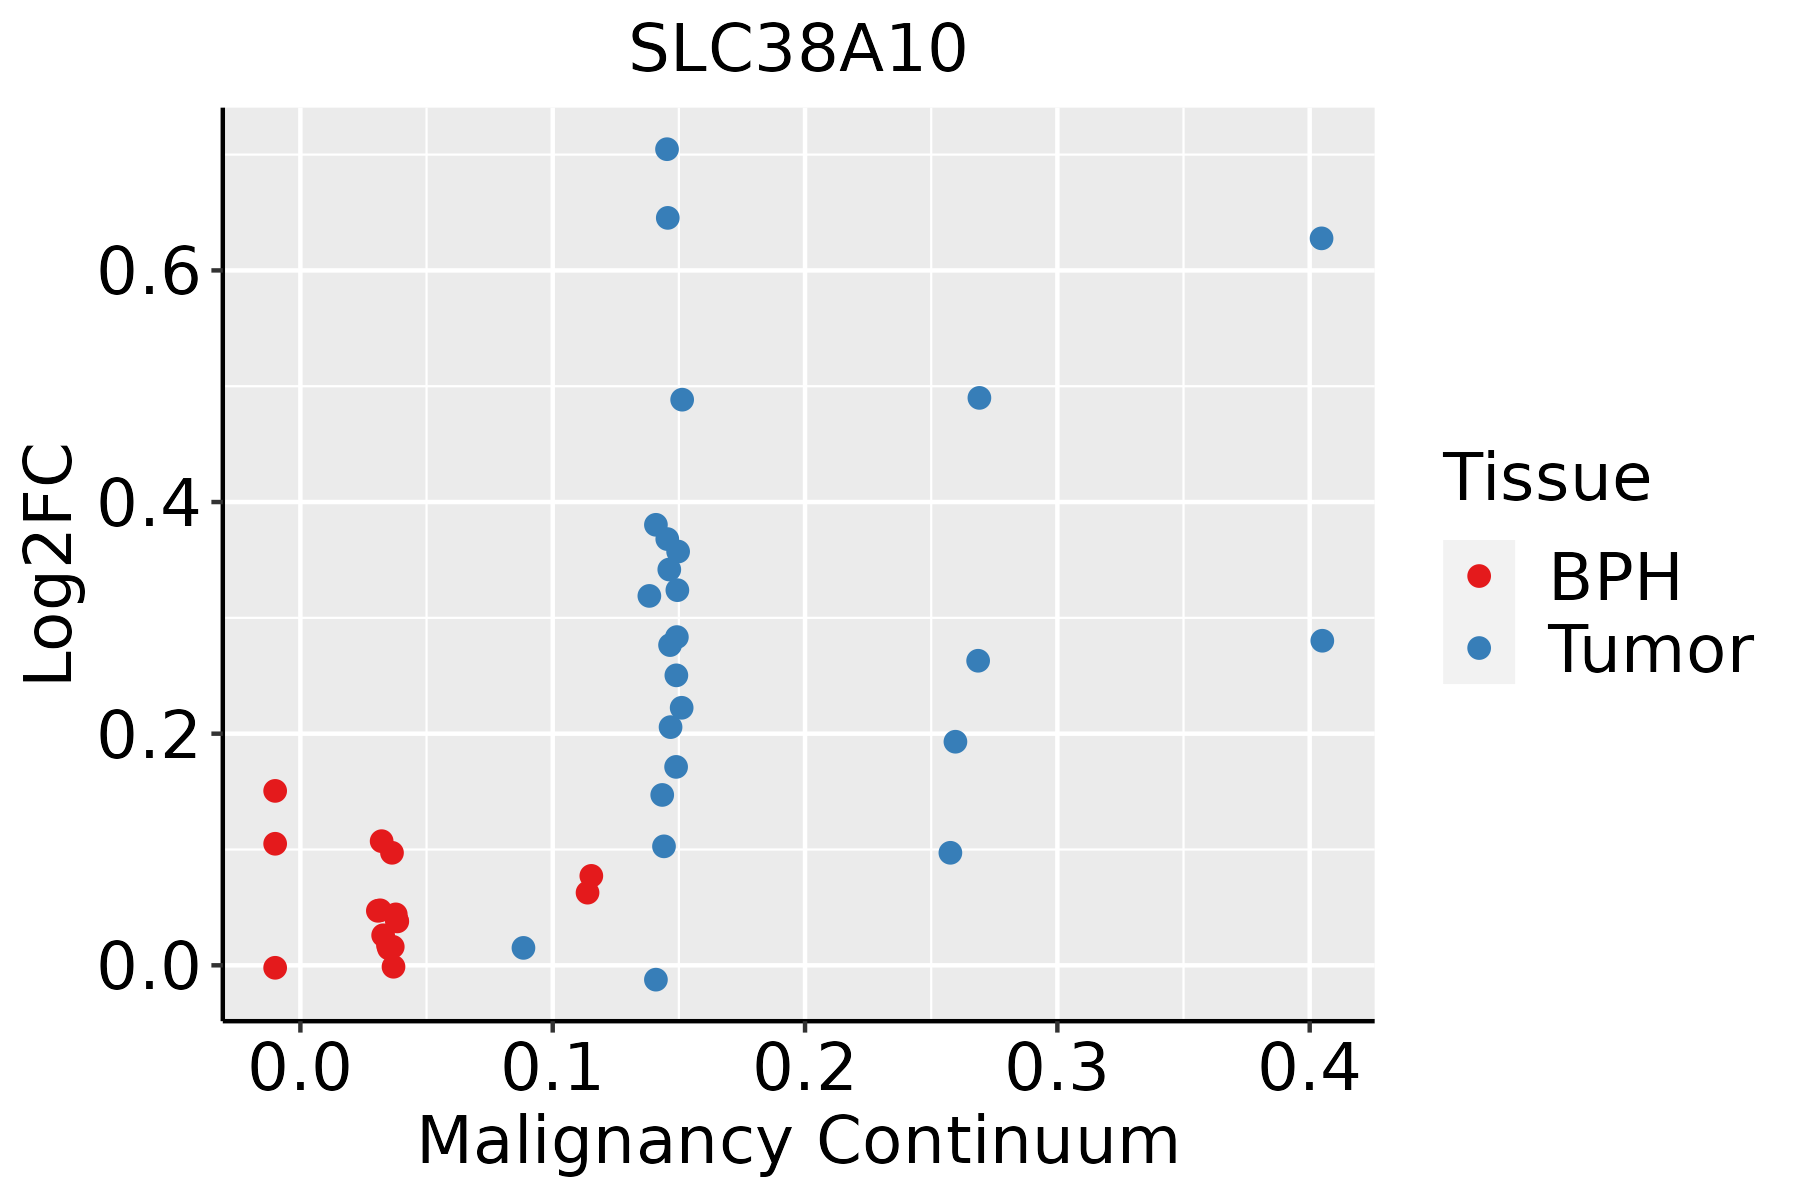 | BPH: Benign Prostatic Hyperplasia |
| Skin | 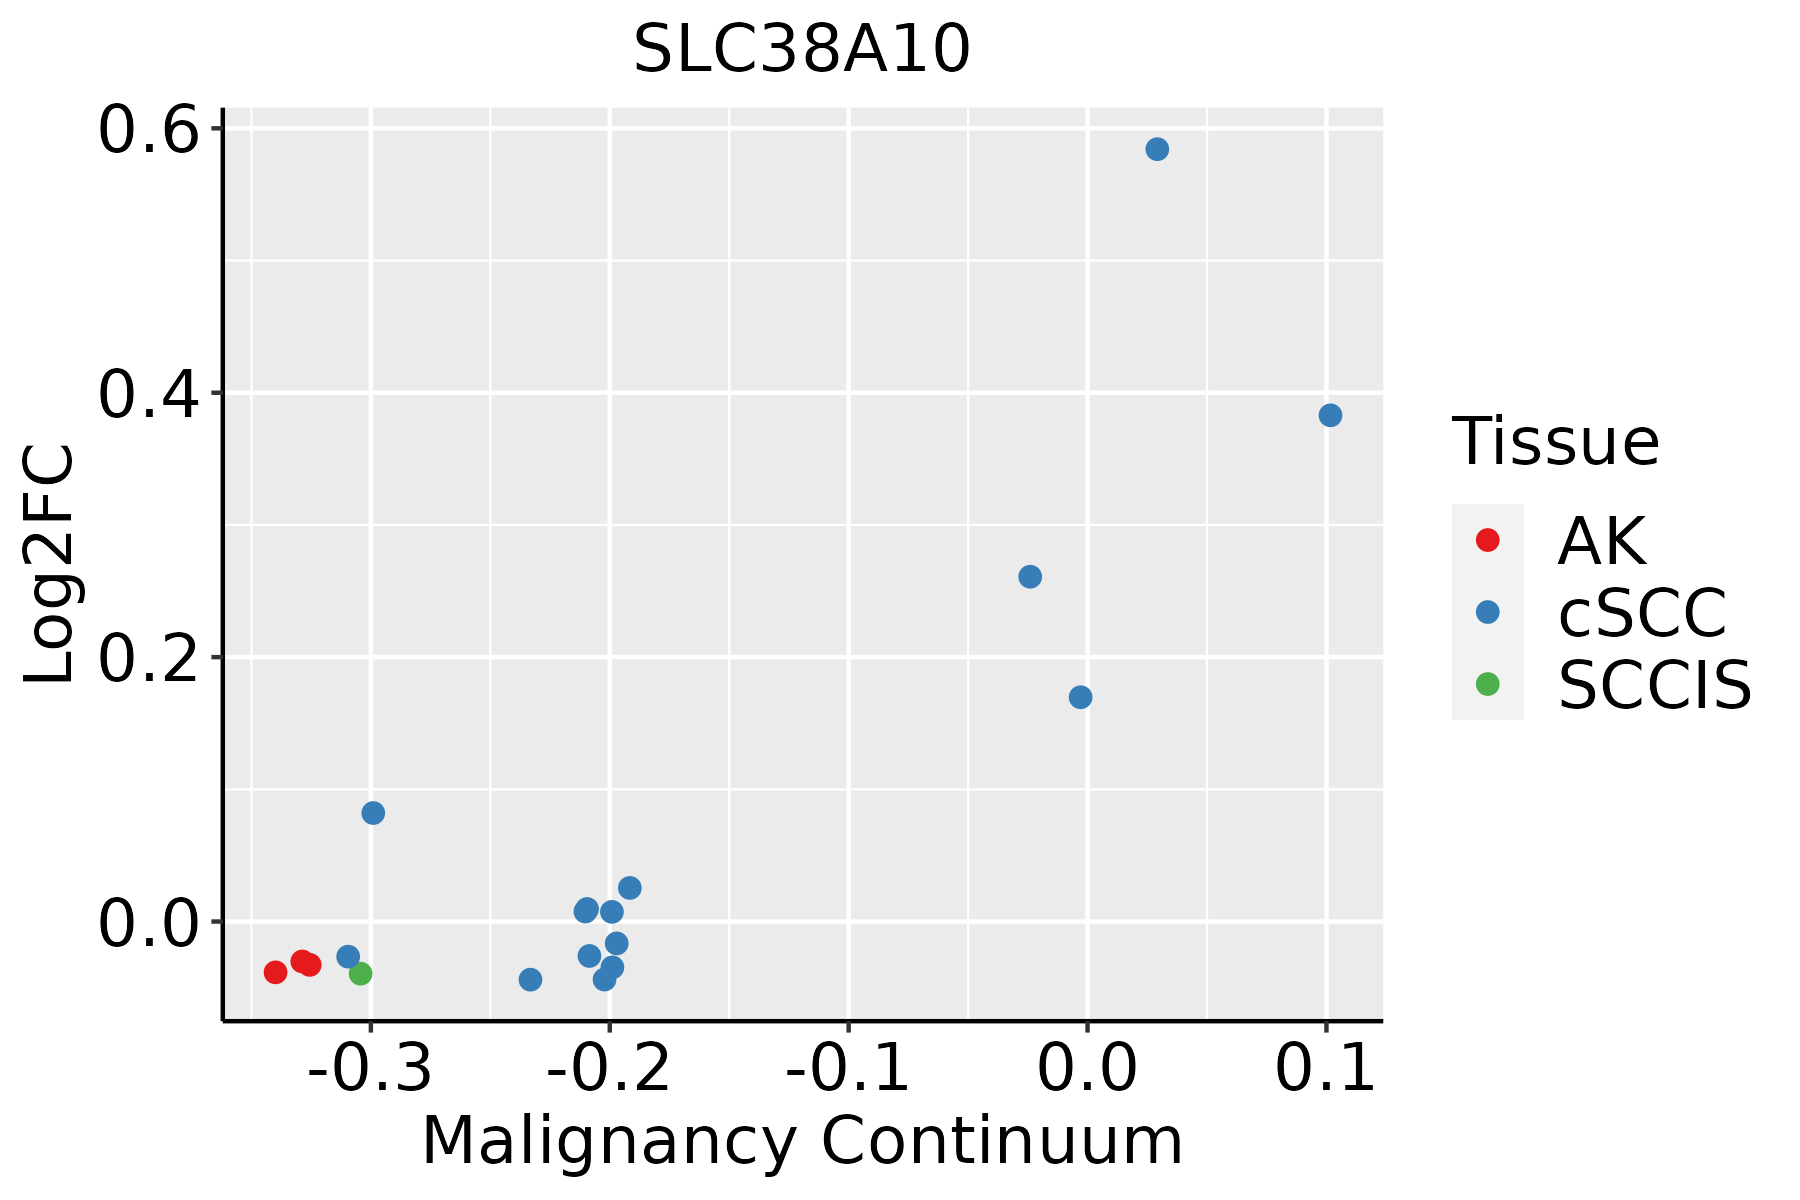 | AK: Actinic keratosis |
| cSCC: Cutaneous squamous cell carcinoma | ||
| SCCIS:squamous cell carcinoma in situ | ||
| Thyroid |  | ATC: Anaplastic thyroid cancer |
| HT: Hashimoto's thyroiditis | ||
| PTC: Papillary thyroid cancer |
| ∗log2FC in expression of this searched gene in stem-like cells from each diseased tissue sample relative to stem-like cells in normal samples in each tissue plotted against the malignancy continuum. Samples are colored based on if they are from different disease stage. |
Top |
Malignant transformation related pathway analysis |
| Find out the enriched GO biological processes and KEGG pathways involved in transition from healthy to precancer to cancer |
| Tissue | Disease Stage | Enriched GO biological Processes |
| Colorectum | AD |  |
| Colorectum | SER |  |
| Colorectum | MSS |  |
| Colorectum | MSI-H |  |
| Colorectum | FAP |  |
| ∗Top 15 enriched GO BP terms are showed in the bar plot of each disease state in each tissue. Each row represents a significant GO biological process which is colored according to the -log10(p.adjust). |
| Page: 1 2 3 4 5 6 7 8 9 |
| GO ID | Tissue | Disease Stage | Description | Gene Ratio | Bg Ratio | pvalue | p.adjust | Count |
| GO:0006814 | Colorectum | FAP | sodium ion transport | 54/2622 | 245/18723 | 3.98e-04 | 4.85e-03 | 54 |
| GO:00603485 | Esophagus | ESCC | bone development | 115/8552 | 205/18723 | 1.67e-03 | 7.72e-03 | 115 |
| GO:00603484 | Oral cavity | OSCC | bone development | 99/7305 | 205/18723 | 4.13e-03 | 1.68e-02 | 99 |
| GO:00603483 | Prostate | BPH | bone development | 50/3107 | 205/18723 | 2.60e-03 | 1.39e-02 | 50 |
| GO:006034811 | Prostate | Tumor | bone development | 50/3246 | 205/18723 | 6.30e-03 | 2.89e-02 | 50 |
| GO:00603486 | Thyroid | PTC | bone development | 90/5968 | 205/18723 | 1.89e-04 | 1.42e-03 | 90 |
| GO:006034813 | Thyroid | ATC | bone development | 102/6293 | 205/18723 | 1.18e-06 | 1.52e-05 | 102 |
| Page: 1 |
| Pathway ID | Tissue | Disease Stage | Description | Gene Ratio | Bg Ratio | pvalue | p.adjust | qvalue | Count |
| Page: 1 |
Top |
Cell-cell communication analysis |
| Identification of potential cell-cell interactions between two cell types and their ligand-receptor pairs for different disease states |
| Ligand | Receptor | LRpair | Pathway | Tissue | Disease Stage |
| Page: 1 |
Top |
Single-cell gene regulatory network inference analysis |
| Find out the significant the regulons (TFs) and the target genes of each regulon across cell types for different disease states |
| TF | Cell Type | Tissue | Disease Stage | Target Gene | RSS | Regulon Activity |
| ∗The dot plots of a searched regulon are shown for all cell subpopulations in each disease state of each tissue based on the regulon specific score inferred using pySCENIC and by calculating the average expression. |
| Page: 1 |
Top |
Somatic mutation of malignant transformation related genes |
| Annotation of somatic variants for genes involved in malignant transformation |
| Hugo Symbol | Variant Class | Variant Classification | dbSNP RS | HGVSc | HGVSp | HGVSp Short | SWISSPROT | BIOTYPE | SIFT | PolyPhen | Tumor Sample Barcode | Tissue | Histology | Sex | Age | Stage | Therapy Types | Drugs | Outcome |
| SLC38A10 | SNV | Missense_Mutation | novel | c.1634N>T | p.Ser545Leu | p.S545L | Q9HBR0 | protein_coding | tolerated(0.13) | benign(0.003) | TCGA-A7-A4SE-01 | Breast | breast invasive carcinoma | Female | <65 | I/II | Chemotherapy | adriamycin | CR |
| SLC38A10 | SNV | Missense_Mutation | novel | c.695C>T | p.Ser232Phe | p.S232F | Q9HBR0 | protein_coding | deleterious(0) | possibly_damaging(0.541) | TCGA-A7-A6VX-01 | Breast | breast invasive carcinoma | Female | >=65 | I/II | Chemotherapy | docetaxel | CR |
| SLC38A10 | SNV | Missense_Mutation | rs750418123 | c.430N>T | p.Arg144Trp | p.R144W | Q9HBR0 | protein_coding | deleterious(0) | probably_damaging(0.984) | TCGA-AN-A0FV-01 | Breast | breast invasive carcinoma | Female | <65 | I/II | Unknown | Unknown | SD |
| SLC38A10 | SNV | Missense_Mutation | rs768460185 | c.2606N>A | p.Gly869Asp | p.G869D | Q9HBR0 | protein_coding | tolerated(0.31) | benign(0.015) | TCGA-D8-A1X9-01 | Breast | breast invasive carcinoma | Female | >=65 | I/II | Chemotherapy | adriamycin+cyclophosphamide | SD |
| SLC38A10 | deletion | In_Frame_Del | c.248_259delTGCTGGTGGAGA | p.Met83_Glu86del | p.M83_E86del | Q9HBR0 | protein_coding | TCGA-A2-A0SU-01 | Breast | breast invasive carcinoma | Female | >=65 | I/II | Hormone Therapy | arimidex | SD | |||
| SLC38A10 | SNV | Missense_Mutation | rs760519967 | c.2617N>T | p.Arg873Cys | p.R873C | Q9HBR0 | protein_coding | tolerated(0.06) | benign(0.118) | TCGA-2W-A8YY-01 | Cervix | cervical & endocervical cancer | Female | <65 | I/II | Chemotherapy | cisplatin | CR |
| SLC38A10 | SNV | Missense_Mutation | novel | c.1189N>A | p.Val397Met | p.V397M | Q9HBR0 | protein_coding | deleterious(0.02) | probably_damaging(0.983) | TCGA-EA-A410-01 | Cervix | cervical & endocervical cancer | Female | <65 | I/II | Unknown | Unknown | SD |
| SLC38A10 | SNV | Missense_Mutation | rs765141868 | c.2955G>A | p.Met985Ile | p.M985I | Q9HBR0 | protein_coding | tolerated(0.13) | benign(0.006) | TCGA-IR-A3LH-01 | Cervix | cervical & endocervical cancer | Female | <65 | I/II | Chemotherapy | cisplatin | CR |
| SLC38A10 | SNV | Missense_Mutation | c.1029G>C | p.Glu343Asp | p.E343D | Q9HBR0 | protein_coding | deleterious(0) | probably_damaging(0.992) | TCGA-IR-A3LH-01 | Cervix | cervical & endocervical cancer | Female | <65 | I/II | Chemotherapy | cisplatin | CR | |
| SLC38A10 | SNV | Missense_Mutation | novel | c.2089G>A | p.Asp697Asn | p.D697N | Q9HBR0 | protein_coding | deleterious(0) | probably_damaging(0.983) | TCGA-JW-A5VL-01 | Cervix | cervical & endocervical cancer | Female | <65 | I/II | Unknown | Unknown | SD |
| Page: 1 2 3 4 5 6 7 8 |
Top |
Related drugs of malignant transformation related genes |
| Identification of chemicals and drugs interact with genes involved in malignant transfromation |
| (DGIdb 4.0) |
| Entrez ID | Symbol | Category | Interaction Types | Drug Claim Name | Drug Name | PMIDs |
| Page: 1 |

Copyright 2023-Present -The University of Texas Health Science Center at Houston |