| Tissue | Expression Dynamics | Abbreviation |
| Breast | 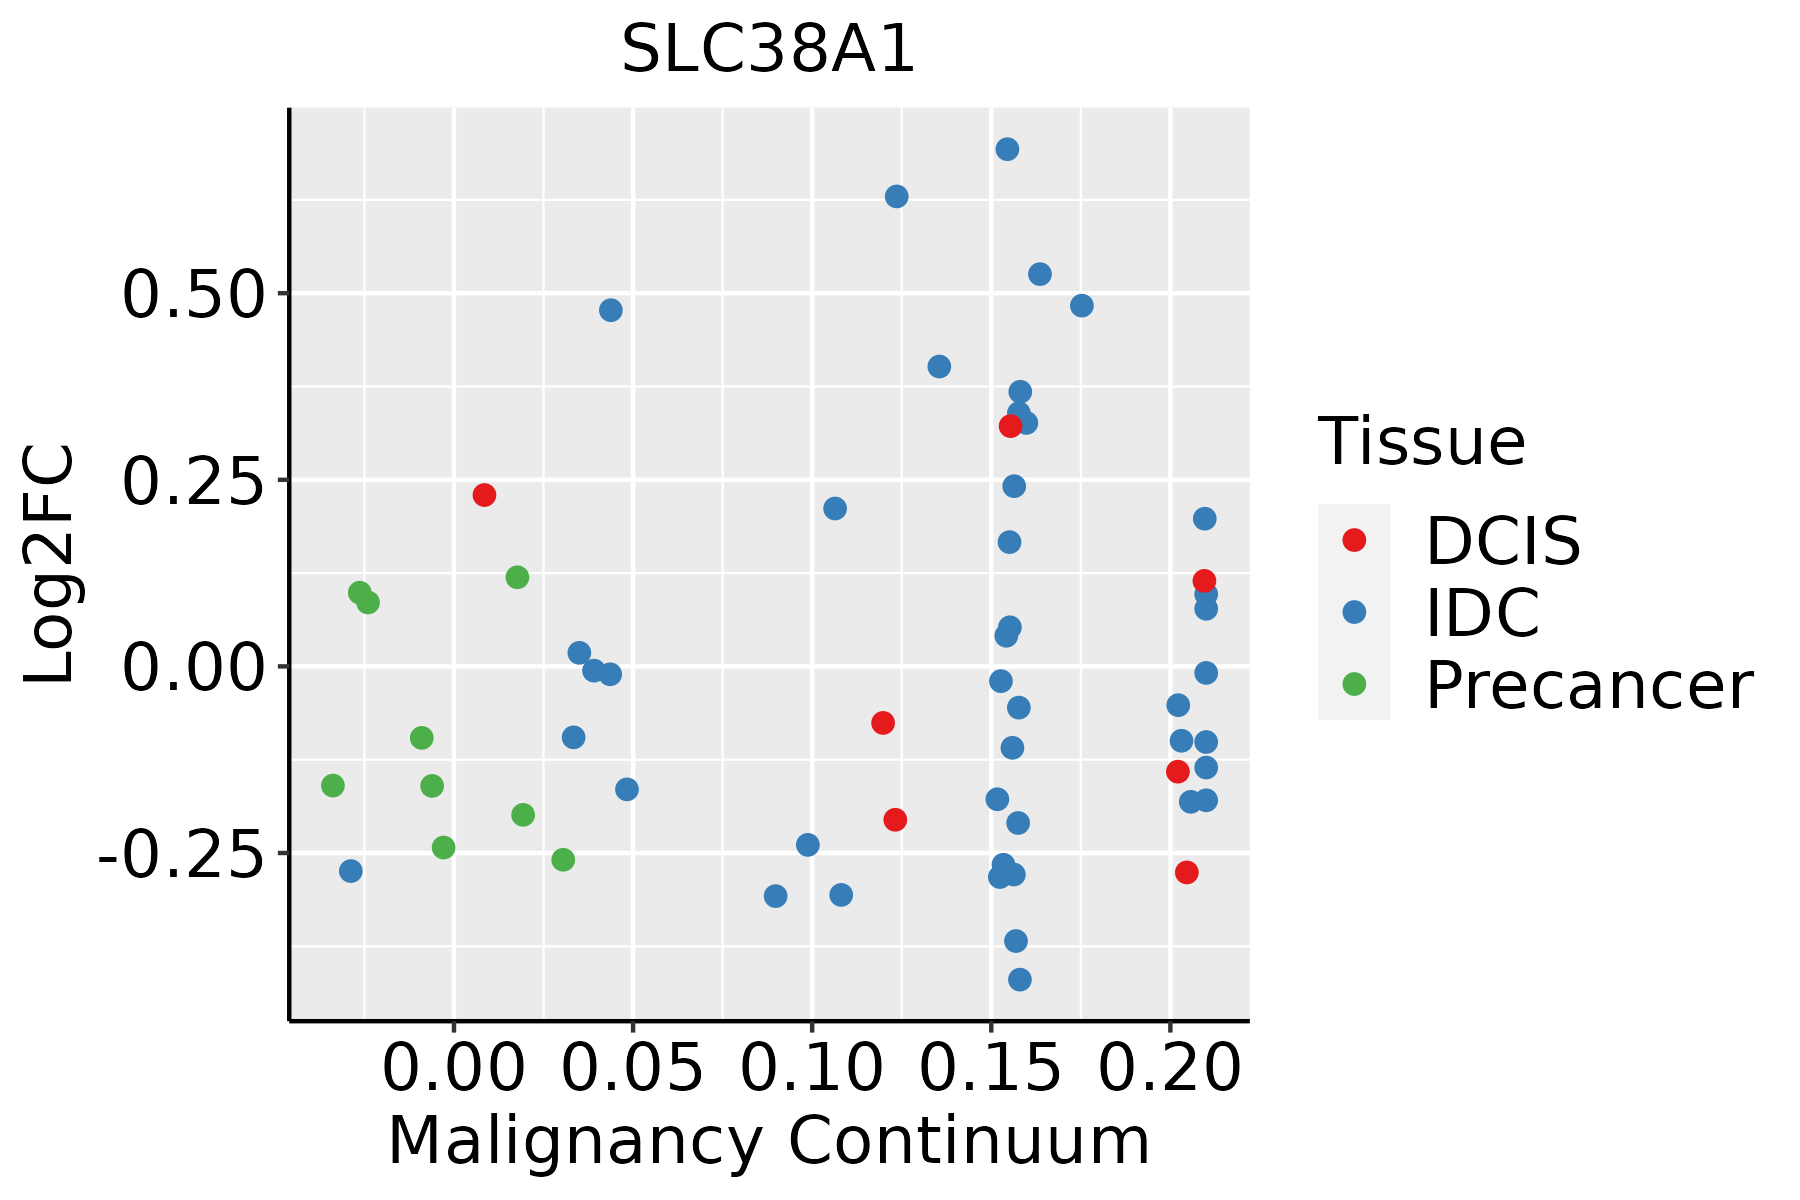 | IDC: Invasive ductal carcinoma |
| DCIS: Ductal carcinoma in situ |
| Precancer(BRCA1-mut): Precancerous lesion from BRCA1 mutation carriers |
| Colorectum (GSE201348) |  | FAP: Familial adenomatous polyposis |
| CRC: Colorectal cancer |
| Colorectum (HTA11) | 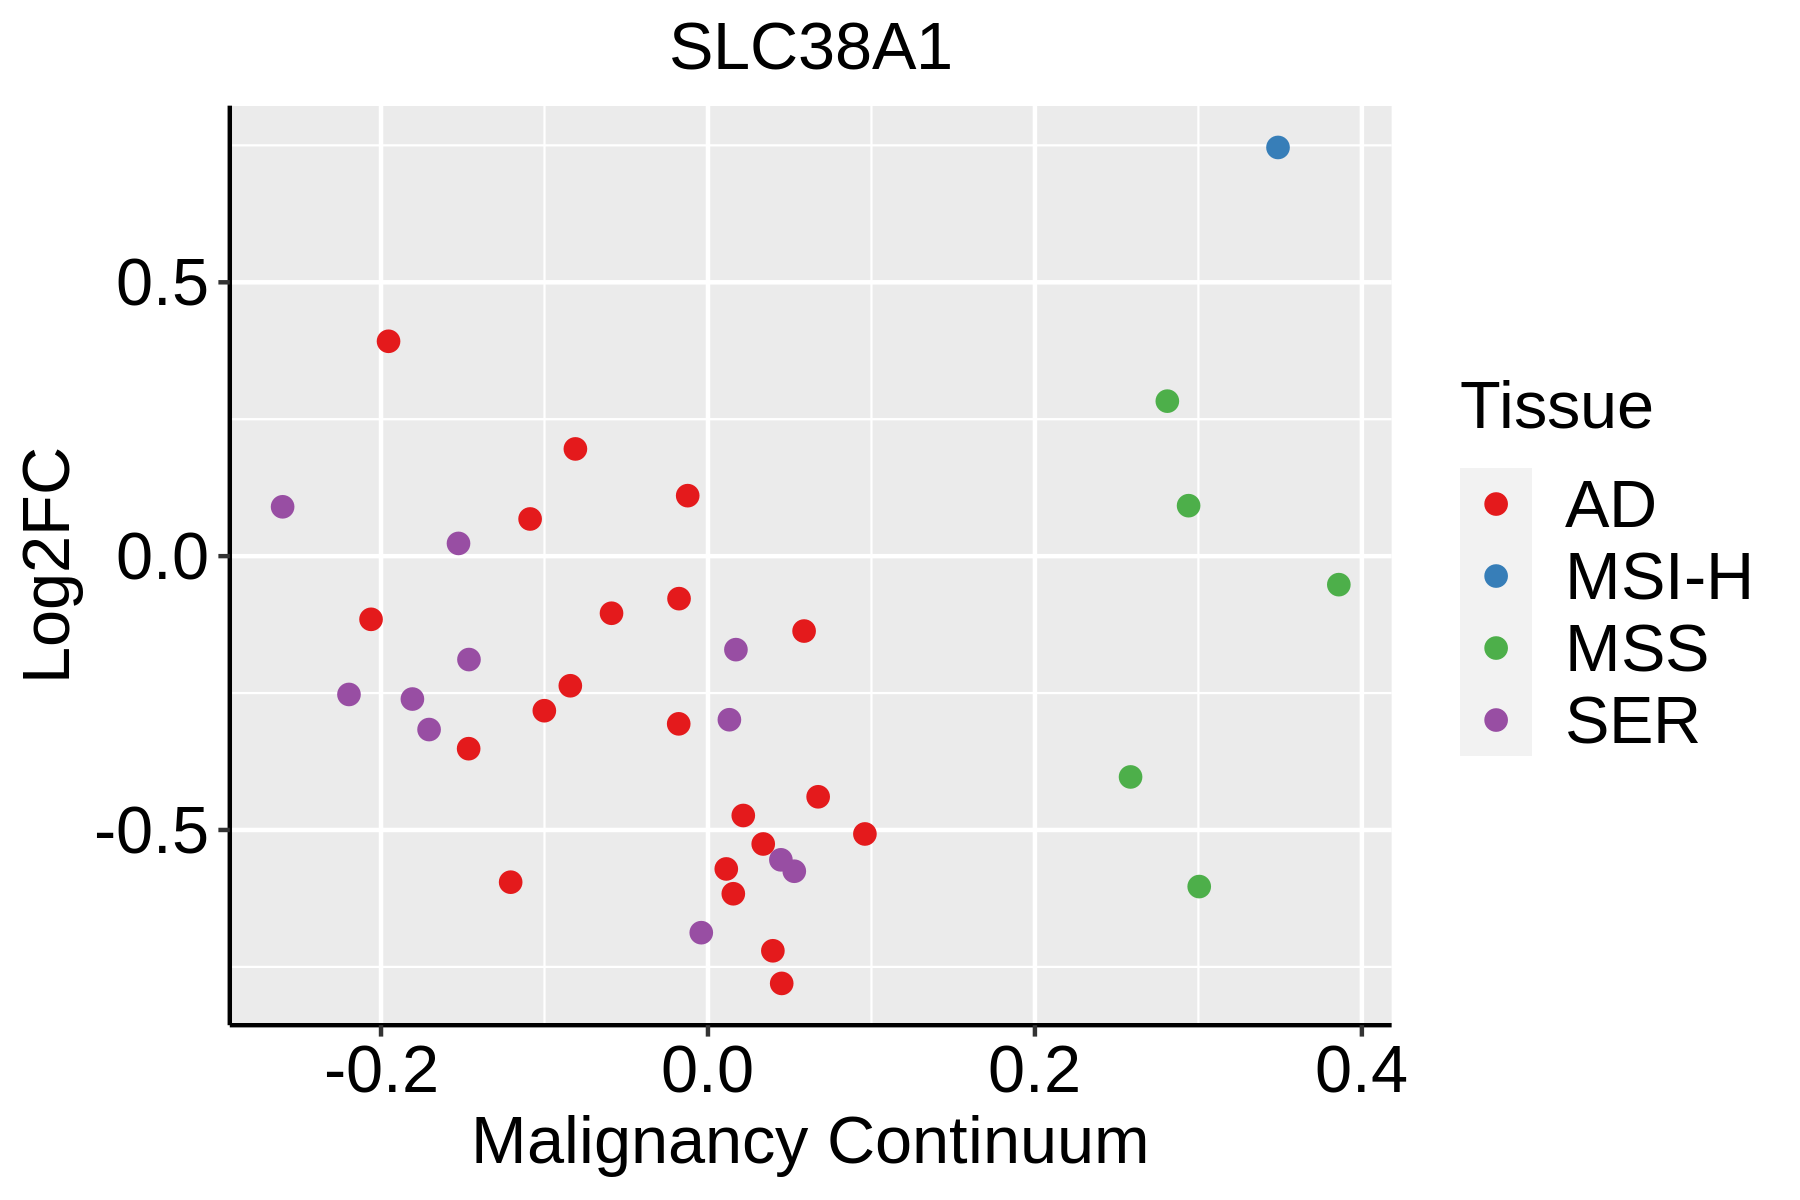 | AD: Adenomas |
| SER: Sessile serrated lesions |
| MSI-H: Microsatellite-high colorectal cancer |
| MSS: Microsatellite stable colorectal cancer |
| Endometrium | 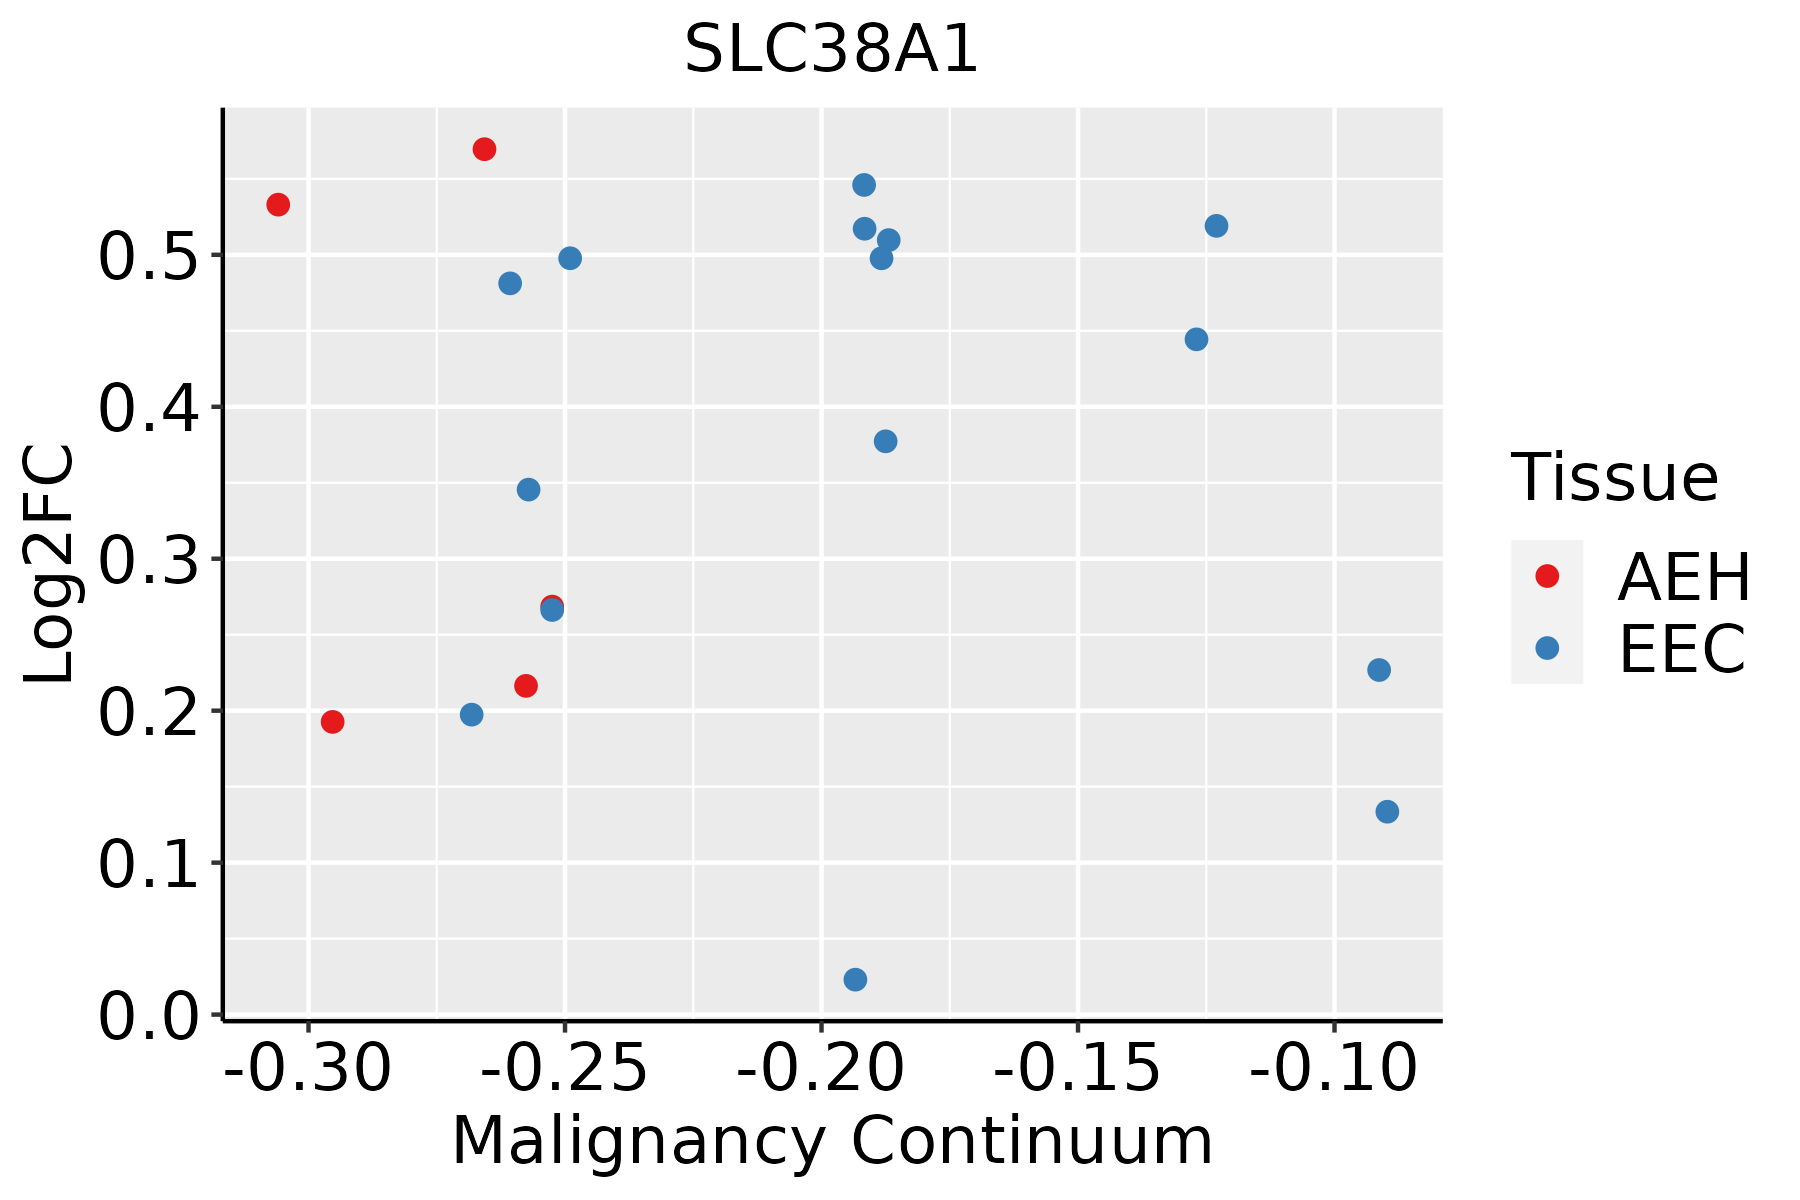 | AEH: Atypical endometrial hyperplasia |
| EEC: Endometrioid Cancer |
| Esophagus | 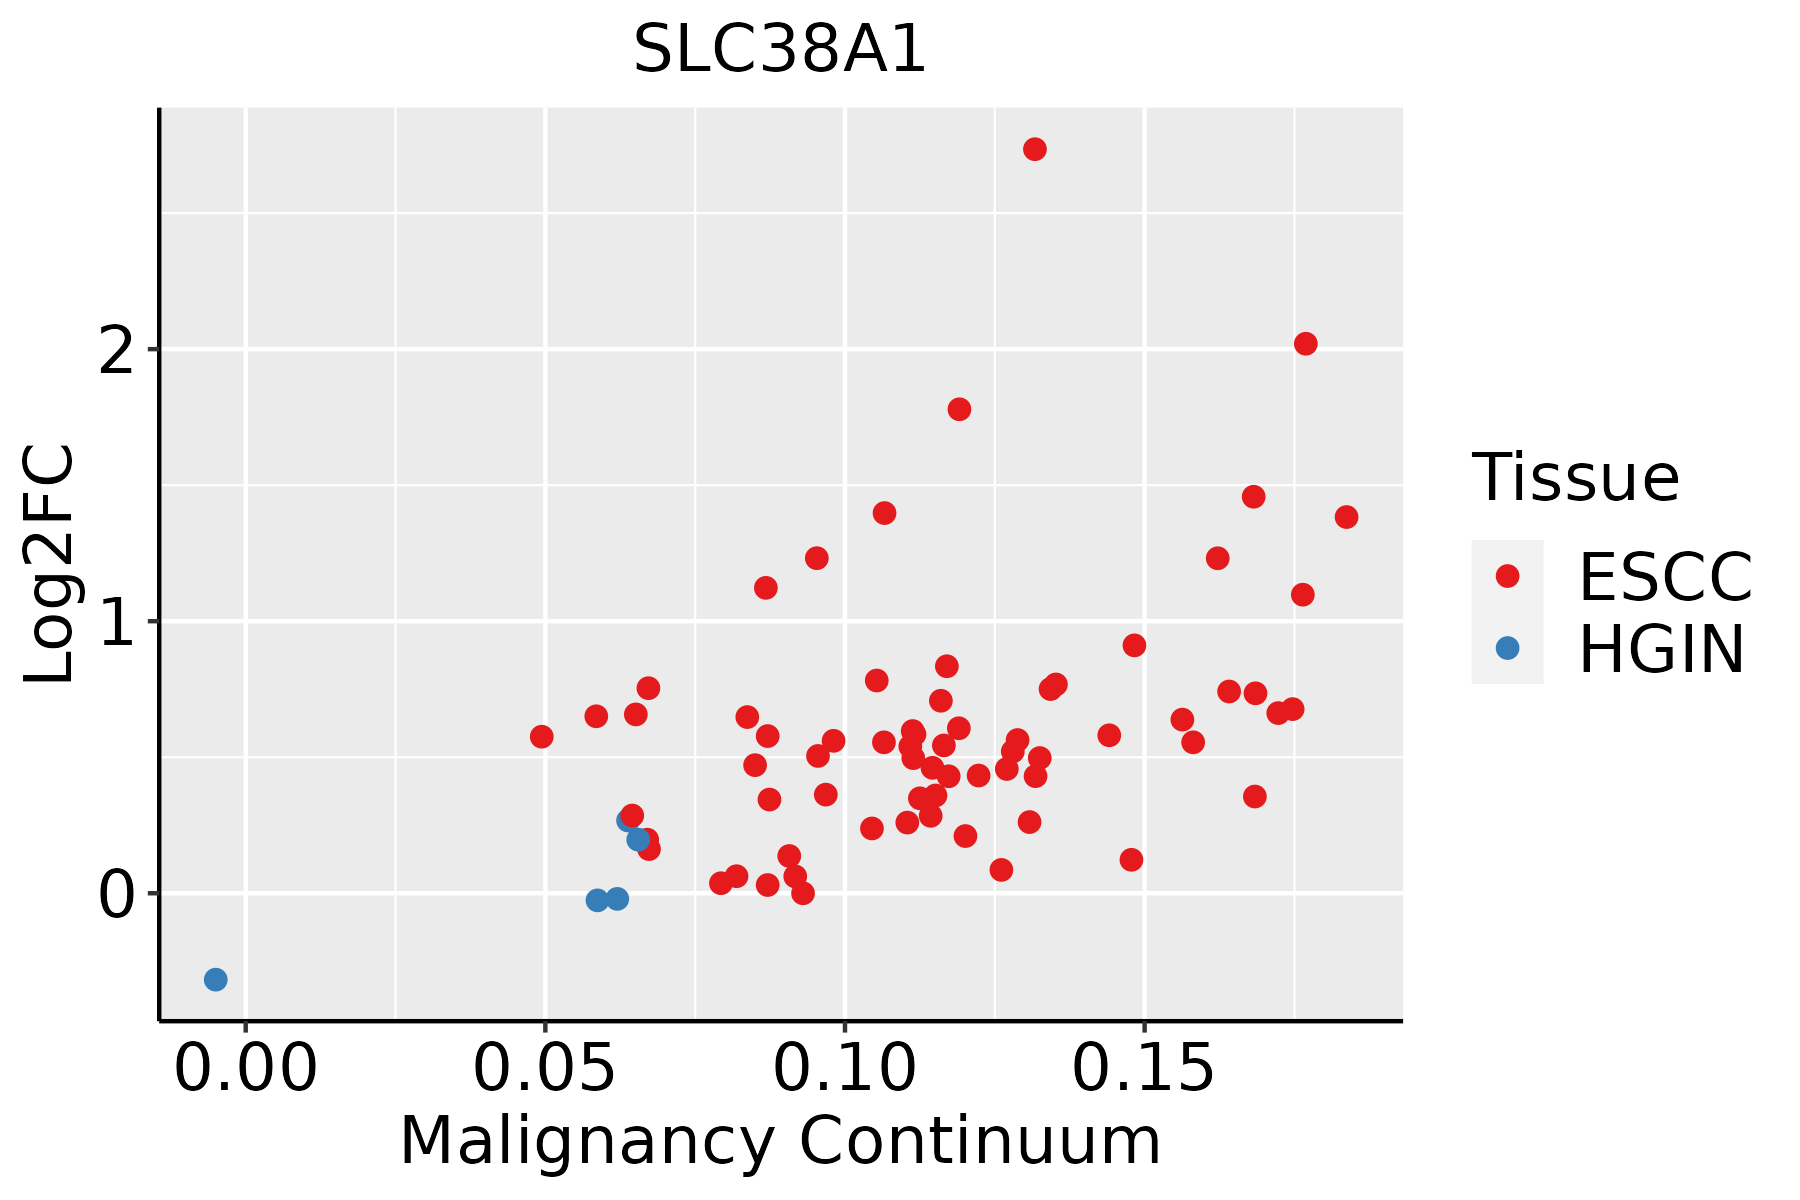 | ESCC: Esophageal squamous cell carcinoma |
| HGIN: High-grade intraepithelial neoplasias |
| LGIN: Low-grade intraepithelial neoplasias |
| Liver | 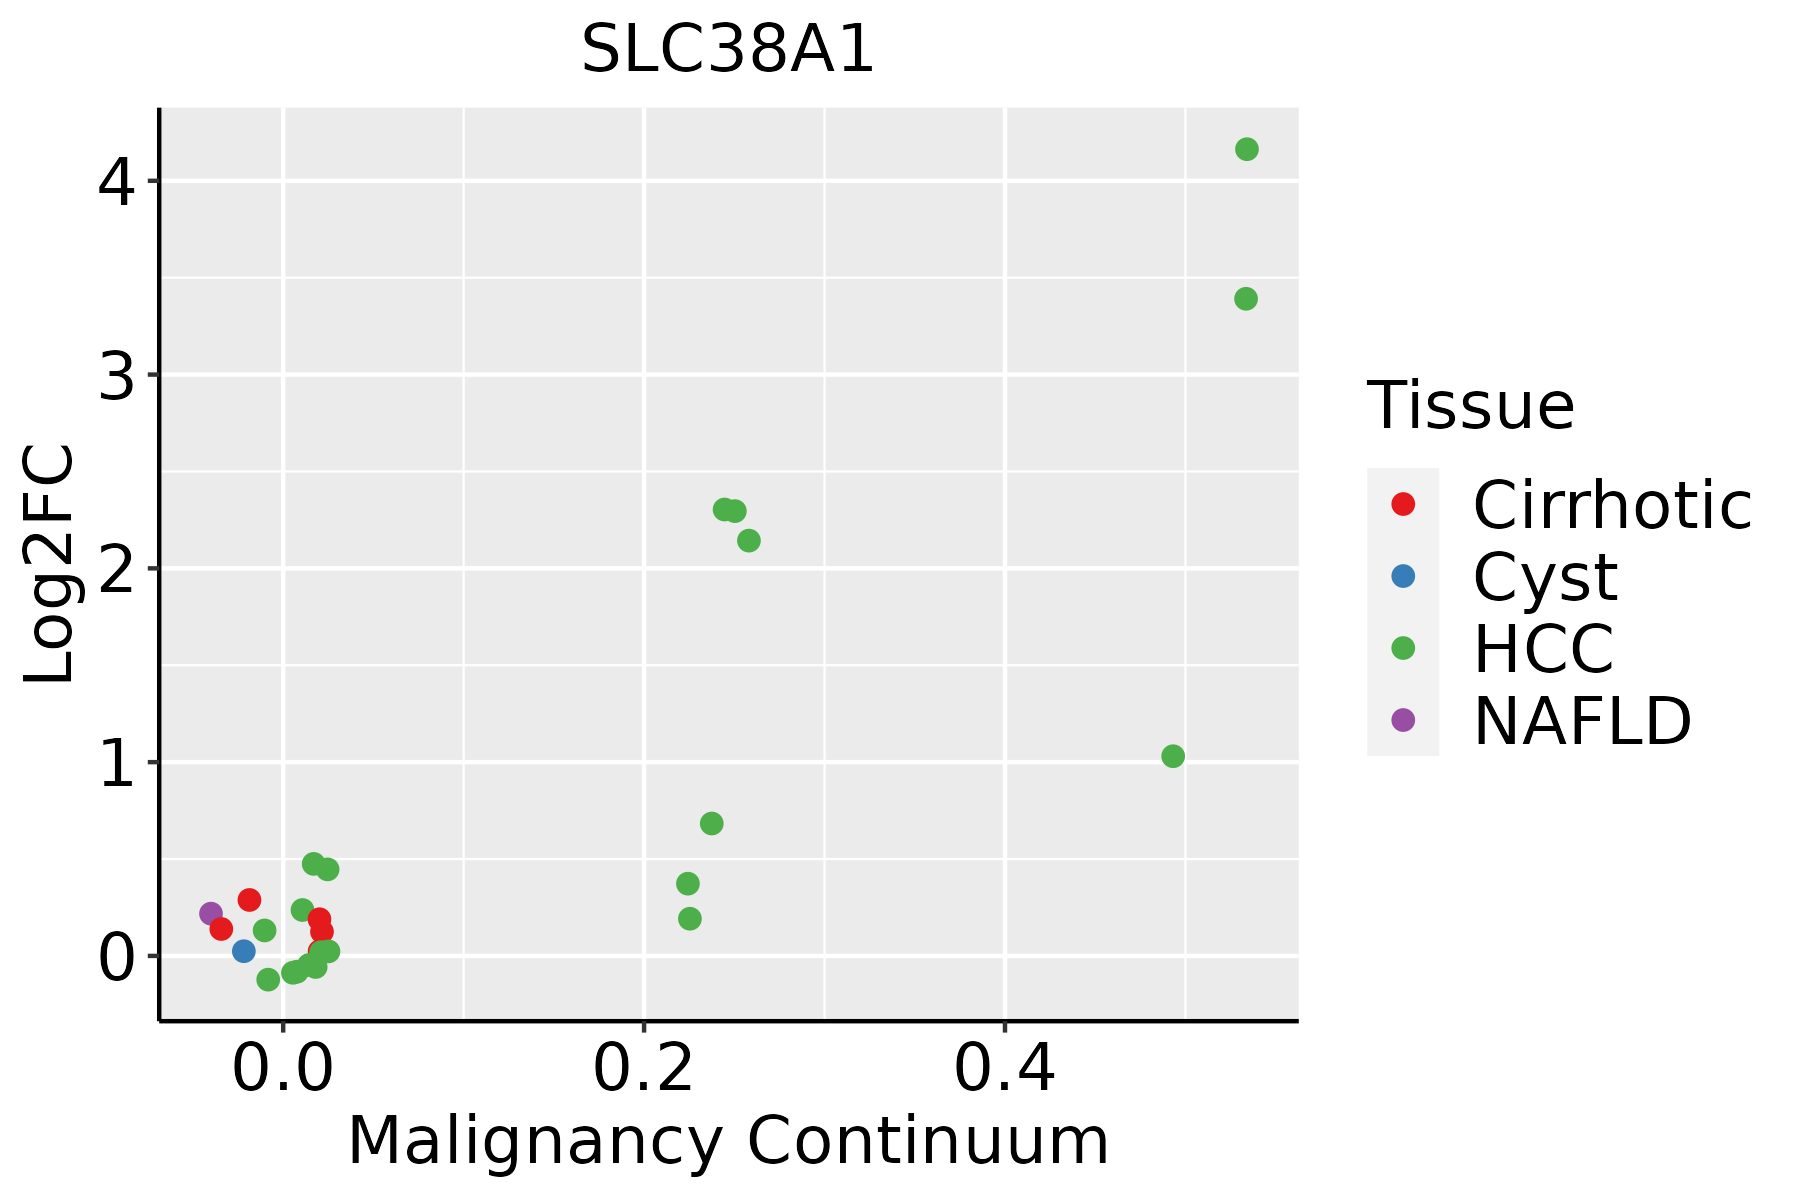 | HCC: Hepatocellular carcinoma |
| NAFLD: Non-alcoholic fatty liver disease |
| Oral Cavity |  | EOLP: Erosive Oral lichen planus |
| LP: leukoplakia |
| NEOLP: Non-erosive oral lichen planus |
| OSCC: Oral squamous cell carcinoma |
| Prostate | 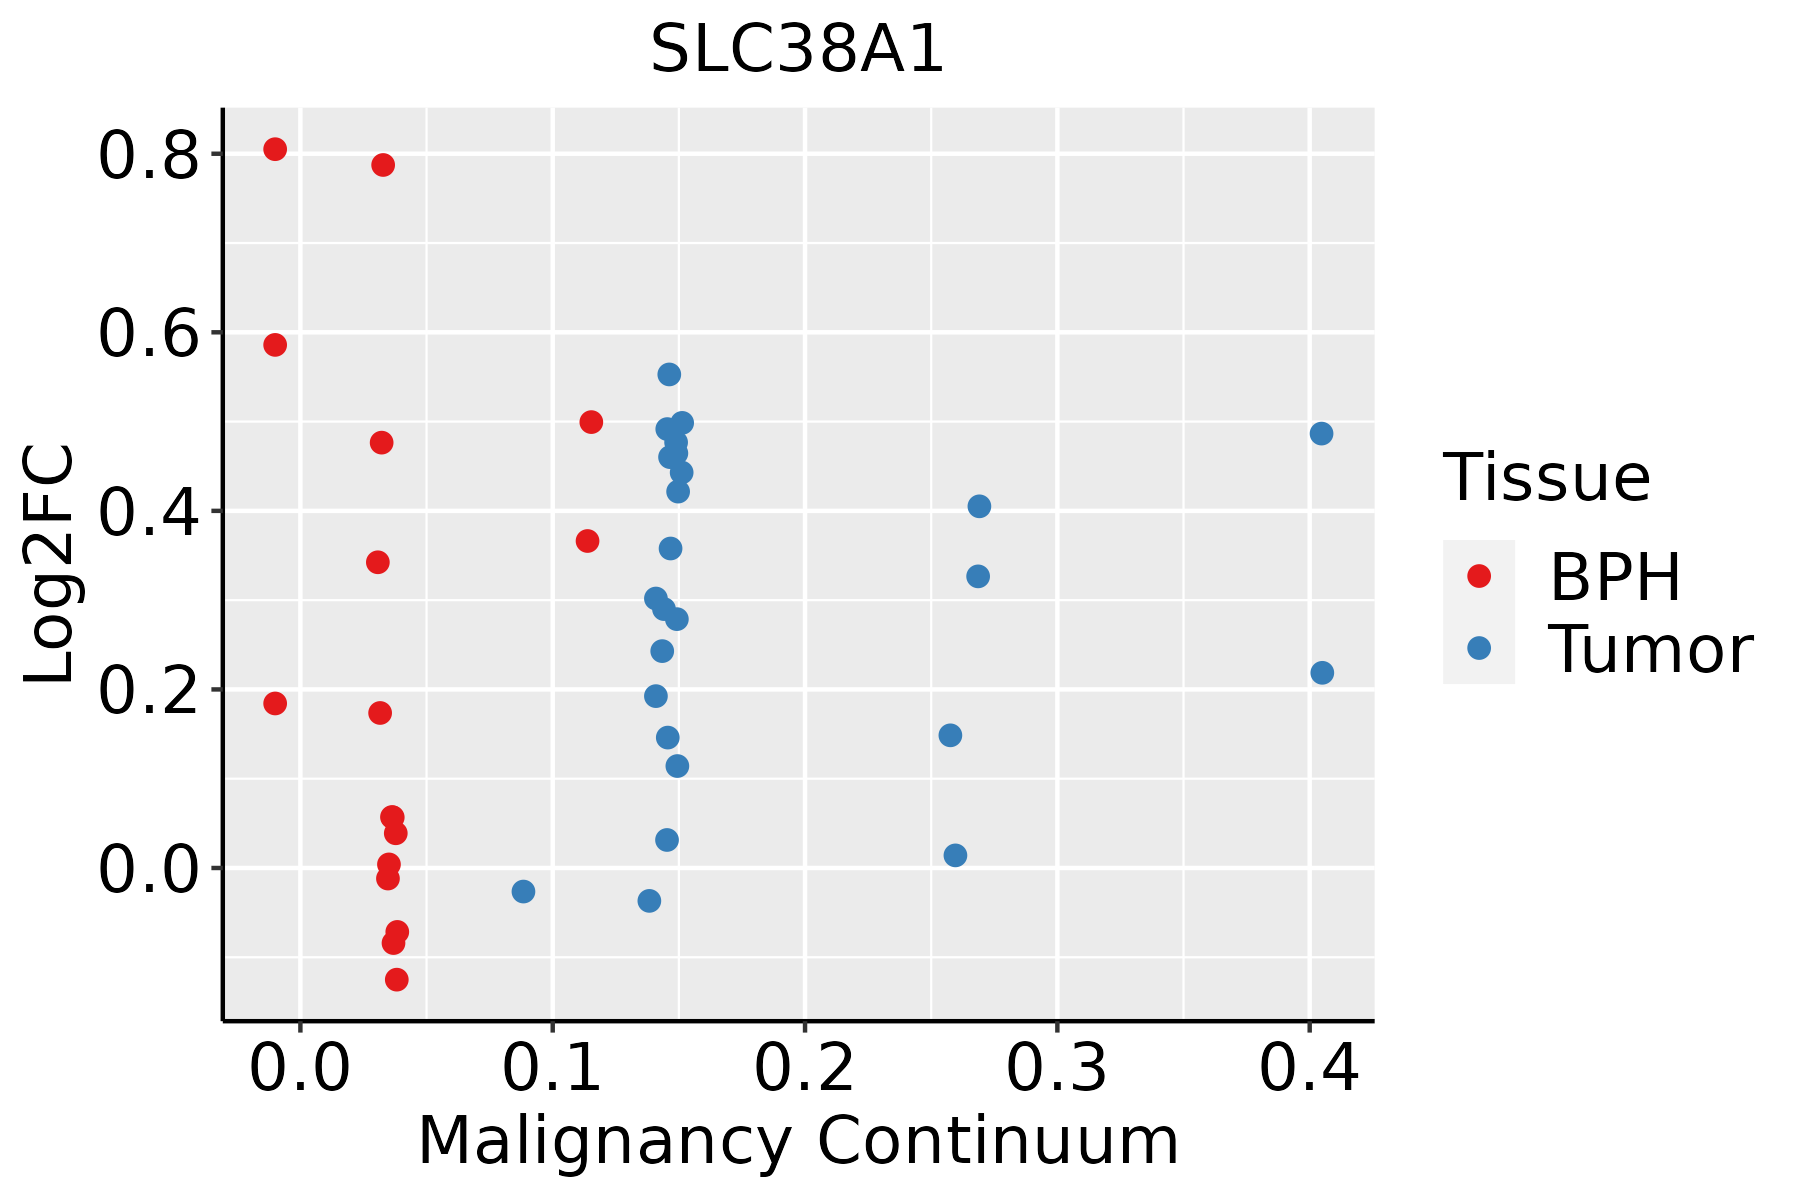 | BPH: Benign Prostatic Hyperplasia |
| Skin | 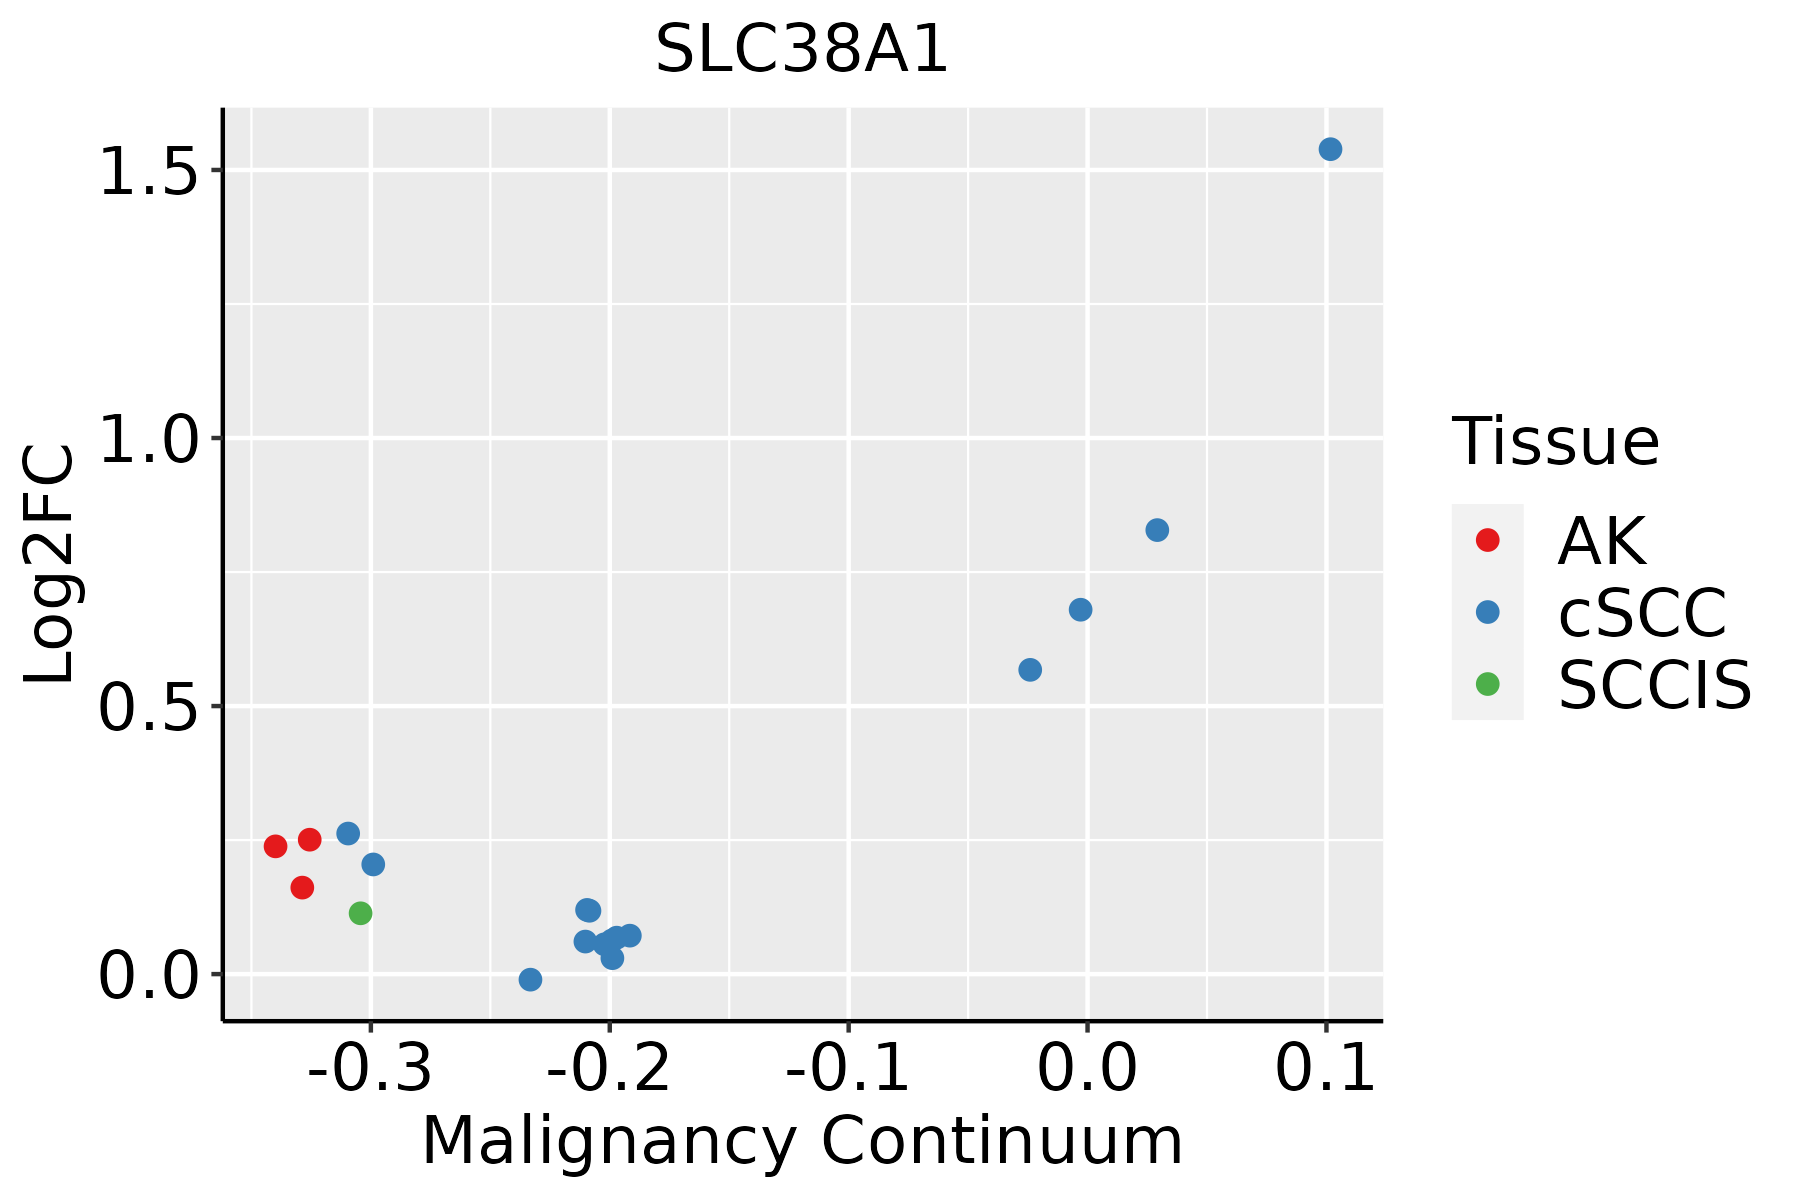 | AK: Actinic keratosis |
| cSCC: Cutaneous squamous cell carcinoma |
| SCCIS:squamous cell carcinoma in situ |
| Thyroid |  | ATC: Anaplastic thyroid cancer |
| HT: Hashimoto's thyroiditis |
| PTC: Papillary thyroid cancer |
| GO ID | Tissue | Disease Stage | Description | Gene Ratio | Bg Ratio | pvalue | p.adjust | Count |
| GO:00075653 | Breast | Precancer | female pregnancy | 29/1080 | 193/18723 | 2.07e-06 | 7.31e-05 | 29 |
| GO:00447063 | Breast | Precancer | multi-multicellular organism process | 31/1080 | 220/18723 | 3.73e-06 | 1.19e-04 | 31 |
| GO:000756511 | Breast | IDC | female pregnancy | 39/1434 | 193/18723 | 1.81e-08 | 1.27e-06 | 39 |
| GO:00447061 | Breast | IDC | multi-multicellular organism process | 41/1434 | 220/18723 | 8.58e-08 | 5.19e-06 | 41 |
| GO:00075652 | Breast | DCIS | female pregnancy | 37/1390 | 193/18723 | 7.85e-08 | 4.47e-06 | 37 |
| GO:00447062 | Breast | DCIS | multi-multicellular organism process | 39/1390 | 220/18723 | 3.05e-07 | 1.46e-05 | 39 |
| GO:0150104 | Colorectum | MSS | transport across blood-brain barrier | 28/3467 | 87/18723 | 1.54e-03 | 1.41e-02 | 28 |
| GO:0010232 | Colorectum | MSS | vascular transport | 28/3467 | 88/18723 | 1.87e-03 | 1.64e-02 | 28 |
| GO:01501041 | Colorectum | FAP | transport across blood-brain barrier | 25/2622 | 87/18723 | 2.63e-04 | 3.59e-03 | 25 |
| GO:00102321 | Colorectum | FAP | vascular transport | 25/2622 | 88/18723 | 3.19e-04 | 4.12e-03 | 25 |
| GO:0006814 | Colorectum | FAP | sodium ion transport | 54/2622 | 245/18723 | 3.98e-04 | 4.85e-03 | 54 |
| GO:0003018 | Colorectum | FAP | vascular process in circulatory system | 56/2622 | 263/18723 | 7.67e-04 | 8.12e-03 | 56 |
| GO:00068141 | Colorectum | CRC | sodium ion transport | 49/2078 | 245/18723 | 3.01e-05 | 7.86e-04 | 49 |
| GO:00030181 | Colorectum | CRC | vascular process in circulatory system | 45/2078 | 263/18723 | 2.10e-03 | 2.08e-02 | 45 |
| GO:01501042 | Colorectum | CRC | transport across blood-brain barrier | 18/2078 | 87/18723 | 6.50e-03 | 4.69e-02 | 18 |
| GO:00075655 | Endometrium | AEH | female pregnancy | 43/2100 | 193/18723 | 7.52e-06 | 1.80e-04 | 43 |
| GO:00447065 | Endometrium | AEH | multi-multicellular organism process | 45/2100 | 220/18723 | 4.55e-05 | 7.61e-04 | 45 |
| GO:000756513 | Endometrium | EEC | female pregnancy | 43/2168 | 193/18723 | 1.66e-05 | 3.18e-04 | 43 |
| GO:004470612 | Endometrium | EEC | multi-multicellular organism process | 45/2168 | 220/18723 | 9.73e-05 | 1.35e-03 | 45 |
| GO:00603485 | Esophagus | ESCC | bone development | 115/8552 | 205/18723 | 1.67e-03 | 7.72e-03 | 115 |
| Hugo Symbol | Variant Class | Variant Classification | dbSNP RS | HGVSc | HGVSp | HGVSp Short | SWISSPROT | BIOTYPE | SIFT | PolyPhen | Tumor Sample Barcode | Tissue | Histology | Sex | Age | Stage | Therapy Types | Drugs | Outcome |
| SLC38A1 | SNV | Missense_Mutation | novel | c.1174N>G | p.Arg392Gly | p.R392G | | protein_coding | deleterious(0) | possibly_damaging(0.794) | TCGA-A8-A09A-01 | Breast | breast invasive carcinoma | Female | <65 | I/II | Hormone Therapy | tamoxiphen | SD |
| SLC38A1 | SNV | Missense_Mutation | rs767003327 | c.584N>A | p.Arg195His | p.R195H | | protein_coding | deleterious(0.01) | benign(0.3) | TCGA-BH-A18G-01 | Breast | breast invasive carcinoma | Female | >=65 | I/II | Unknown | Unknown | SD |
| SLC38A1 | SNV | Missense_Mutation | | c.1332G>C | p.Gln444His | p.Q444H | | protein_coding | deleterious(0.01) | possibly_damaging(0.54) | TCGA-D8-A1JA-01 | Breast | breast invasive carcinoma | Female | <65 | III/IV | Chemotherapy | adriamycin | PD |
| SLC38A1 | insertion | Frame_Shift_Ins | novel | c.1392_1393insATTTC | p.Phe465IlefsTer66 | p.F465Ifs*66 | Q9H2H9 | protein_coding | | | TCGA-BH-A0HK-01 | Breast | breast invasive carcinoma | Female | >=65 | I/II | Hormone Therapy | arimidex | SD |
| SLC38A1 | insertion | Nonsense_Mutation | novel | c.1390_1391insAGAGAAAGAAATGTCTGAGAAATAGTTCCCT | p.Leu464Ter | p.L464* | Q9H2H9 | protein_coding | | | TCGA-BH-A0HK-01 | Breast | breast invasive carcinoma | Female | >=65 | I/II | Hormone Therapy | arimidex | SD |
| SLC38A1 | SNV | Missense_Mutation | | c.510A>C | p.Lys170Asn | p.K170N | | protein_coding | deleterious(0.01) | probably_damaging(0.914) | TCGA-FU-A3HZ-01 | Cervix | cervical & endocervical cancer | Female | <65 | I/II | Chemotherapy | cisplatin | CR |
| SLC38A1 | SNV | Missense_Mutation | novel | c.1309C>G | p.Leu437Val | p.L437V | | protein_coding | deleterious(0) | possibly_damaging(0.491) | TCGA-VS-A9U5-01 | Cervix | cervical & endocervical cancer | Female | <65 | I/II | Chemotherapy | cisplatin | CR |
| SLC38A1 | SNV | Missense_Mutation | novel | c.1156N>G | p.Thr386Ala | p.T386A | | protein_coding | tolerated(0.8) | benign(0.088) | TCGA-AA-3984-01 | Colorectum | colon adenocarcinoma | Female | <65 | I/II | Unknown | Unknown | SD |
| SLC38A1 | SNV | Missense_Mutation | novel | c.28T>A | p.Leu10Ile | p.L10I | | protein_coding | tolerated_low_confidence(0.22) | benign(0.419) | TCGA-AA-A01D-01 | Colorectum | colon adenocarcinoma | Female | <65 | III/IV | Chemotherapy | capecitabine | PD |
| SLC38A1 | SNV | Missense_Mutation | | c.1070N>T | p.Arg357Leu | p.R357L | | protein_coding | deleterious(0) | probably_damaging(0.943) | TCGA-AA-A01R-01 | Colorectum | colon adenocarcinoma | Male | <65 | III/IV | Chemotherapy | 5-fluorouracil | PD |


