
|
|||||
|
 | |
| |
| |
| |
| |
| |
|
Gene: SLC37A4 |
Gene summary for SLC37A4 |
| Gene information | Species | Human | Gene symbol | SLC37A4 | Gene ID | 2542 |
| Gene name | solute carrier family 37 member 4 | |
| Gene Alias | CDG2W | |
| Cytomap | 11q23.3 | |
| Gene Type | protein-coding | GO ID | GO:0005975 | UniProtAcc | A0A024R3H9 |
Top |
Malignant transformation analysis |
| Identification of the aberrant gene expression in precancerous and cancerous lesions by comparing the gene expression of stem-like cells in diseased tissues with normal stem cells |
| Entrez ID | Symbol | Replicates | Species | Organ | Tissue | Adj P-value | Log2FC | Malignancy |
| 2542 | SLC37A4 | LZE4T | Human | Esophagus | ESCC | 2.98e-02 | 8.42e-02 | 0.0811 |
| 2542 | SLC37A4 | LZE22D1 | Human | Esophagus | HGIN | 2.23e-07 | 2.48e-01 | 0.0595 |
| 2542 | SLC37A4 | LZE22T | Human | Esophagus | ESCC | 8.90e-10 | 6.90e-01 | 0.068 |
| 2542 | SLC37A4 | LZE24T | Human | Esophagus | ESCC | 1.39e-06 | 2.00e-01 | 0.0596 |
| 2542 | SLC37A4 | P2T-E | Human | Esophagus | ESCC | 1.72e-08 | 1.55e-01 | 0.1177 |
| 2542 | SLC37A4 | P4T-E | Human | Esophagus | ESCC | 3.48e-11 | 3.20e-01 | 0.1323 |
| 2542 | SLC37A4 | P5T-E | Human | Esophagus | ESCC | 3.70e-12 | 1.27e-01 | 0.1327 |
| 2542 | SLC37A4 | P8T-E | Human | Esophagus | ESCC | 6.07e-06 | 1.42e-01 | 0.0889 |
| 2542 | SLC37A4 | P11T-E | Human | Esophagus | ESCC | 1.16e-08 | 3.76e-01 | 0.1426 |
| 2542 | SLC37A4 | P12T-E | Human | Esophagus | ESCC | 5.41e-15 | 2.39e-01 | 0.1122 |
| 2542 | SLC37A4 | P15T-E | Human | Esophagus | ESCC | 8.47e-05 | 9.10e-02 | 0.1149 |
| 2542 | SLC37A4 | P16T-E | Human | Esophagus | ESCC | 9.65e-14 | 1.80e-01 | 0.1153 |
| 2542 | SLC37A4 | P17T-E | Human | Esophagus | ESCC | 1.58e-07 | 2.12e-01 | 0.1278 |
| 2542 | SLC37A4 | P21T-E | Human | Esophagus | ESCC | 1.78e-15 | 2.51e-01 | 0.1617 |
| 2542 | SLC37A4 | P22T-E | Human | Esophagus | ESCC | 3.53e-08 | 8.06e-02 | 0.1236 |
| 2542 | SLC37A4 | P23T-E | Human | Esophagus | ESCC | 4.31e-09 | 1.81e-01 | 0.108 |
| 2542 | SLC37A4 | P24T-E | Human | Esophagus | ESCC | 7.15e-05 | 1.27e-01 | 0.1287 |
| 2542 | SLC37A4 | P26T-E | Human | Esophagus | ESCC | 1.59e-09 | 2.88e-01 | 0.1276 |
| 2542 | SLC37A4 | P27T-E | Human | Esophagus | ESCC | 1.88e-03 | 1.46e-01 | 0.1055 |
| 2542 | SLC37A4 | P28T-E | Human | Esophagus | ESCC | 1.65e-02 | 9.81e-02 | 0.1149 |
| Page: 1 2 3 4 |
| Tissue | Expression Dynamics | Abbreviation |
| Esophagus |  | ESCC: Esophageal squamous cell carcinoma |
| HGIN: High-grade intraepithelial neoplasias | ||
| LGIN: Low-grade intraepithelial neoplasias | ||
| Liver | 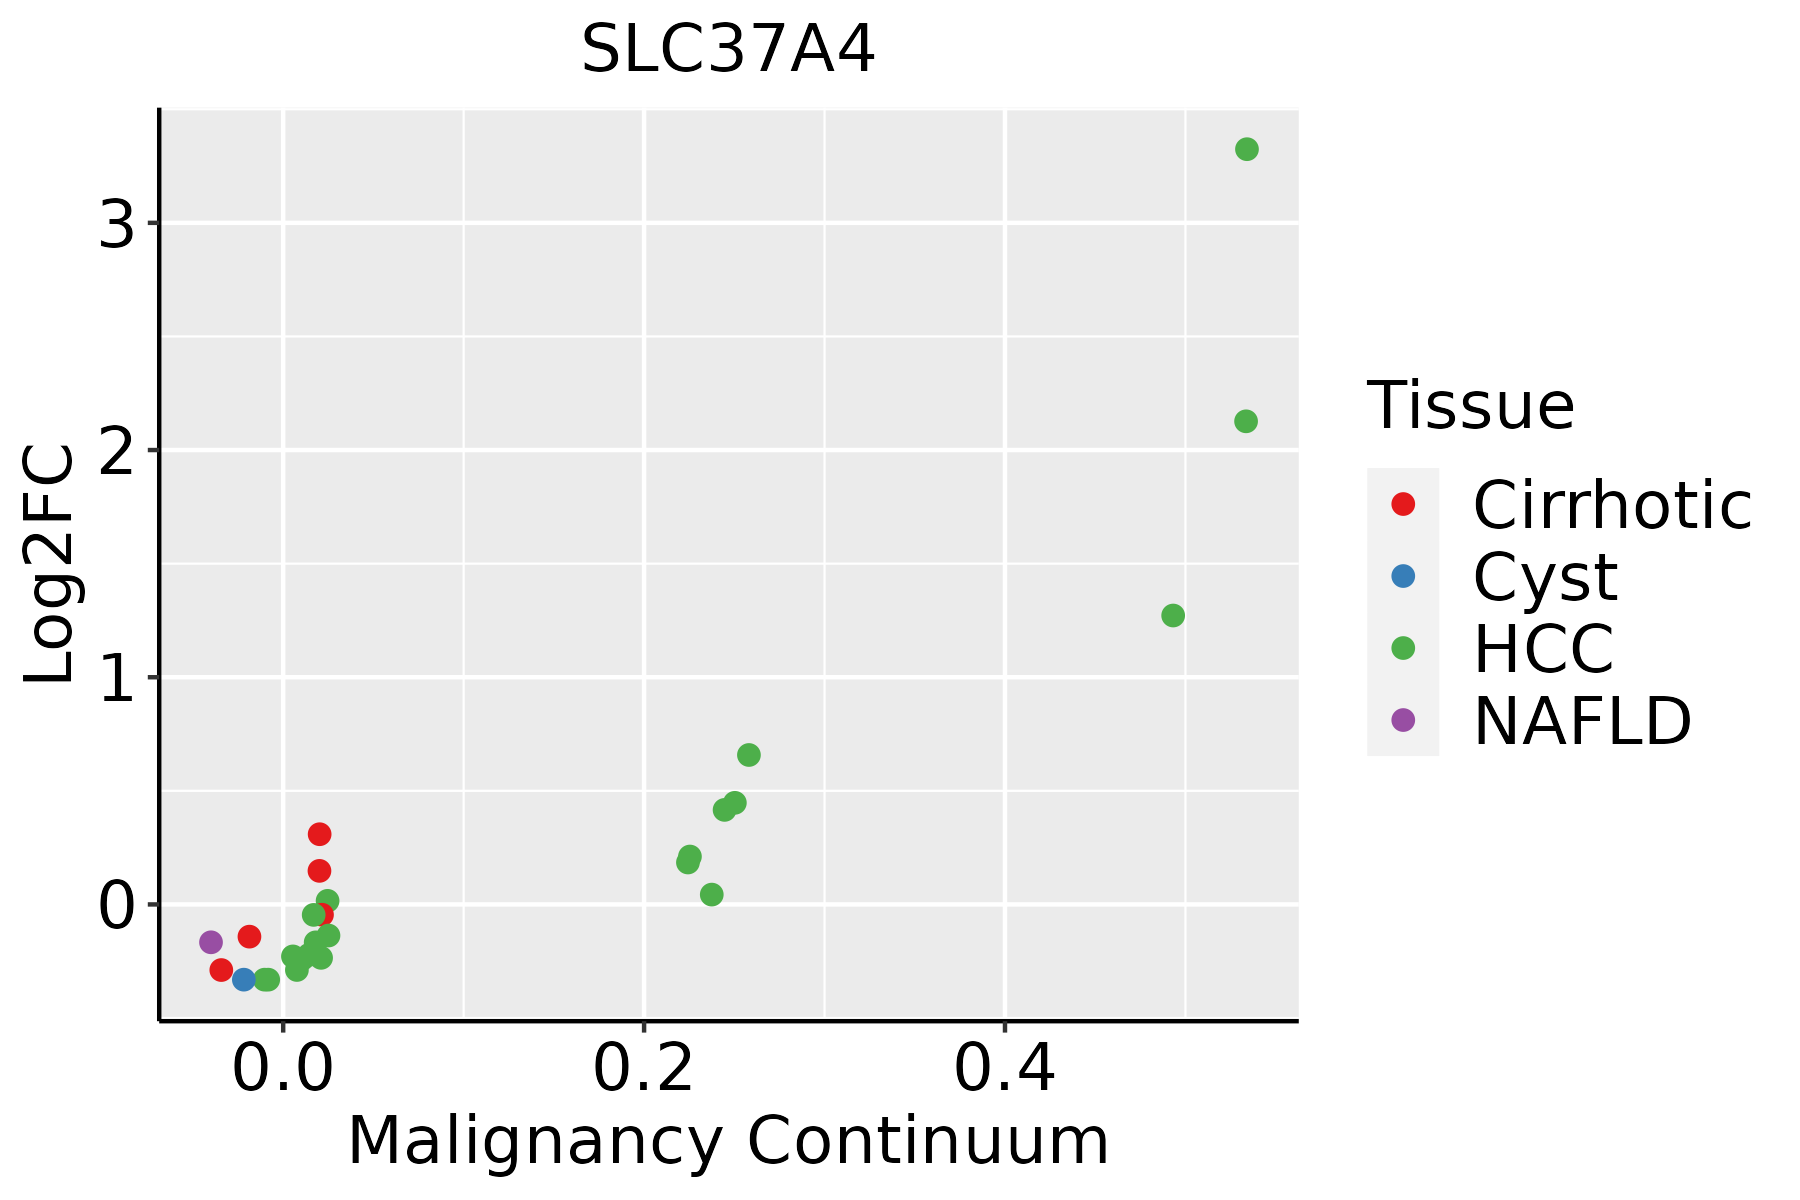 | HCC: Hepatocellular carcinoma |
| NAFLD: Non-alcoholic fatty liver disease | ||
| Oral Cavity | 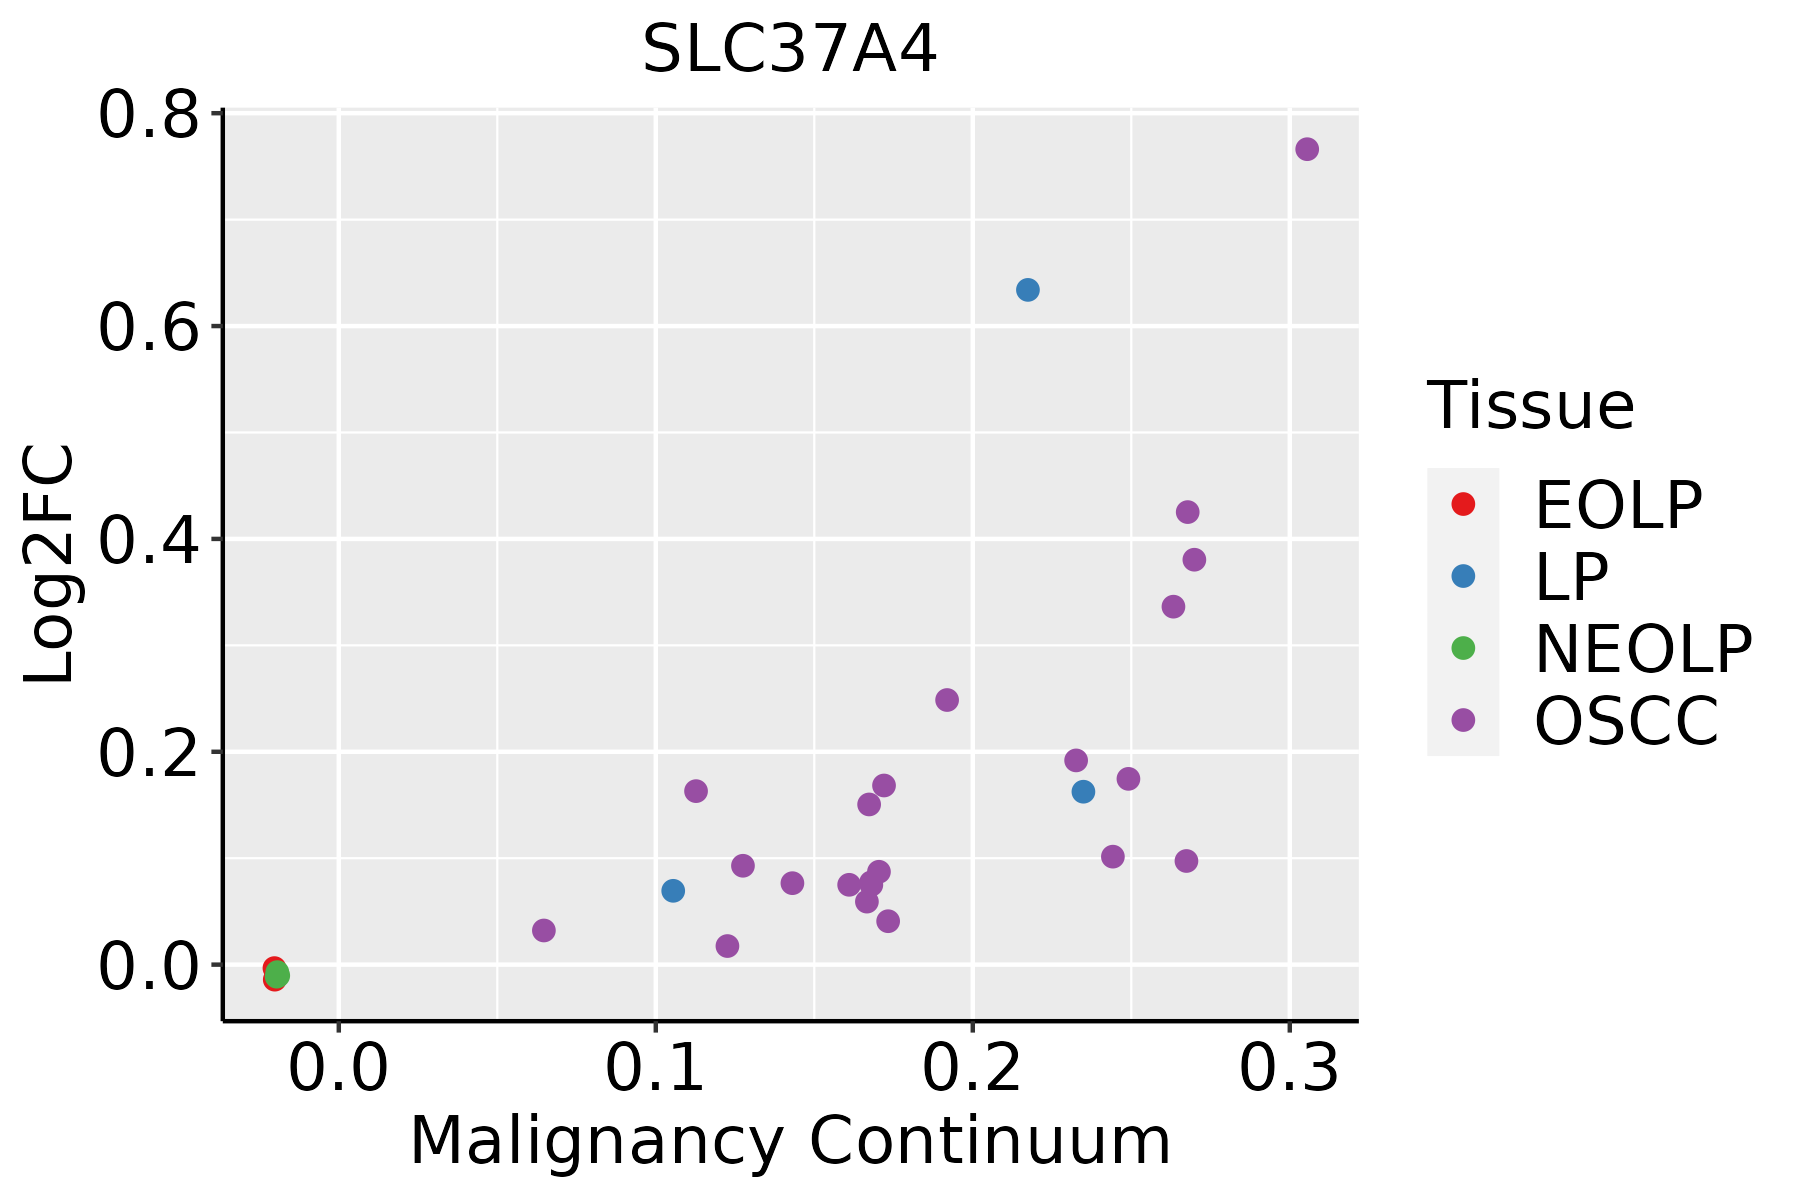 | EOLP: Erosive Oral lichen planus |
| LP: leukoplakia | ||
| NEOLP: Non-erosive oral lichen planus | ||
| OSCC: Oral squamous cell carcinoma |
| ∗log2FC in expression of this searched gene in stem-like cells from each diseased tissue sample relative to stem-like cells in normal samples in each tissue plotted against the malignancy continuum. Samples are colored based on if they are from different disease stage. |
Top |
Malignant transformation related pathway analysis |
| Find out the enriched GO biological processes and KEGG pathways involved in transition from healthy to precancer to cancer |
| Tissue | Disease Stage | Enriched GO biological Processes |
| Colorectum | AD |  |
| Colorectum | SER |  |
| Colorectum | MSS |  |
| Colorectum | MSI-H |  |
| Colorectum | FAP |  |
| ∗Top 15 enriched GO BP terms are showed in the bar plot of each disease state in each tissue. Each row represents a significant GO biological process which is colored according to the -log10(p.adjust). |
| Page: 1 2 3 4 5 6 7 8 9 |
| GO ID | Tissue | Disease Stage | Description | Gene Ratio | Bg Ratio | pvalue | p.adjust | Count |
| GO:00059969 | Esophagus | ESCC | monosaccharide metabolic process | 159/8552 | 257/18723 | 1.11e-07 | 1.81e-06 | 159 |
| GO:00193189 | Esophagus | ESCC | hexose metabolic process | 147/8552 | 237/18723 | 2.63e-07 | 3.94e-06 | 147 |
| GO:00060069 | Esophagus | ESCC | glucose metabolic process | 119/8552 | 196/18723 | 1.51e-05 | 1.36e-04 | 119 |
| GO:00160514 | Esophagus | ESCC | carbohydrate biosynthetic process | 117/8552 | 202/18723 | 2.96e-04 | 1.79e-03 | 117 |
| GO:00463643 | Esophagus | ESCC | monosaccharide biosynthetic process | 52/8552 | 82/18723 | 9.03e-04 | 4.61e-03 | 52 |
| GO:00193193 | Esophagus | ESCC | hexose biosynthetic process | 49/8552 | 78/18723 | 1.69e-03 | 7.81e-03 | 49 |
| GO:00060943 | Esophagus | ESCC | gluconeogenesis | 46/8552 | 75/18723 | 4.54e-03 | 1.78e-02 | 46 |
| GO:000599612 | Liver | Cirrhotic | monosaccharide metabolic process | 104/4634 | 257/18723 | 1.74e-08 | 6.32e-07 | 104 |
| GO:001931812 | Liver | Cirrhotic | hexose metabolic process | 97/4634 | 237/18723 | 2.67e-08 | 9.16e-07 | 97 |
| GO:000600611 | Liver | Cirrhotic | glucose metabolic process | 82/4634 | 196/18723 | 1.01e-07 | 2.93e-06 | 82 |
| GO:00463641 | Liver | Cirrhotic | monosaccharide biosynthetic process | 37/4634 | 82/18723 | 4.52e-05 | 5.30e-04 | 37 |
| GO:00160511 | Liver | Cirrhotic | carbohydrate biosynthetic process | 73/4634 | 202/18723 | 1.91e-04 | 1.77e-03 | 73 |
| GO:00193191 | Liver | Cirrhotic | hexose biosynthetic process | 33/4634 | 78/18723 | 4.94e-04 | 3.96e-03 | 33 |
| GO:00060941 | Liver | Cirrhotic | gluconeogenesis | 32/4634 | 75/18723 | 5.00e-04 | 3.98e-03 | 32 |
| GO:000599621 | Liver | HCC | monosaccharide metabolic process | 167/7958 | 257/18723 | 2.31e-13 | 1.25e-11 | 167 |
| GO:001931821 | Liver | HCC | hexose metabolic process | 155/7958 | 237/18723 | 7.63e-13 | 3.90e-11 | 155 |
| GO:000600621 | Liver | HCC | glucose metabolic process | 128/7958 | 196/18723 | 8.60e-11 | 3.06e-09 | 128 |
| GO:00463642 | Liver | HCC | monosaccharide biosynthetic process | 58/7958 | 82/18723 | 2.08e-07 | 3.75e-06 | 58 |
| GO:00193192 | Liver | HCC | hexose biosynthetic process | 54/7958 | 78/18723 | 1.61e-06 | 2.27e-05 | 54 |
| GO:00060942 | Liver | HCC | gluconeogenesis | 52/7958 | 75/18723 | 2.34e-06 | 3.14e-05 | 52 |
| Page: 1 2 |
| Pathway ID | Tissue | Disease Stage | Description | Gene Ratio | Bg Ratio | pvalue | p.adjust | qvalue | Count |
| Page: 1 |
Top |
Cell-cell communication analysis |
| Identification of potential cell-cell interactions between two cell types and their ligand-receptor pairs for different disease states |
| Ligand | Receptor | LRpair | Pathway | Tissue | Disease Stage |
| Page: 1 |
Top |
Single-cell gene regulatory network inference analysis |
| Find out the significant the regulons (TFs) and the target genes of each regulon across cell types for different disease states |
| TF | Cell Type | Tissue | Disease Stage | Target Gene | RSS | Regulon Activity |
| ∗The dot plots of a searched regulon are shown for all cell subpopulations in each disease state of each tissue based on the regulon specific score inferred using pySCENIC and by calculating the average expression. |
| Page: 1 |
Top |
Somatic mutation of malignant transformation related genes |
| Annotation of somatic variants for genes involved in malignant transformation |
| Hugo Symbol | Variant Class | Variant Classification | dbSNP RS | HGVSc | HGVSp | HGVSp Short | SWISSPROT | BIOTYPE | SIFT | PolyPhen | Tumor Sample Barcode | Tissue | Histology | Sex | Age | Stage | Therapy Types | Drugs | Outcome |
| SLC37A4 | SNV | Missense_Mutation | c.275N>C | p.Ile92Thr | p.I92T | protein_coding | deleterious(0) | benign(0.095) | TCGA-D8-A1XK-01 | Breast | breast invasive carcinoma | Female | <65 | I/II | Chemotherapy | doxorubicine+cyclophosphamide | SD | ||
| SLC37A4 | SNV | Missense_Mutation | c.1193G>C | p.Gly398Ala | p.G398A | protein_coding | deleterious(0) | probably_damaging(0.971) | TCGA-E2-A1IN-01 | Breast | breast invasive carcinoma | Female | <65 | I/II | Hormone Therapy | arimidex | SD | ||
| SLC37A4 | insertion | Frame_Shift_Ins | novel | c.3_4insA | p.Ala2SerfsTer47 | p.A2Sfs*47 | protein_coding | TCGA-A8-A079-01 | Breast | breast invasive carcinoma | Female | >=65 | III/IV | Chemotherapy | 5-fluorouracil | SD | |||
| SLC37A4 | deletion | Frame_Shift_Del | c.1230delN | p.Lys411SerfsTer14 | p.K411Sfs*14 | protein_coding | TCGA-D8-A1JD-01 | Breast | breast invasive carcinoma | Female | <65 | I/II | Chemotherapy | adriamycin | SD | ||||
| SLC37A4 | deletion | Frame_Shift_Del | novel | c.1171delG | p.Val391TrpfsTer34 | p.V391Wfs*34 | protein_coding | TCGA-EW-A2FV-01 | Breast | breast invasive carcinoma | Female | <65 | III/IV | Chemotherapy | docetaxel | SD | |||
| SLC37A4 | SNV | Missense_Mutation | c.44N>T | p.Ser15Leu | p.S15L | protein_coding | tolerated(0.58) | benign(0) | TCGA-EK-A2H0-01 | Cervix | cervical & endocervical cancer | Female | <65 | I/II | Chemotherapy | cisplatin | CR | ||
| SLC37A4 | SNV | Missense_Mutation | c.326N>G | p.Leu109Arg | p.L109R | protein_coding | deleterious(0) | probably_damaging(0.924) | TCGA-FU-A3HZ-01 | Cervix | cervical & endocervical cancer | Female | <65 | I/II | Chemotherapy | cisplatin | CR | ||
| SLC37A4 | SNV | Missense_Mutation | c.44N>T | p.Ser15Leu | p.S15L | protein_coding | tolerated(0.58) | benign(0) | TCGA-ZJ-A8QQ-01 | Cervix | cervical & endocervical cancer | Female | <65 | I/II | Chemotherapy | cisplatin | SD | ||
| SLC37A4 | SNV | Missense_Mutation | novel | c.67N>A | p.Leu23Met | p.L23M | protein_coding | tolerated(0.08) | possibly_damaging(0.811) | TCGA-A6-2672-01 | Colorectum | colon adenocarcinoma | Female | >=65 | III/IV | Unknown | Unknown | SD | |
| SLC37A4 | SNV | Missense_Mutation | c.229N>T | p.Arg77Cys | p.R77C | protein_coding | deleterious(0) | benign(0.393) | TCGA-A6-5656-01 | Colorectum | colon adenocarcinoma | Male | >=65 | I/II | Unknown | Unknown | SD |
| Page: 1 2 3 4 5 |
Top |
Related drugs of malignant transformation related genes |
| Identification of chemicals and drugs interact with genes involved in malignant transfromation |
| (DGIdb 4.0) |
| Entrez ID | Symbol | Category | Interaction Types | Drug Claim Name | Drug Name | PMIDs |
| Page: 1 |

Copyright 2023-Present -The University of Texas Health Science Center at Houston |