
|
|||||
|
 | |
| |
| |
| |
| |
| |
|
Gene: SLC37A2 |
Gene summary for SLC37A2 |
| Gene information | Species | Human | Gene symbol | SLC37A2 | Gene ID | 219855 |
| Gene name | solute carrier family 37 member 2 | |
| Gene Alias | SPX2 | |
| Cytomap | 11q24.2 | |
| Gene Type | protein-coding | GO ID | GO:0006810 | UniProtAcc | Q8TED4 |
Top |
Malignant transformation analysis |
| Identification of the aberrant gene expression in precancerous and cancerous lesions by comparing the gene expression of stem-like cells in diseased tissues with normal stem cells |
| Entrez ID | Symbol | Replicates | Species | Organ | Tissue | Adj P-value | Log2FC | Malignancy |
| 219855 | SLC37A2 | HTA11_2487_2000001011 | Human | Colorectum | SER | 2.14e-15 | 8.22e-01 | -0.1808 |
| 219855 | SLC37A2 | HTA11_78_2000001011 | Human | Colorectum | AD | 2.48e-07 | 5.26e-01 | -0.1088 |
| 219855 | SLC37A2 | HTA11_83_2000001011 | Human | Colorectum | SER | 4.06e-19 | 9.75e-01 | -0.1526 |
| 219855 | SLC37A2 | HTA11_1391_2000001011 | Human | Colorectum | AD | 1.02e-09 | 3.53e-01 | -0.059 |
| 219855 | SLC37A2 | HTA11_10711_2000001011 | Human | Colorectum | AD | 6.02e-03 | 1.63e-01 | 0.0338 |
| 219855 | SLC37A2 | LZE24T | Human | Esophagus | ESCC | 5.57e-04 | 2.09e-01 | 0.0596 |
| 219855 | SLC37A2 | P4T-E | Human | Esophagus | ESCC | 2.43e-03 | 1.67e-01 | 0.1323 |
| 219855 | SLC37A2 | P11T-E | Human | Esophagus | ESCC | 1.60e-04 | 2.77e-01 | 0.1426 |
| 219855 | SLC37A2 | P15T-E | Human | Esophagus | ESCC | 1.32e-03 | 1.66e-01 | 0.1149 |
| 219855 | SLC37A2 | P21T-E | Human | Esophagus | ESCC | 2.91e-14 | 3.03e-01 | 0.1617 |
| 219855 | SLC37A2 | P22T-E | Human | Esophagus | ESCC | 8.84e-05 | 1.12e-01 | 0.1236 |
| 219855 | SLC37A2 | P26T-E | Human | Esophagus | ESCC | 1.47e-14 | 2.96e-01 | 0.1276 |
| 219855 | SLC37A2 | P28T-E | Human | Esophagus | ESCC | 1.78e-03 | 8.89e-02 | 0.1149 |
| 219855 | SLC37A2 | P30T-E | Human | Esophagus | ESCC | 4.50e-10 | 4.35e-01 | 0.137 |
| 219855 | SLC37A2 | P31T-E | Human | Esophagus | ESCC | 5.03e-37 | 5.89e-01 | 0.1251 |
| 219855 | SLC37A2 | P32T-E | Human | Esophagus | ESCC | 2.02e-06 | 1.51e-01 | 0.1666 |
| 219855 | SLC37A2 | P37T-E | Human | Esophagus | ESCC | 7.16e-07 | 1.91e-01 | 0.1371 |
| 219855 | SLC37A2 | P42T-E | Human | Esophagus | ESCC | 1.25e-03 | 2.15e-01 | 0.1175 |
| 219855 | SLC37A2 | P49T-E | Human | Esophagus | ESCC | 5.47e-13 | 1.46e+00 | 0.1768 |
| 219855 | SLC37A2 | P54T-E | Human | Esophagus | ESCC | 3.86e-05 | 1.88e-01 | 0.0975 |
| Page: 1 2 |
| Tissue | Expression Dynamics | Abbreviation |
| Colorectum (GSE201348) |  | FAP: Familial adenomatous polyposis |
| CRC: Colorectal cancer | ||
| Colorectum (HTA11) |  | AD: Adenomas |
| SER: Sessile serrated lesions | ||
| MSI-H: Microsatellite-high colorectal cancer | ||
| MSS: Microsatellite stable colorectal cancer | ||
| Esophagus | 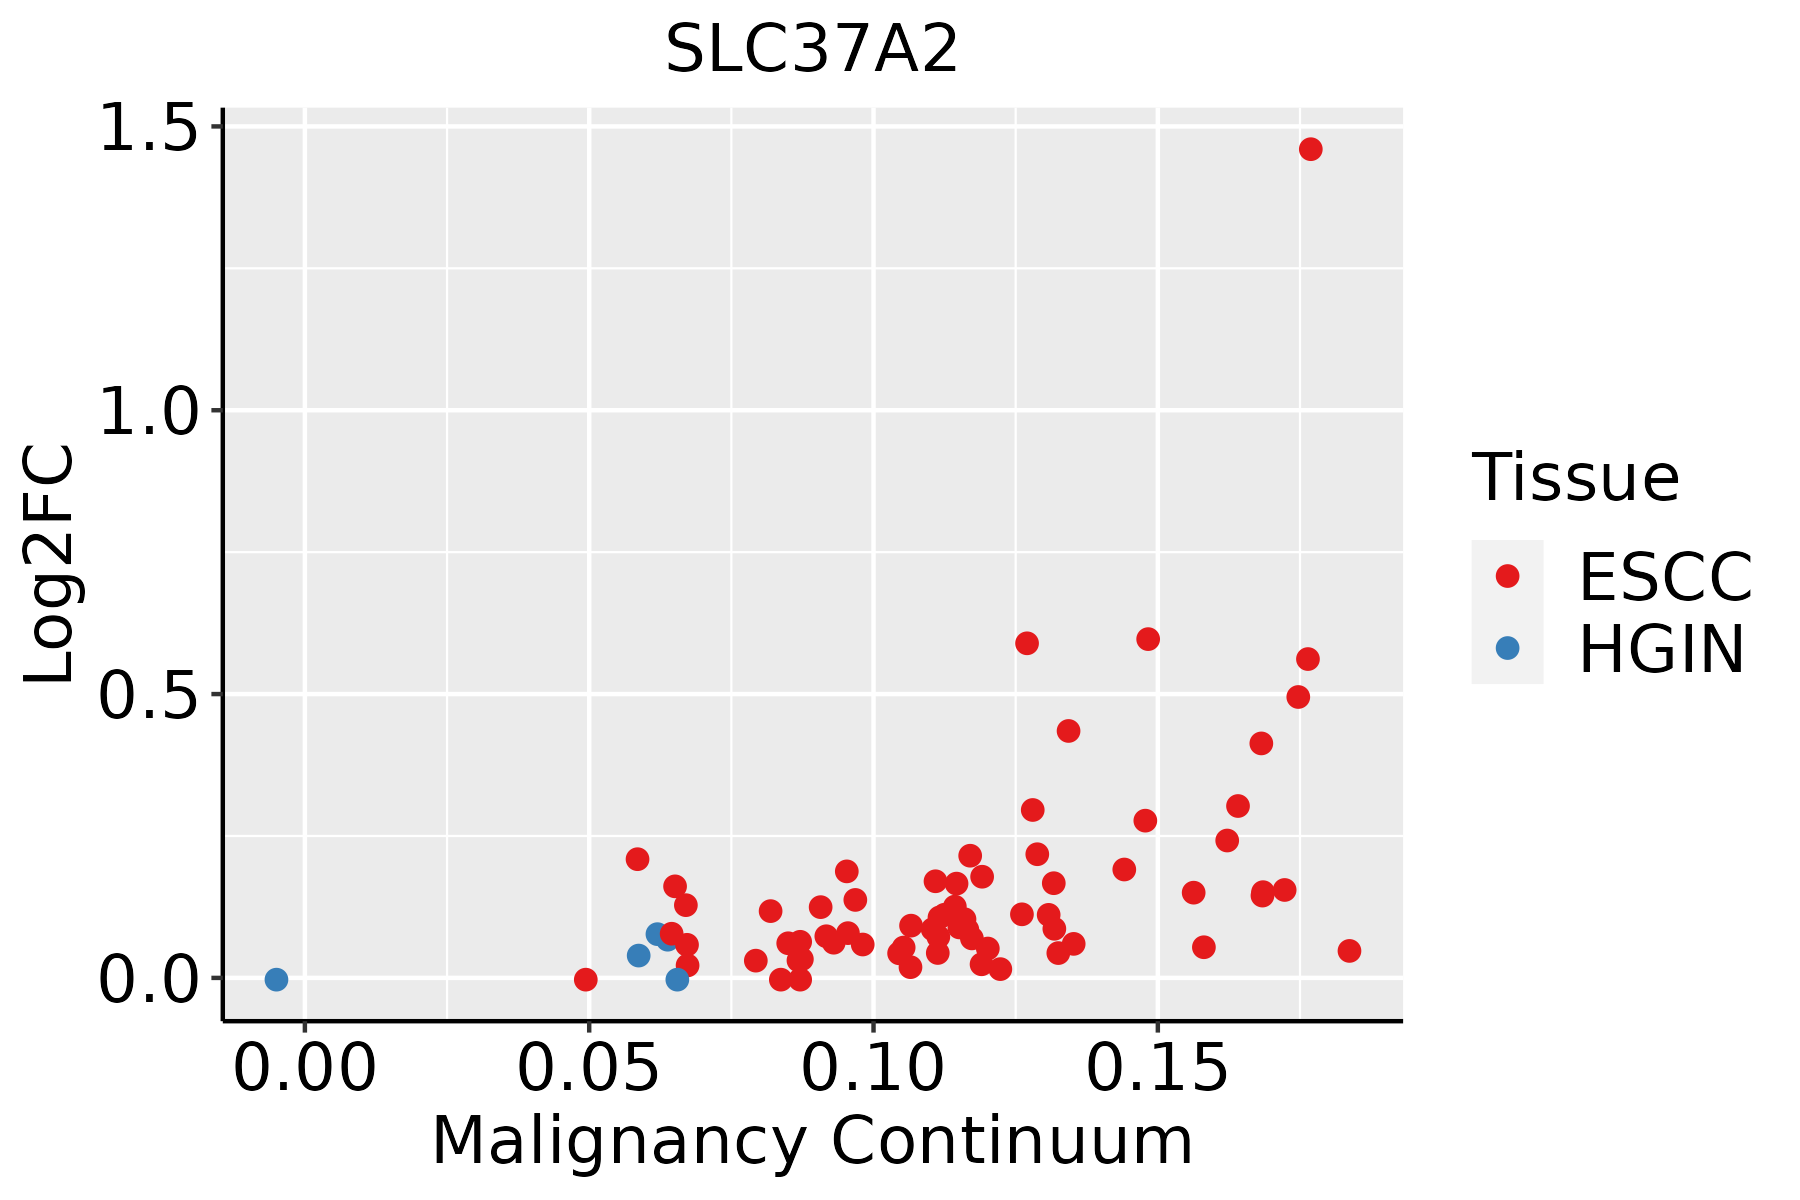 | ESCC: Esophageal squamous cell carcinoma |
| HGIN: High-grade intraepithelial neoplasias | ||
| LGIN: Low-grade intraepithelial neoplasias |
| ∗log2FC in expression of this searched gene in stem-like cells from each diseased tissue sample relative to stem-like cells in normal samples in each tissue plotted against the malignancy continuum. Samples are colored based on if they are from different disease stage. |
Top |
Malignant transformation related pathway analysis |
| Find out the enriched GO biological processes and KEGG pathways involved in transition from healthy to precancer to cancer |
| Tissue | Disease Stage | Enriched GO biological Processes |
| Colorectum | AD |  |
| Colorectum | SER |  |
| Colorectum | MSS |  |
| Colorectum | MSI-H |  |
| Colorectum | FAP |  |
| ∗Top 15 enriched GO BP terms are showed in the bar plot of each disease state in each tissue. Each row represents a significant GO biological process which is colored according to the -log10(p.adjust). |
| Page: 1 2 3 4 5 6 7 8 9 |
| GO ID | Tissue | Disease Stage | Description | Gene Ratio | Bg Ratio | pvalue | p.adjust | Count |
| GO:0015698 | Colorectum | AD | inorganic anion transport | 52/3918 | 180/18723 | 6.83e-03 | 4.22e-02 | 52 |
| GO:0015748 | Colorectum | AD | organophosphate ester transport | 42/3918 | 140/18723 | 7.04e-03 | 4.31e-02 | 42 |
| Page: 1 |
| Pathway ID | Tissue | Disease Stage | Description | Gene Ratio | Bg Ratio | pvalue | p.adjust | qvalue | Count |
| Page: 1 |
Top |
Cell-cell communication analysis |
| Identification of potential cell-cell interactions between two cell types and their ligand-receptor pairs for different disease states |
| Ligand | Receptor | LRpair | Pathway | Tissue | Disease Stage |
| Page: 1 |
Top |
Single-cell gene regulatory network inference analysis |
| Find out the significant the regulons (TFs) and the target genes of each regulon across cell types for different disease states |
| TF | Cell Type | Tissue | Disease Stage | Target Gene | RSS | Regulon Activity |
| ∗The dot plots of a searched regulon are shown for all cell subpopulations in each disease state of each tissue based on the regulon specific score inferred using pySCENIC and by calculating the average expression. |
| Page: 1 |
Top |
Somatic mutation of malignant transformation related genes |
| Annotation of somatic variants for genes involved in malignant transformation |
| Hugo Symbol | Variant Class | Variant Classification | dbSNP RS | HGVSc | HGVSp | HGVSp Short | SWISSPROT | BIOTYPE | SIFT | PolyPhen | Tumor Sample Barcode | Tissue | Histology | Sex | Age | Stage | Therapy Types | Drugs | Outcome |
| SLC37A2 | SNV | Missense_Mutation | novel | c.515N>A | p.Phe172Tyr | p.F172Y | Q8TED4 | protein_coding | deleterious(0.01) | probably_damaging(0.95) | TCGA-A8-A09A-01 | Breast | breast invasive carcinoma | Female | <65 | I/II | Hormone Therapy | tamoxiphen | SD |
| SLC37A2 | SNV | Missense_Mutation | novel | c.745G>A | p.Glu249Lys | p.E249K | Q8TED4 | protein_coding | tolerated(0.43) | benign(0) | TCGA-A8-A0A7-01 | Breast | breast invasive carcinoma | Female | <65 | I/II | Unknown | Unknown | SD |
| SLC37A2 | SNV | Missense_Mutation | c.1389C>G | p.Phe463Leu | p.F463L | Q8TED4 | protein_coding | deleterious(0) | probably_damaging(0.99) | TCGA-AC-A23H-01 | Breast | breast invasive carcinoma | Female | >=65 | I/II | Unknown | Unknown | PD | |
| SLC37A2 | SNV | Missense_Mutation | c.252N>C | p.Lys84Asn | p.K84N | Q8TED4 | protein_coding | tolerated(0.22) | benign(0.012) | TCGA-BH-A0BG-01 | Breast | breast invasive carcinoma | Female | >=65 | I/II | Unknown | Unknown | SD | |
| SLC37A2 | SNV | Missense_Mutation | c.356N>T | p.Ser119Leu | p.S119L | Q8TED4 | protein_coding | deleterious(0) | possibly_damaging(0.543) | TCGA-E9-A226-01 | Breast | breast invasive carcinoma | Female | <65 | III/IV | Hormone Therapy | tamoxiphen | PD | |
| SLC37A2 | SNV | Missense_Mutation | rs765345931 | c.1342N>T | p.Pro448Ser | p.P448S | Q8TED4 | protein_coding | deleterious(0) | probably_damaging(1) | TCGA-2W-A8YY-01 | Cervix | cervical & endocervical cancer | Female | <65 | I/II | Chemotherapy | cisplatin | CR |
| SLC37A2 | SNV | Missense_Mutation | rs201149895 | c.1436N>A | p.Arg479Gln | p.R479Q | Q8TED4 | protein_coding | deleterious(0.01) | probably_damaging(0.979) | TCGA-C5-A1MN-01 | Cervix | cervical & endocervical cancer | Female | <65 | III/IV | Chemotherapy | cisplatin | SD |
| SLC37A2 | SNV | Missense_Mutation | rs543083936 | c.1276N>A | p.Ala426Thr | p.A426T | Q8TED4 | protein_coding | deleterious(0.04) | benign(0.153) | TCGA-AA-3845-01 | Colorectum | colon adenocarcinoma | Female | >=65 | I/II | Unknown | Unknown | PD |
| SLC37A2 | SNV | Missense_Mutation | rs777281104 | c.715G>A | p.Ala239Thr | p.A239T | Q8TED4 | protein_coding | tolerated(0.44) | benign(0) | TCGA-AA-3947-01 | Colorectum | colon adenocarcinoma | Female | <65 | I/II | Unknown | Unknown | SD |
| SLC37A2 | SNV | Missense_Mutation | c.451N>T | p.Val151Phe | p.V151F | Q8TED4 | protein_coding | deleterious(0) | benign(0.138) | TCGA-AY-6197-01 | Colorectum | colon adenocarcinoma | Male | <65 | I/II | Unknown | Unknown | SD |
| Page: 1 2 3 4 5 6 |
Top |
Related drugs of malignant transformation related genes |
| Identification of chemicals and drugs interact with genes involved in malignant transfromation |
| (DGIdb 4.0) |
| Entrez ID | Symbol | Category | Interaction Types | Drug Claim Name | Drug Name | PMIDs |
| Page: 1 |

Copyright 2023-Present -The University of Texas Health Science Center at Houston |