
|
|||||
|
 | |
| |
| |
| |
| |
| |
|
Gene: SLC35G2 |
Gene summary for SLC35G2 |
| Gene information | Species | Human | Gene symbol | SLC35G2 | Gene ID | 80723 |
| Gene name | solute carrier family 35 member G2 | |
| Gene Alias | TMEM22 | |
| Cytomap | 3q22.3 | |
| Gene Type | protein-coding | GO ID | GO:0005575 | UniProtAcc | Q8TBE7 |
Top |
Malignant transformation analysis |
| Identification of the aberrant gene expression in precancerous and cancerous lesions by comparing the gene expression of stem-like cells in diseased tissues with normal stem cells |
| Entrez ID | Symbol | Replicates | Species | Organ | Tissue | Adj P-value | Log2FC | Malignancy |
| 80723 | SLC35G2 | CCI_1 | Human | Cervix | CC | 8.33e-06 | 3.69e-01 | 0.528 |
| 80723 | SLC35G2 | CCI_2 | Human | Cervix | CC | 9.58e-09 | 4.91e-01 | 0.5249 |
| 80723 | SLC35G2 | CCI_3 | Human | Cervix | CC | 2.82e-16 | 7.97e-01 | 0.516 |
| 80723 | SLC35G2 | T3 | Human | Cervix | CC | 9.19e-06 | 1.20e-01 | 0.1389 |
| 80723 | SLC35G2 | LZE6T | Human | Esophagus | ESCC | 1.94e-04 | 2.73e-01 | 0.0845 |
| 80723 | SLC35G2 | P9T-E | Human | Esophagus | ESCC | 7.62e-07 | 2.07e-01 | 0.1131 |
| 80723 | SLC35G2 | P12T-E | Human | Esophagus | ESCC | 2.06e-08 | 1.69e-01 | 0.1122 |
| 80723 | SLC35G2 | P15T-E | Human | Esophagus | ESCC | 6.25e-05 | 1.21e-01 | 0.1149 |
| 80723 | SLC35G2 | P16T-E | Human | Esophagus | ESCC | 1.12e-13 | 2.65e-01 | 0.1153 |
| 80723 | SLC35G2 | P20T-E | Human | Esophagus | ESCC | 5.93e-07 | 1.82e-01 | 0.1124 |
| 80723 | SLC35G2 | P23T-E | Human | Esophagus | ESCC | 1.12e-02 | 1.41e-01 | 0.108 |
| 80723 | SLC35G2 | P24T-E | Human | Esophagus | ESCC | 7.44e-08 | 1.87e-01 | 0.1287 |
| 80723 | SLC35G2 | P26T-E | Human | Esophagus | ESCC | 7.23e-06 | 7.46e-02 | 0.1276 |
| 80723 | SLC35G2 | P27T-E | Human | Esophagus | ESCC | 4.67e-05 | 1.18e-01 | 0.1055 |
| 80723 | SLC35G2 | P31T-E | Human | Esophagus | ESCC | 2.42e-03 | 1.22e-01 | 0.1251 |
| 80723 | SLC35G2 | P37T-E | Human | Esophagus | ESCC | 4.13e-08 | 1.96e-01 | 0.1371 |
| 80723 | SLC35G2 | P42T-E | Human | Esophagus | ESCC | 1.84e-04 | 1.18e-01 | 0.1175 |
| 80723 | SLC35G2 | P47T-E | Human | Esophagus | ESCC | 2.39e-04 | 1.20e-01 | 0.1067 |
| 80723 | SLC35G2 | P52T-E | Human | Esophagus | ESCC | 6.05e-06 | 8.84e-02 | 0.1555 |
| 80723 | SLC35G2 | P54T-E | Human | Esophagus | ESCC | 4.81e-02 | 7.27e-02 | 0.0975 |
| Page: 1 2 3 |
| Tissue | Expression Dynamics | Abbreviation |
| Cervix | 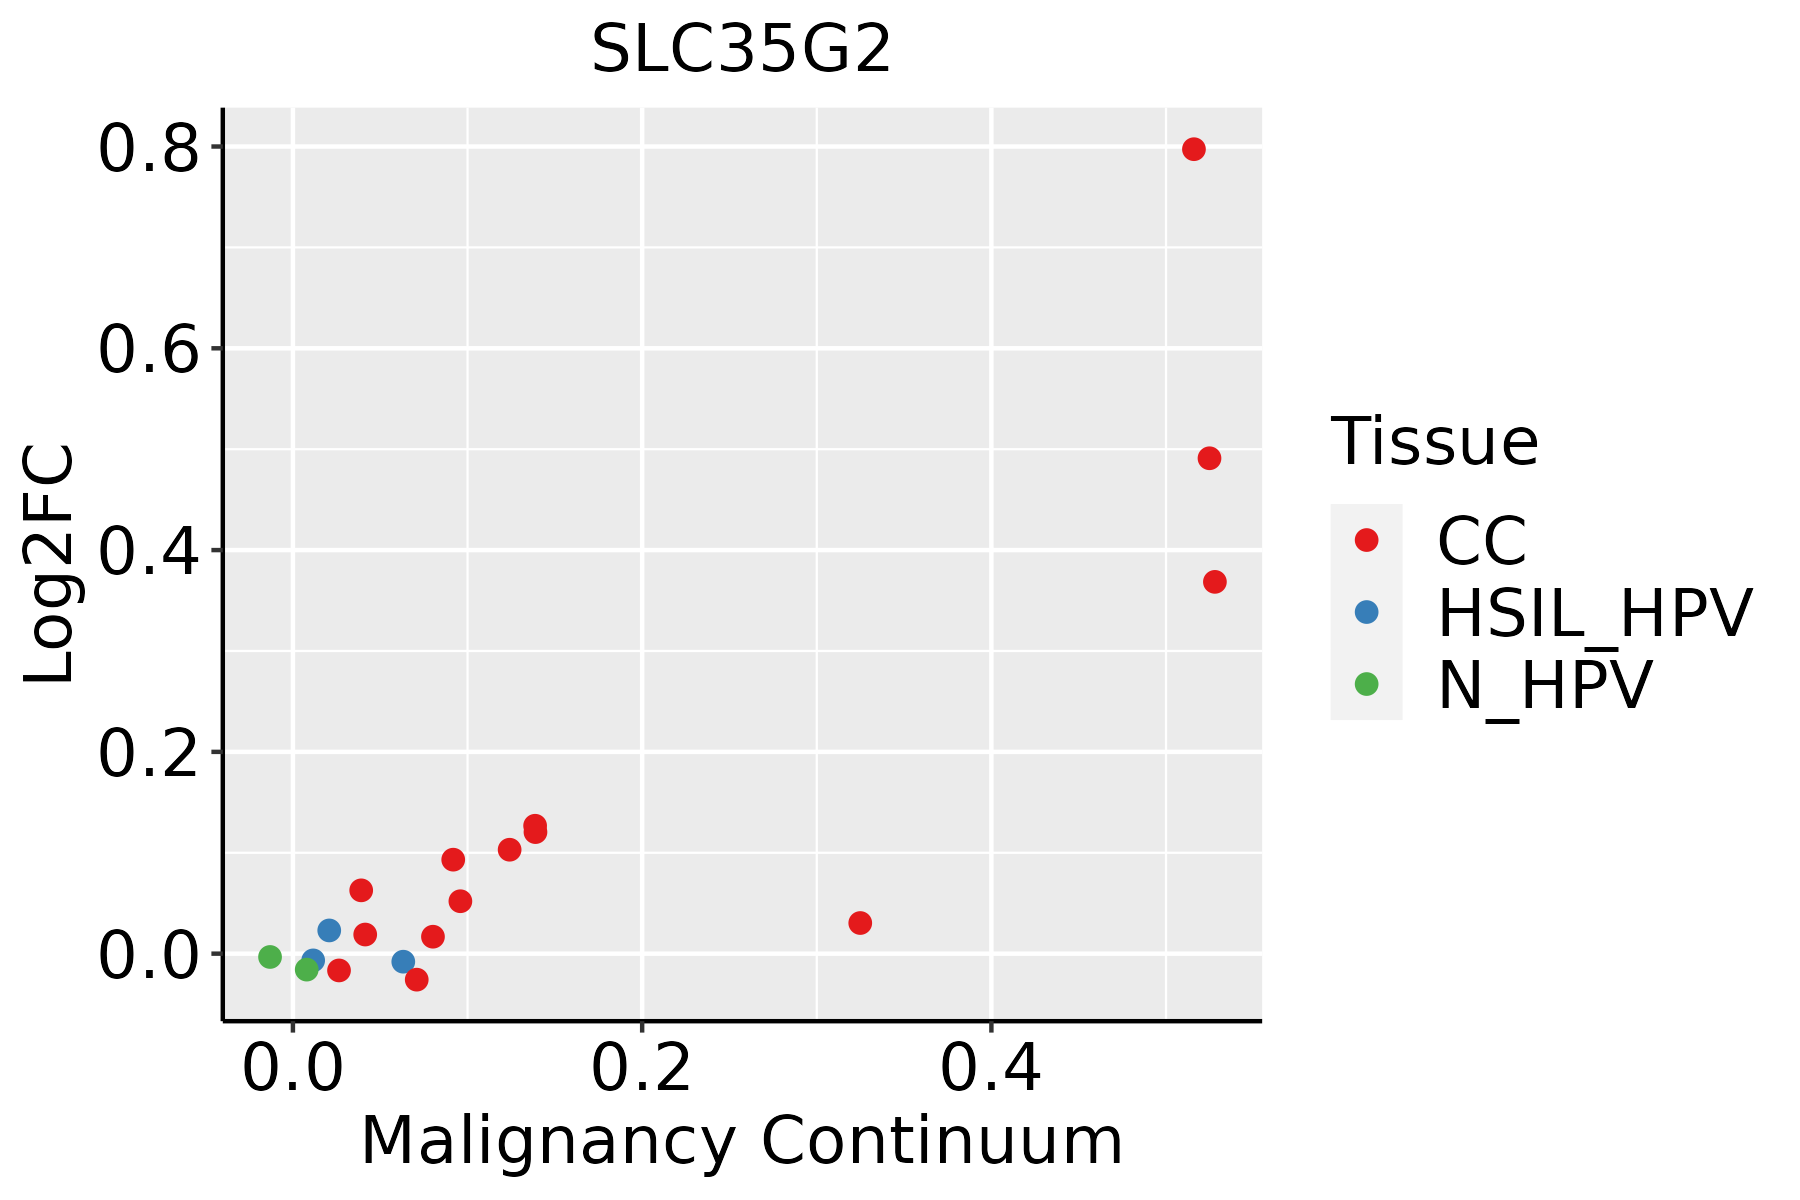 | CC: Cervix cancer |
| HSIL_HPV: HPV-infected high-grade squamous intraepithelial lesions | ||
| N_HPV: HPV-infected normal cervix | ||
| Esophagus | 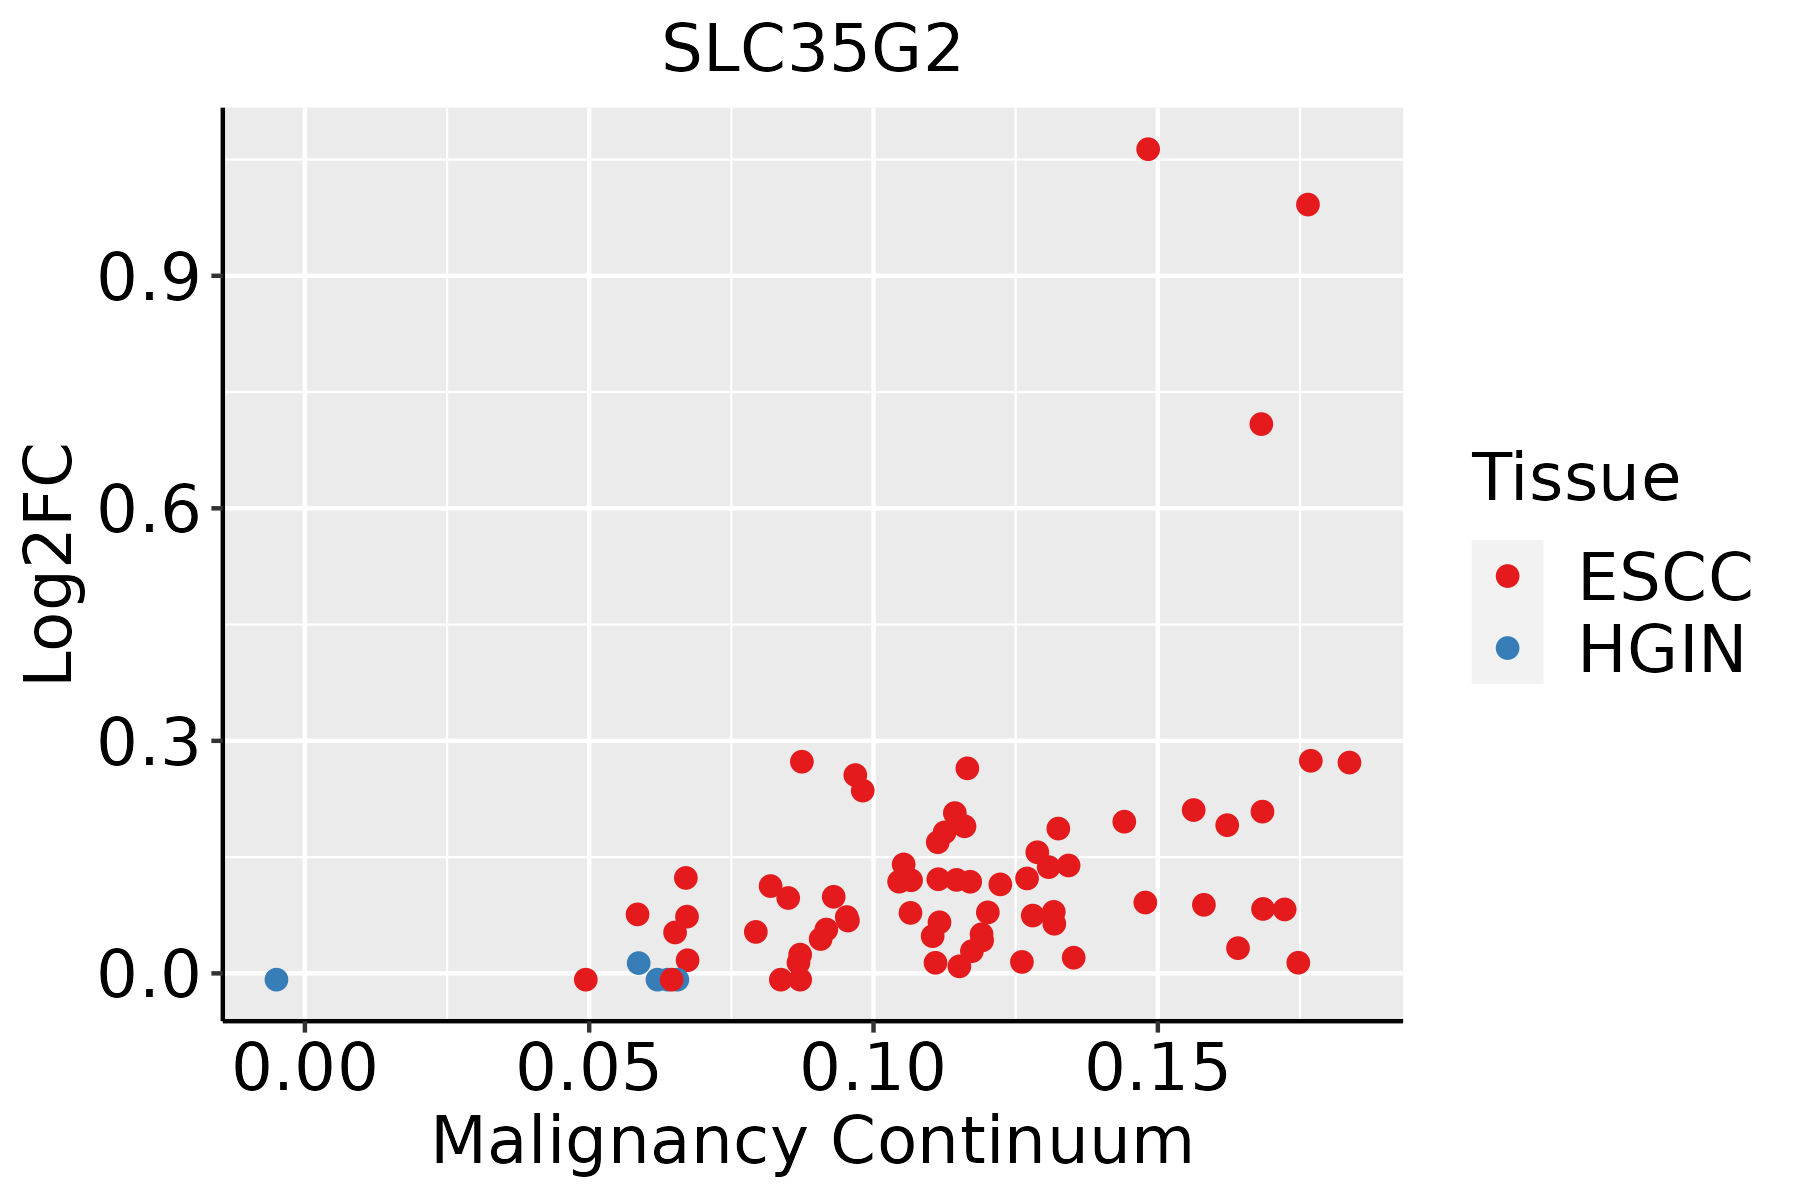 | ESCC: Esophageal squamous cell carcinoma |
| HGIN: High-grade intraepithelial neoplasias | ||
| LGIN: Low-grade intraepithelial neoplasias | ||
| Liver | 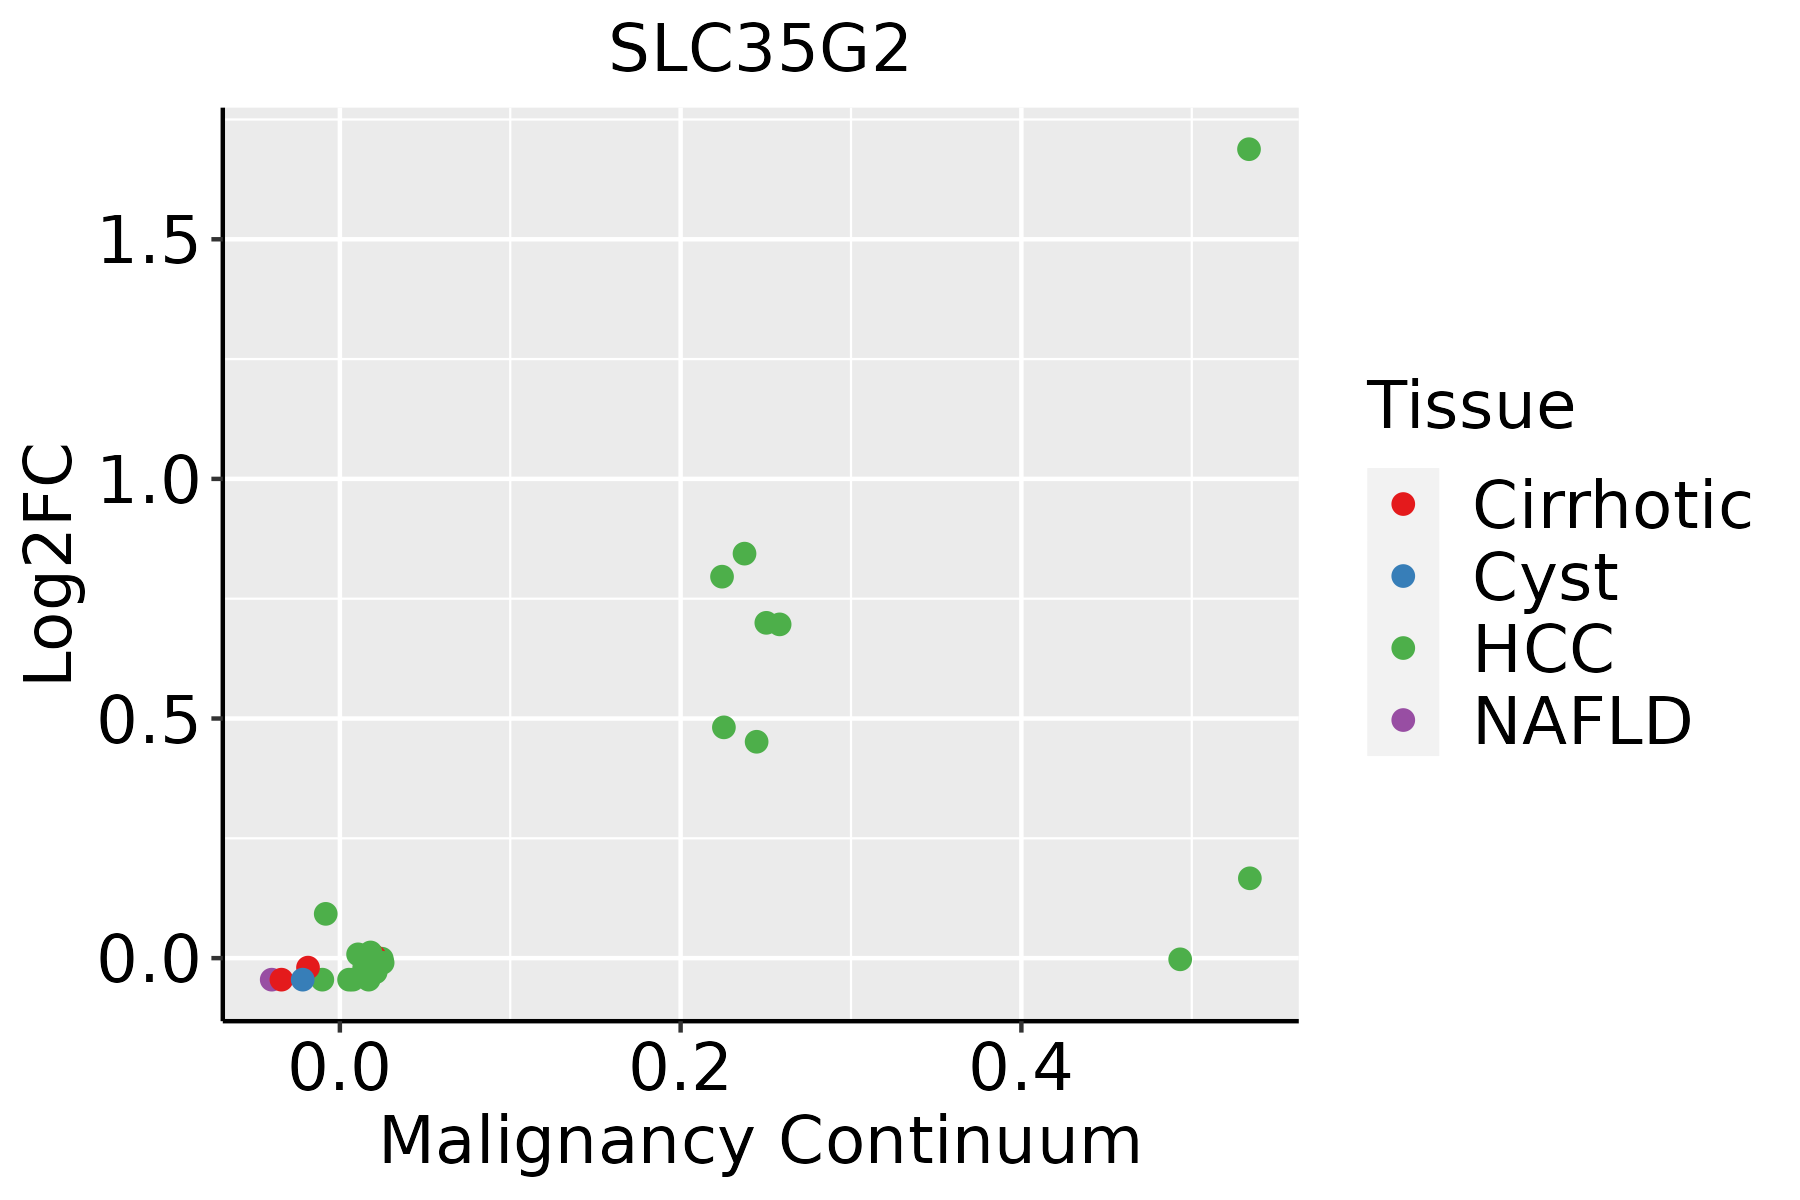 | HCC: Hepatocellular carcinoma |
| NAFLD: Non-alcoholic fatty liver disease | ||
| Oral Cavity | 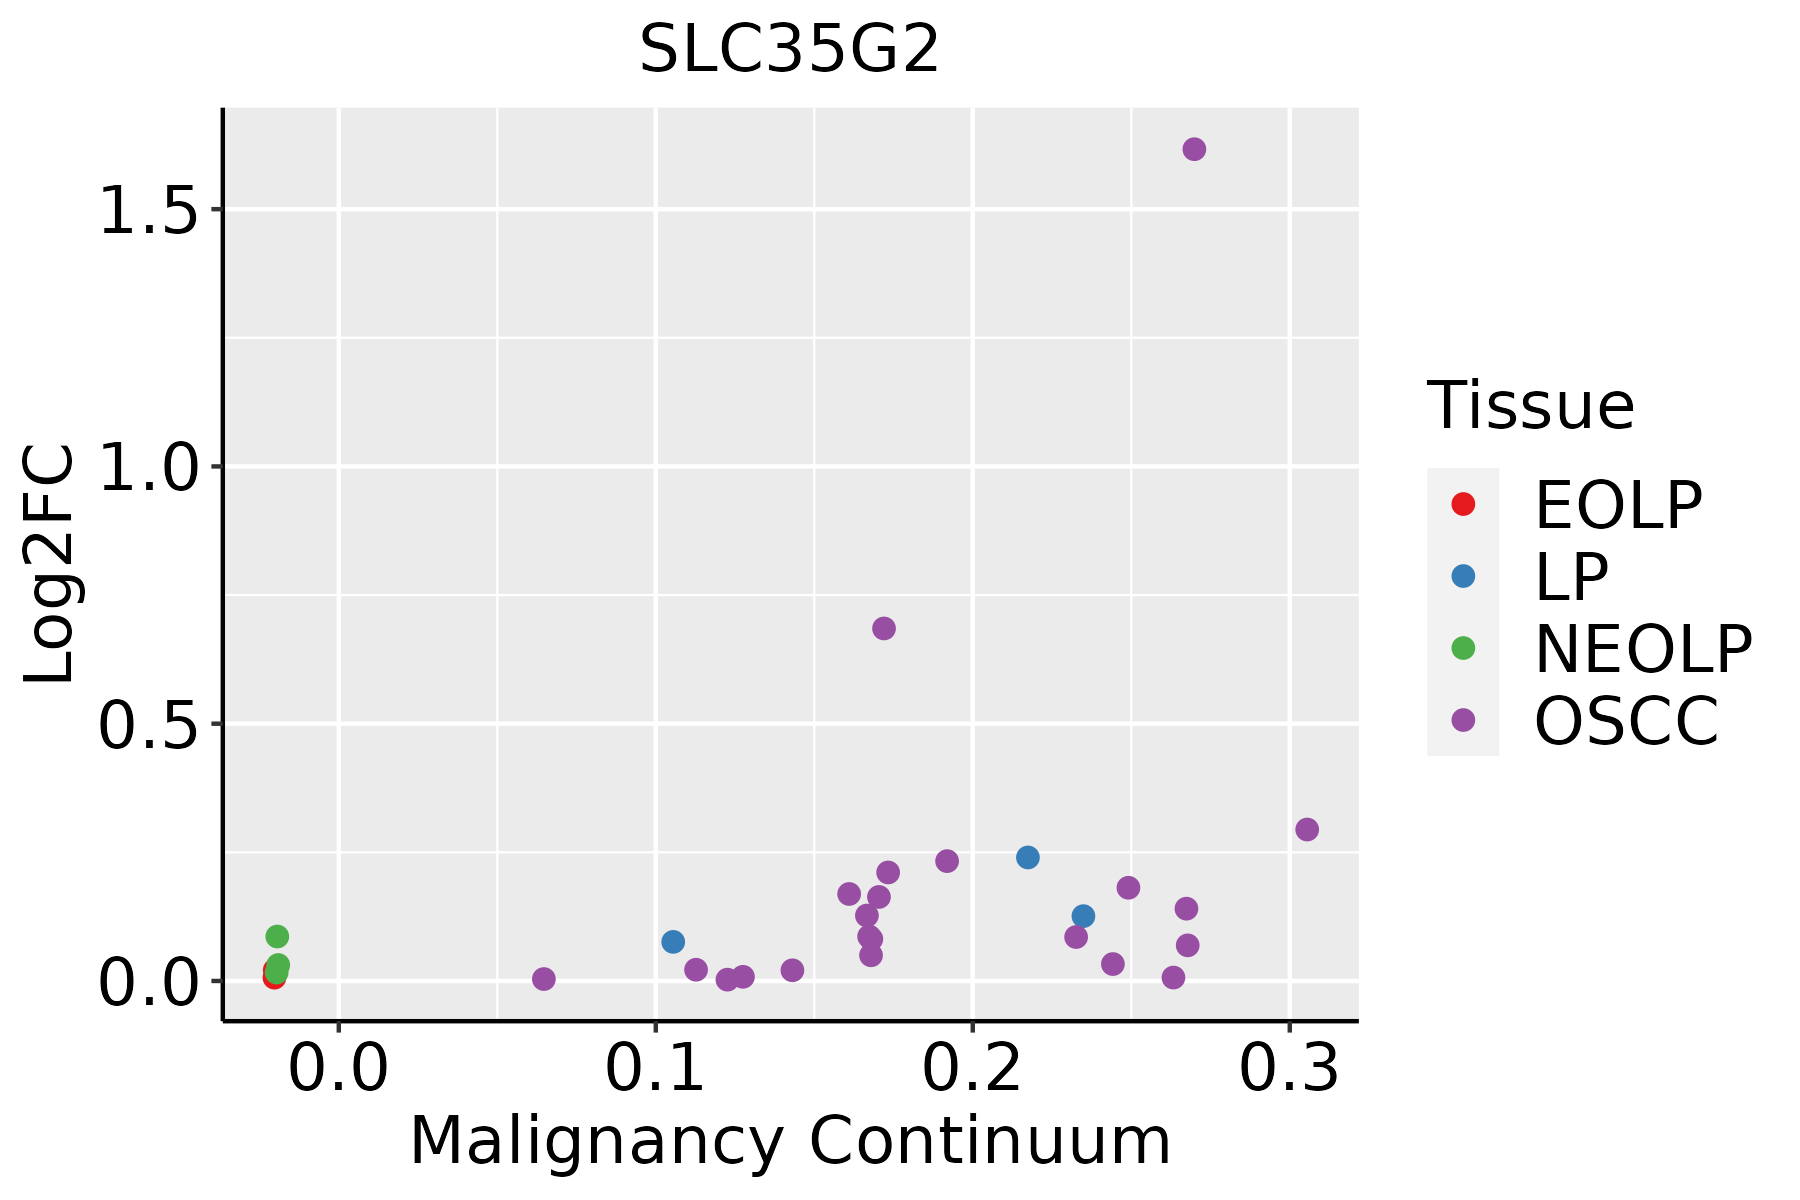 | EOLP: Erosive Oral lichen planus |
| LP: leukoplakia | ||
| NEOLP: Non-erosive oral lichen planus | ||
| OSCC: Oral squamous cell carcinoma |
| ∗log2FC in expression of this searched gene in stem-like cells from each diseased tissue sample relative to stem-like cells in normal samples in each tissue plotted against the malignancy continuum. Samples are colored based on if they are from different disease stage. |
Top |
Malignant transformation related pathway analysis |
| Find out the enriched GO biological processes and KEGG pathways involved in transition from healthy to precancer to cancer |
| Tissue | Disease Stage | Enriched GO biological Processes |
| Colorectum | AD |  |
| Colorectum | SER |  |
| Colorectum | MSS |  |
| Colorectum | MSI-H |  |
| Colorectum | FAP |  |
| ∗Top 15 enriched GO BP terms are showed in the bar plot of each disease state in each tissue. Each row represents a significant GO biological process which is colored according to the -log10(p.adjust). |
| Page: 1 2 3 4 5 6 7 8 9 |
| GO ID | Tissue | Disease Stage | Description | Gene Ratio | Bg Ratio | pvalue | p.adjust | Count |
| Page: 1 |
| Pathway ID | Tissue | Disease Stage | Description | Gene Ratio | Bg Ratio | pvalue | p.adjust | qvalue | Count |
| Page: 1 |
Top |
Cell-cell communication analysis |
| Identification of potential cell-cell interactions between two cell types and their ligand-receptor pairs for different disease states |
| Ligand | Receptor | LRpair | Pathway | Tissue | Disease Stage |
| Page: 1 |
Top |
Single-cell gene regulatory network inference analysis |
| Find out the significant the regulons (TFs) and the target genes of each regulon across cell types for different disease states |
| TF | Cell Type | Tissue | Disease Stage | Target Gene | RSS | Regulon Activity |
| ∗The dot plots of a searched regulon are shown for all cell subpopulations in each disease state of each tissue based on the regulon specific score inferred using pySCENIC and by calculating the average expression. |
| Page: 1 |
Top |
Somatic mutation of malignant transformation related genes |
| Annotation of somatic variants for genes involved in malignant transformation |
| Hugo Symbol | Variant Class | Variant Classification | dbSNP RS | HGVSc | HGVSp | HGVSp Short | SWISSPROT | BIOTYPE | SIFT | PolyPhen | Tumor Sample Barcode | Tissue | Histology | Sex | Age | Stage | Therapy Types | Drugs | Outcome |
| SLC35G2 | SNV | Missense_Mutation | novel | c.911N>G | p.Phe304Cys | p.F304C | Q8TBE7 | protein_coding | deleterious(0.04) | probably_damaging(0.957) | TCGA-AO-A0JD-01 | Breast | breast invasive carcinoma | Female | <65 | III/IV | Chemotherapy | cyclophosphamide | SD |
| SLC35G2 | SNV | Missense_Mutation | novel | c.1004T>C | p.Val335Ala | p.V335A | Q8TBE7 | protein_coding | tolerated(0.26) | probably_damaging(0.989) | TCGA-2W-A8YY-01 | Cervix | cervical & endocervical cancer | Female | <65 | I/II | Chemotherapy | cisplatin | CR |
| SLC35G2 | SNV | Missense_Mutation | novel | c.812N>T | p.Ser271Leu | p.S271L | Q8TBE7 | protein_coding | tolerated(0.05) | benign(0.259) | TCGA-Q1-A5R2-01 | Cervix | cervical & endocervical cancer | Female | <65 | I/II | Chemotherapy | cisplatin | PR |
| SLC35G2 | SNV | Missense_Mutation | novel | c.983N>T | p.Ser328Phe | p.S328F | Q8TBE7 | protein_coding | deleterious(0) | probably_damaging(0.996) | TCGA-Q1-A5R2-01 | Cervix | cervical & endocervical cancer | Female | <65 | I/II | Chemotherapy | cisplatin | PR |
| SLC35G2 | SNV | Missense_Mutation | novel | c.664G>A | p.Asp222Asn | p.D222N | Q8TBE7 | protein_coding | deleterious(0.01) | probably_damaging(0.999) | TCGA-VS-A8EK-01 | Cervix | cervical & endocervical cancer | Female | >=65 | I/II | Chemotherapy | cisplatin | PD |
| SLC35G2 | deletion | Frame_Shift_Del | rs758765963 | c.184delN | p.Arg66GlufsTer18 | p.R66Efs*18 | Q8TBE7 | protein_coding | TCGA-EA-A410-01 | Cervix | cervical & endocervical cancer | Female | <65 | I/II | Unknown | Unknown | SD | ||
| SLC35G2 | SNV | Missense_Mutation | novel | c.98N>A | p.Pro33His | p.P33H | Q8TBE7 | protein_coding | deleterious(0) | probably_damaging(0.997) | TCGA-AA-3877-01 | Colorectum | colon adenocarcinoma | Female | >=65 | I/II | Unknown | Unknown | SD |
| SLC35G2 | SNV | Missense_Mutation | novel | c.740N>A | p.Ser247Tyr | p.S247Y | Q8TBE7 | protein_coding | deleterious(0.02) | possibly_damaging(0.819) | TCGA-AA-3984-01 | Colorectum | colon adenocarcinoma | Female | <65 | I/II | Unknown | Unknown | SD |
| SLC35G2 | SNV | Missense_Mutation | rs570589760 | c.382N>T | p.Arg128Trp | p.R128W | Q8TBE7 | protein_coding | deleterious(0.01) | probably_damaging(0.999) | TCGA-AZ-6601-01 | Colorectum | colon adenocarcinoma | Male | >=65 | I/II | Unknown | Unknown | PD |
| SLC35G2 | SNV | Missense_Mutation | c.139N>C | p.Asn47His | p.N47H | Q8TBE7 | protein_coding | deleterious(0.01) | benign(0.001) | TCGA-CA-6717-01 | Colorectum | colon adenocarcinoma | Male | <65 | I/II | Chemotherapy | oxaliplatin | CR |
| Page: 1 2 3 4 5 6 |
Top |
Related drugs of malignant transformation related genes |
| Identification of chemicals and drugs interact with genes involved in malignant transfromation |
| (DGIdb 4.0) |
| Entrez ID | Symbol | Category | Interaction Types | Drug Claim Name | Drug Name | PMIDs |
| Page: 1 |

Copyright 2023-Present -The University of Texas Health Science Center at Houston |