
|
|||||
|
 | |
| |
| |
| |
| |
| |
|
Gene: SLC35G1 |
Gene summary for SLC35G1 |
| Gene information | Species | Human | Gene symbol | SLC35G1 | Gene ID | 159371 |
| Gene name | solute carrier family 35 member G1 | |
| Gene Alias | C10orf60 | |
| Cytomap | 10q23.33 | |
| Gene Type | protein-coding | GO ID | GO:0006810 | UniProtAcc | Q2M3R5 |
Top |
Malignant transformation analysis |
| Identification of the aberrant gene expression in precancerous and cancerous lesions by comparing the gene expression of stem-like cells in diseased tissues with normal stem cells |
| Entrez ID | Symbol | Replicates | Species | Organ | Tissue | Adj P-value | Log2FC | Malignancy |
| 159371 | SLC35G1 | LZE2T | Human | Esophagus | ESCC | 7.46e-04 | 6.01e-01 | 0.082 |
| 159371 | SLC35G1 | LZE4T | Human | Esophagus | ESCC | 2.54e-05 | 2.54e-01 | 0.0811 |
| 159371 | SLC35G1 | LZE24T | Human | Esophagus | ESCC | 7.39e-05 | 2.32e-01 | 0.0596 |
| 159371 | SLC35G1 | P2T-E | Human | Esophagus | ESCC | 4.31e-06 | 1.49e-01 | 0.1177 |
| 159371 | SLC35G1 | P4T-E | Human | Esophagus | ESCC | 4.70e-08 | 2.72e-01 | 0.1323 |
| 159371 | SLC35G1 | P9T-E | Human | Esophagus | ESCC | 3.88e-02 | 1.42e-01 | 0.1131 |
| 159371 | SLC35G1 | P12T-E | Human | Esophagus | ESCC | 9.44e-07 | 1.66e-01 | 0.1122 |
| 159371 | SLC35G1 | P15T-E | Human | Esophagus | ESCC | 1.09e-15 | 3.94e-01 | 0.1149 |
| 159371 | SLC35G1 | P22T-E | Human | Esophagus | ESCC | 4.12e-11 | 2.11e-01 | 0.1236 |
| 159371 | SLC35G1 | P23T-E | Human | Esophagus | ESCC | 1.53e-02 | 1.04e-01 | 0.108 |
| 159371 | SLC35G1 | P26T-E | Human | Esophagus | ESCC | 3.45e-11 | 2.85e-01 | 0.1276 |
| 159371 | SLC35G1 | P27T-E | Human | Esophagus | ESCC | 3.89e-12 | 2.64e-01 | 0.1055 |
| 159371 | SLC35G1 | P28T-E | Human | Esophagus | ESCC | 3.58e-28 | 5.55e-01 | 0.1149 |
| 159371 | SLC35G1 | P30T-E | Human | Esophagus | ESCC | 8.26e-41 | 1.29e+00 | 0.137 |
| 159371 | SLC35G1 | P32T-E | Human | Esophagus | ESCC | 4.31e-06 | 1.20e-01 | 0.1666 |
| 159371 | SLC35G1 | P36T-E | Human | Esophagus | ESCC | 3.49e-03 | 1.82e-01 | 0.1187 |
| 159371 | SLC35G1 | P37T-E | Human | Esophagus | ESCC | 5.22e-03 | 1.42e-01 | 0.1371 |
| 159371 | SLC35G1 | P39T-E | Human | Esophagus | ESCC | 3.75e-03 | 7.69e-02 | 0.0894 |
| 159371 | SLC35G1 | P48T-E | Human | Esophagus | ESCC | 4.17e-05 | 1.87e-01 | 0.0959 |
| 159371 | SLC35G1 | P52T-E | Human | Esophagus | ESCC | 9.67e-18 | 4.85e-01 | 0.1555 |
| Page: 1 2 |
| Tissue | Expression Dynamics | Abbreviation |
| Esophagus | 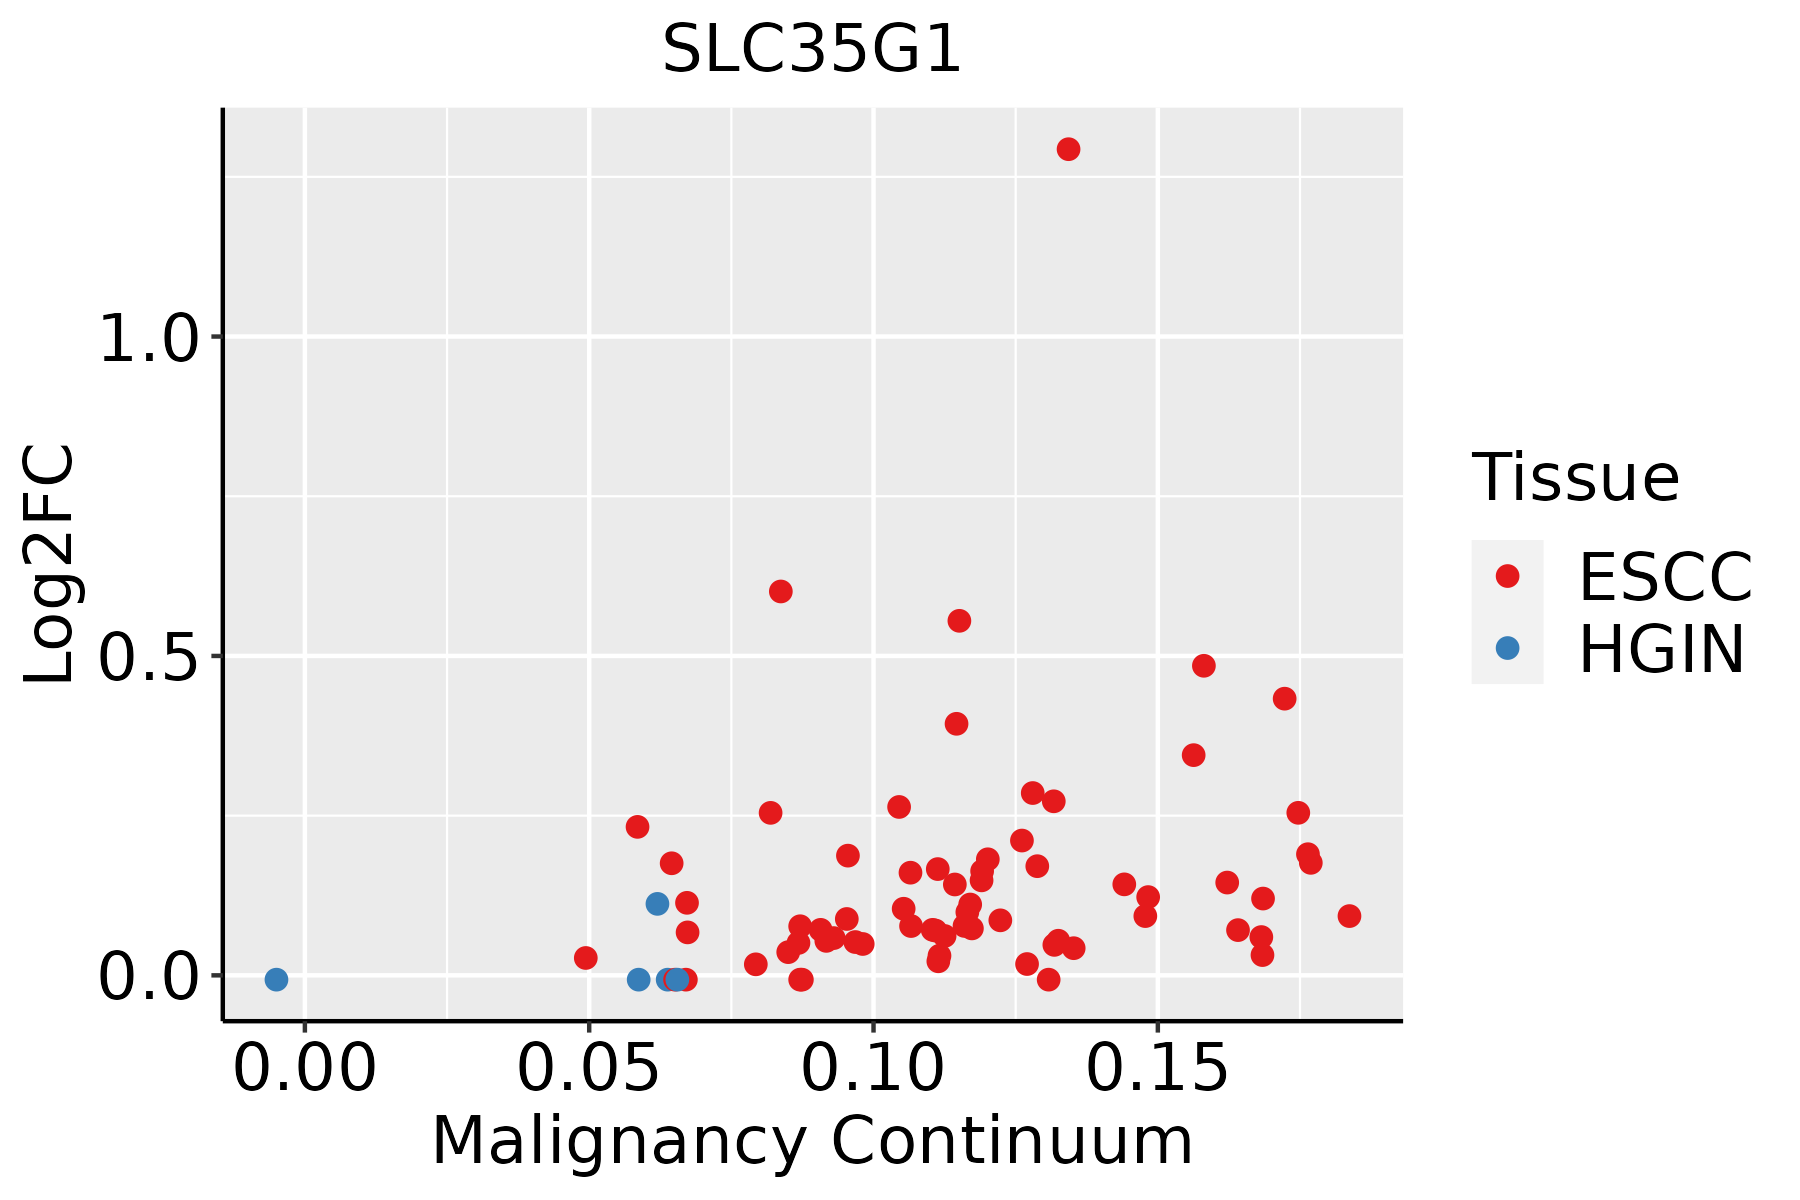 | ESCC: Esophageal squamous cell carcinoma |
| HGIN: High-grade intraepithelial neoplasias | ||
| LGIN: Low-grade intraepithelial neoplasias | ||
| GC | 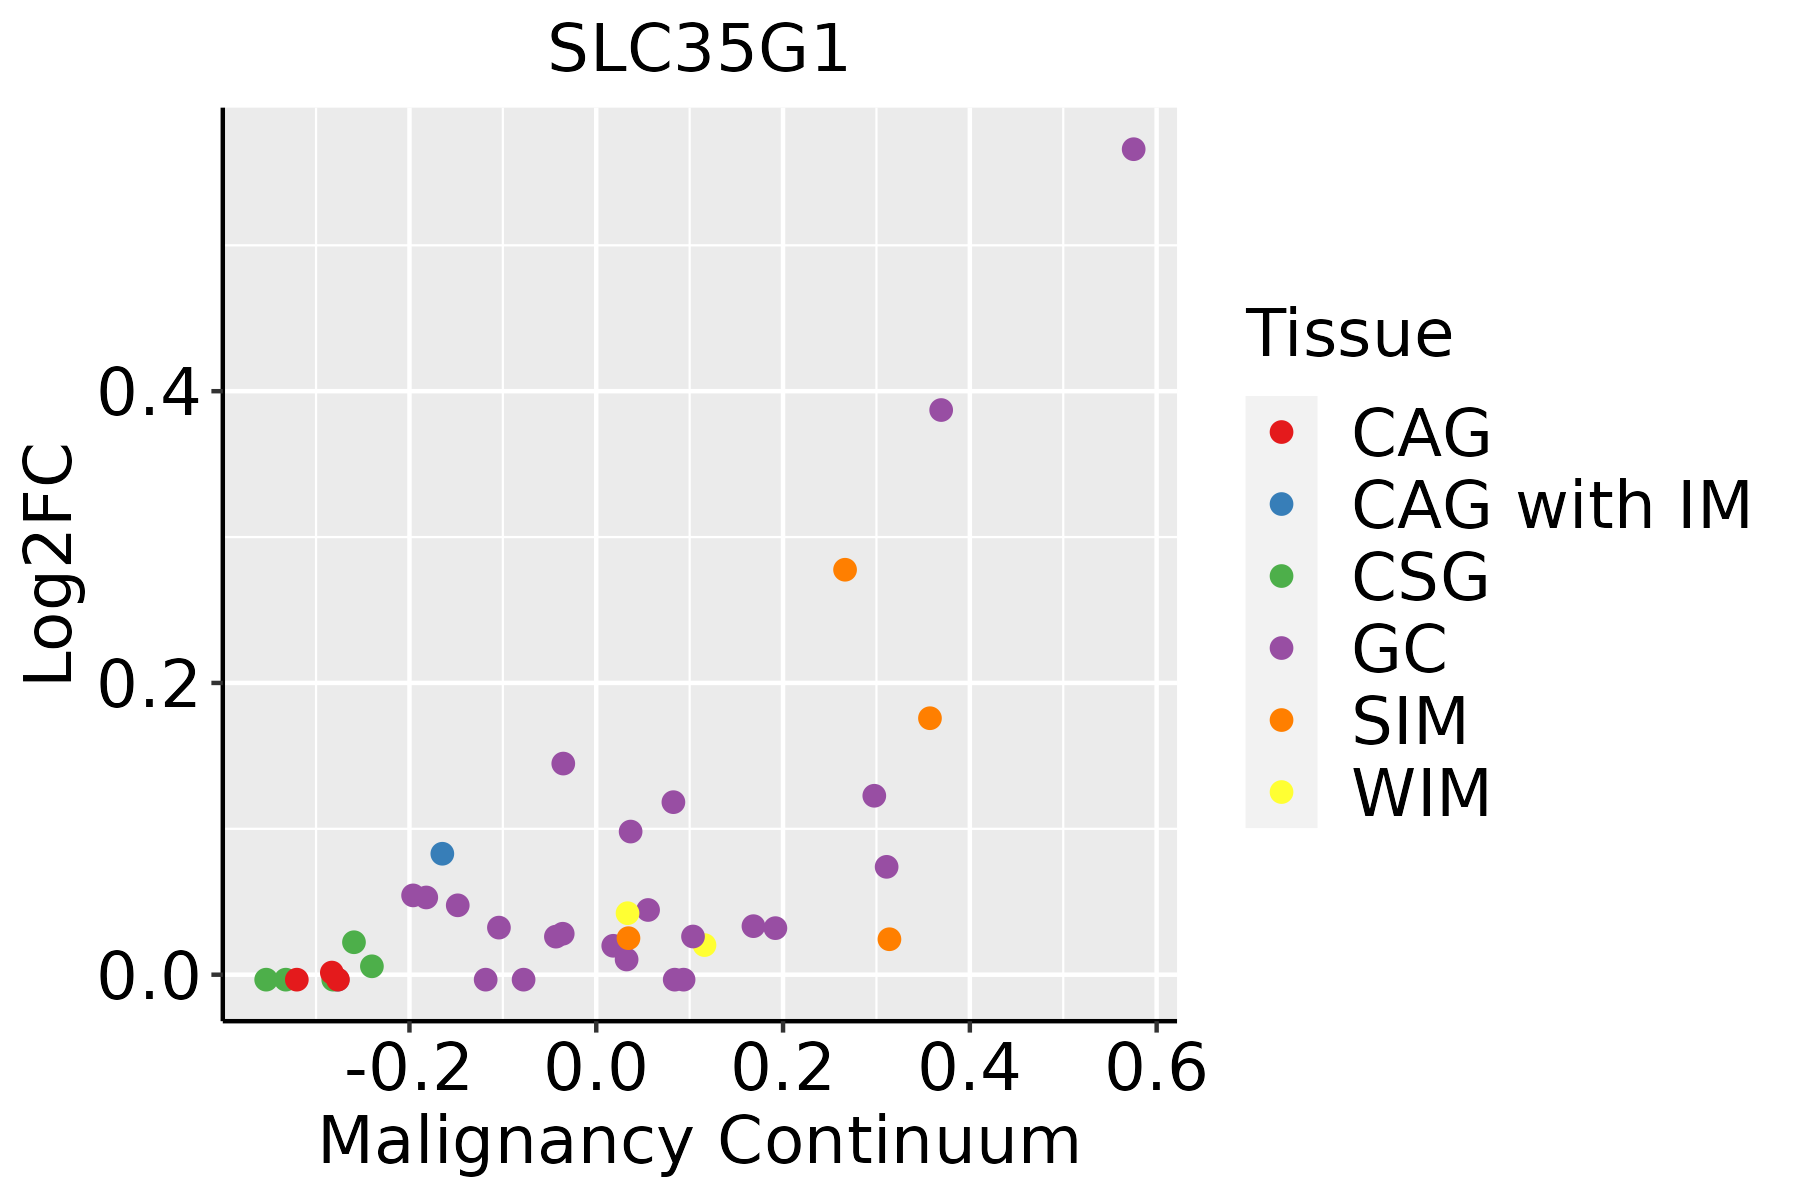 | CAG: Chronic atrophic gastritis |
| CAG with IM: Chronic atrophic gastritis with intestinal metaplasia | ||
| CSG: Chronic superficial gastritis | ||
| GC: Gastric cancer | ||
| SIM: Severe intestinal metaplasia | ||
| WIM: Wild intestinal metaplasia |
| ∗log2FC in expression of this searched gene in stem-like cells from each diseased tissue sample relative to stem-like cells in normal samples in each tissue plotted against the malignancy continuum. Samples are colored based on if they are from different disease stage. |
Top |
Malignant transformation related pathway analysis |
| Find out the enriched GO biological processes and KEGG pathways involved in transition from healthy to precancer to cancer |
| Tissue | Disease Stage | Enriched GO biological Processes |
| Colorectum | AD |  |
| Colorectum | SER |  |
| Colorectum | MSS |  |
| Colorectum | MSI-H |  |
| Colorectum | FAP |  |
| ∗Top 15 enriched GO BP terms are showed in the bar plot of each disease state in each tissue. Each row represents a significant GO biological process which is colored according to the -log10(p.adjust). |
| Page: 1 2 3 4 5 6 7 8 9 |
| GO ID | Tissue | Disease Stage | Description | Gene Ratio | Bg Ratio | pvalue | p.adjust | Count |
| Page: 1 |
| Pathway ID | Tissue | Disease Stage | Description | Gene Ratio | Bg Ratio | pvalue | p.adjust | qvalue | Count |
| Page: 1 |
Top |
Cell-cell communication analysis |
| Identification of potential cell-cell interactions between two cell types and their ligand-receptor pairs for different disease states |
| Ligand | Receptor | LRpair | Pathway | Tissue | Disease Stage |
| Page: 1 |
Top |
Single-cell gene regulatory network inference analysis |
| Find out the significant the regulons (TFs) and the target genes of each regulon across cell types for different disease states |
| TF | Cell Type | Tissue | Disease Stage | Target Gene | RSS | Regulon Activity |
| ∗The dot plots of a searched regulon are shown for all cell subpopulations in each disease state of each tissue based on the regulon specific score inferred using pySCENIC and by calculating the average expression. |
| Page: 1 |
Top |
Somatic mutation of malignant transformation related genes |
| Annotation of somatic variants for genes involved in malignant transformation |
| Hugo Symbol | Variant Class | Variant Classification | dbSNP RS | HGVSc | HGVSp | HGVSp Short | SWISSPROT | BIOTYPE | SIFT | PolyPhen | Tumor Sample Barcode | Tissue | Histology | Sex | Age | Stage | Therapy Types | Drugs | Outcome |
| SLC35G1 | SNV | Missense_Mutation | novel | c.206N>T | p.Gly69Val | p.G69V | Q2M3R5 | protein_coding | deleterious(0.02) | probably_damaging(0.976) | TCGA-A2-A25A-01 | Breast | breast invasive carcinoma | Female | <65 | I/II | Unspecific | Cytoxan | SD |
| SLC35G1 | SNV | Missense_Mutation | rs144586382 | c.635C>T | p.Ser212Leu | p.S212L | Q2M3R5 | protein_coding | tolerated(0.4) | benign(0) | TCGA-GM-A3NY-01 | Breast | breast invasive carcinoma | Female | >=65 | I/II | Hormone Therapy | arimidex | SD |
| SLC35G1 | SNV | Missense_Mutation | rs781104049 | c.311G>A | p.Arg104Gln | p.R104Q | Q2M3R5 | protein_coding | deleterious(0) | probably_damaging(0.975) | TCGA-WS-AB45-01 | Colorectum | colon adenocarcinoma | Female | <65 | I/II | Unknown | Unknown | SD |
| SLC35G1 | SNV | Missense_Mutation | novel | c.629A>G | p.Asp210Gly | p.D210G | Q2M3R5 | protein_coding | tolerated(0.27) | benign(0.003) | TCGA-F5-6814-01 | Colorectum | rectum adenocarcinoma | Male | <65 | I/II | Unknown | Unknown | SD |
| SLC35G1 | insertion | Frame_Shift_Ins | novel | c.624_625insAAGCATAG | p.Ser209LysfsTer34 | p.S209Kfs*34 | Q2M3R5 | protein_coding | TCGA-AM-5820-01 | Colorectum | colon adenocarcinoma | Female | <65 | I/II | Unknown | Unknown | SD | ||
| SLC35G1 | SNV | Missense_Mutation | novel | c.916N>T | p.Leu306Phe | p.L306F | Q2M3R5 | protein_coding | tolerated(0.09) | possibly_damaging(0.513) | TCGA-A5-A0G2-01 | Endometrium | uterine corpus endometrioid carcinoma | Female | <65 | III/IV | Unknown | Unknown | SD |
| SLC35G1 | SNV | Missense_Mutation | c.673N>G | p.Thr225Ala | p.T225A | Q2M3R5 | protein_coding | tolerated(0.37) | benign(0.023) | TCGA-AP-A054-01 | Endometrium | uterine corpus endometrioid carcinoma | Female | <65 | III/IV | Chemotherapy | carboplatin | PD | |
| SLC35G1 | SNV | Missense_Mutation | rs770140554 | c.710C>T | p.Ser237Leu | p.S237L | Q2M3R5 | protein_coding | tolerated(0.83) | benign(0) | TCGA-AP-A056-01 | Endometrium | uterine corpus endometrioid carcinoma | Female | <65 | I/II | Unknown | Unknown | SD |
| SLC35G1 | SNV | Missense_Mutation | c.743N>A | p.Ser248Tyr | p.S248Y | Q2M3R5 | protein_coding | deleterious(0.01) | probably_damaging(0.984) | TCGA-AP-A059-01 | Endometrium | uterine corpus endometrioid carcinoma | Female | >=65 | I/II | Unknown | Unknown | SD | |
| SLC35G1 | SNV | Missense_Mutation | rs752900485 | c.389N>A | p.Arg130Gln | p.R130Q | Q2M3R5 | protein_coding | deleterious(0) | possibly_damaging(0.844) | TCGA-AX-A1CE-01 | Endometrium | uterine corpus endometrioid carcinoma | Female | <65 | I/II | Unspecific | Paclitaxel | SD |
| Page: 1 2 3 |
Top |
Related drugs of malignant transformation related genes |
| Identification of chemicals and drugs interact with genes involved in malignant transfromation |
| (DGIdb 4.0) |
| Entrez ID | Symbol | Category | Interaction Types | Drug Claim Name | Drug Name | PMIDs |
| Page: 1 |

Copyright 2023-Present -The University of Texas Health Science Center at Houston |