
|
|||||
|
 | |
| |
| |
| |
| |
| |
|
Gene: SLC35F6 |
Gene summary for SLC35F6 |
| Gene information | Species | Human | Gene symbol | SLC35F6 | Gene ID | 54978 |
| Gene name | solute carrier family 35 member F6 | |
| Gene Alias | ANT2BP | |
| Cytomap | 2p23.3 | |
| Gene Type | protein-coding | GO ID | GO:0006810 | UniProtAcc | Q8N357 |
Top |
Malignant transformation analysis |
| Identification of the aberrant gene expression in precancerous and cancerous lesions by comparing the gene expression of stem-like cells in diseased tissues with normal stem cells |
| Entrez ID | Symbol | Replicates | Species | Organ | Tissue | Adj P-value | Log2FC | Malignancy |
| 54978 | SLC35F6 | LZE4T | Human | Esophagus | ESCC | 8.74e-05 | 1.49e-01 | 0.0811 |
| 54978 | SLC35F6 | LZE8T | Human | Esophagus | ESCC | 1.38e-02 | 1.09e-01 | 0.067 |
| 54978 | SLC35F6 | LZE20T | Human | Esophagus | ESCC | 1.29e-02 | 8.41e-02 | 0.0662 |
| 54978 | SLC35F6 | LZE22T | Human | Esophagus | ESCC | 8.40e-06 | 3.39e-01 | 0.068 |
| 54978 | SLC35F6 | LZE24T | Human | Esophagus | ESCC | 1.17e-07 | 1.95e-01 | 0.0596 |
| 54978 | SLC35F6 | P2T-E | Human | Esophagus | ESCC | 1.53e-16 | 3.15e-01 | 0.1177 |
| 54978 | SLC35F6 | P4T-E | Human | Esophagus | ESCC | 3.73e-12 | 2.49e-01 | 0.1323 |
| 54978 | SLC35F6 | P5T-E | Human | Esophagus | ESCC | 1.09e-14 | 2.43e-01 | 0.1327 |
| 54978 | SLC35F6 | P8T-E | Human | Esophagus | ESCC | 1.19e-10 | 2.04e-01 | 0.0889 |
| 54978 | SLC35F6 | P9T-E | Human | Esophagus | ESCC | 2.81e-07 | 1.98e-01 | 0.1131 |
| 54978 | SLC35F6 | P10T-E | Human | Esophagus | ESCC | 7.21e-13 | 1.33e-01 | 0.116 |
| 54978 | SLC35F6 | P11T-E | Human | Esophagus | ESCC | 5.45e-09 | 3.78e-01 | 0.1426 |
| 54978 | SLC35F6 | P12T-E | Human | Esophagus | ESCC | 2.35e-11 | 1.68e-01 | 0.1122 |
| 54978 | SLC35F6 | P15T-E | Human | Esophagus | ESCC | 3.00e-13 | 2.71e-01 | 0.1149 |
| 54978 | SLC35F6 | P16T-E | Human | Esophagus | ESCC | 4.89e-05 | 1.34e-01 | 0.1153 |
| 54978 | SLC35F6 | P17T-E | Human | Esophagus | ESCC | 4.89e-08 | 2.61e-01 | 0.1278 |
| 54978 | SLC35F6 | P19T-E | Human | Esophagus | ESCC | 8.50e-04 | 4.39e-01 | 0.1662 |
| 54978 | SLC35F6 | P20T-E | Human | Esophagus | ESCC | 3.95e-11 | 2.44e-01 | 0.1124 |
| 54978 | SLC35F6 | P21T-E | Human | Esophagus | ESCC | 2.38e-22 | 4.93e-01 | 0.1617 |
| 54978 | SLC35F6 | P22T-E | Human | Esophagus | ESCC | 6.18e-27 | 4.51e-01 | 0.1236 |
| Page: 1 2 3 4 5 6 |
| Tissue | Expression Dynamics | Abbreviation |
| Esophagus | 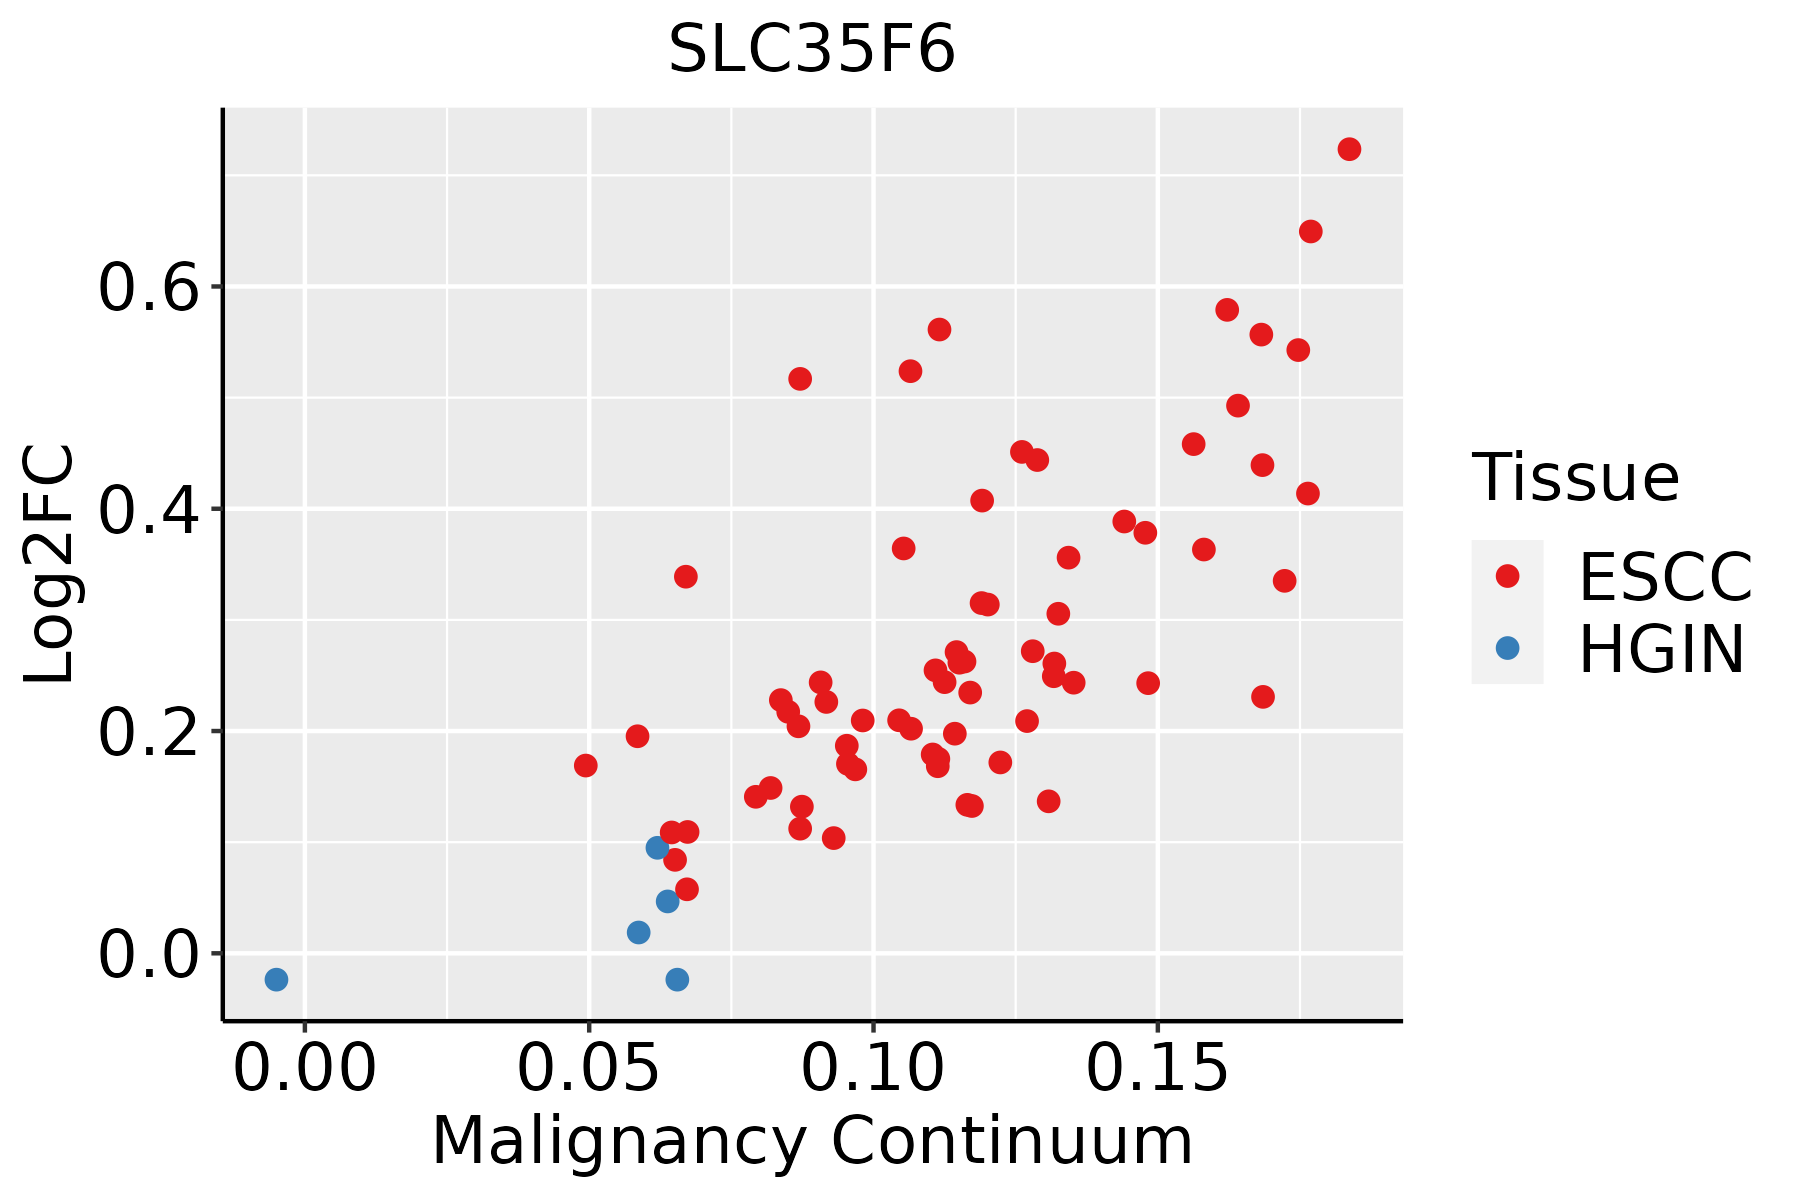 | ESCC: Esophageal squamous cell carcinoma |
| HGIN: High-grade intraepithelial neoplasias | ||
| LGIN: Low-grade intraepithelial neoplasias | ||
| Liver |  | HCC: Hepatocellular carcinoma |
| NAFLD: Non-alcoholic fatty liver disease | ||
| Oral Cavity | 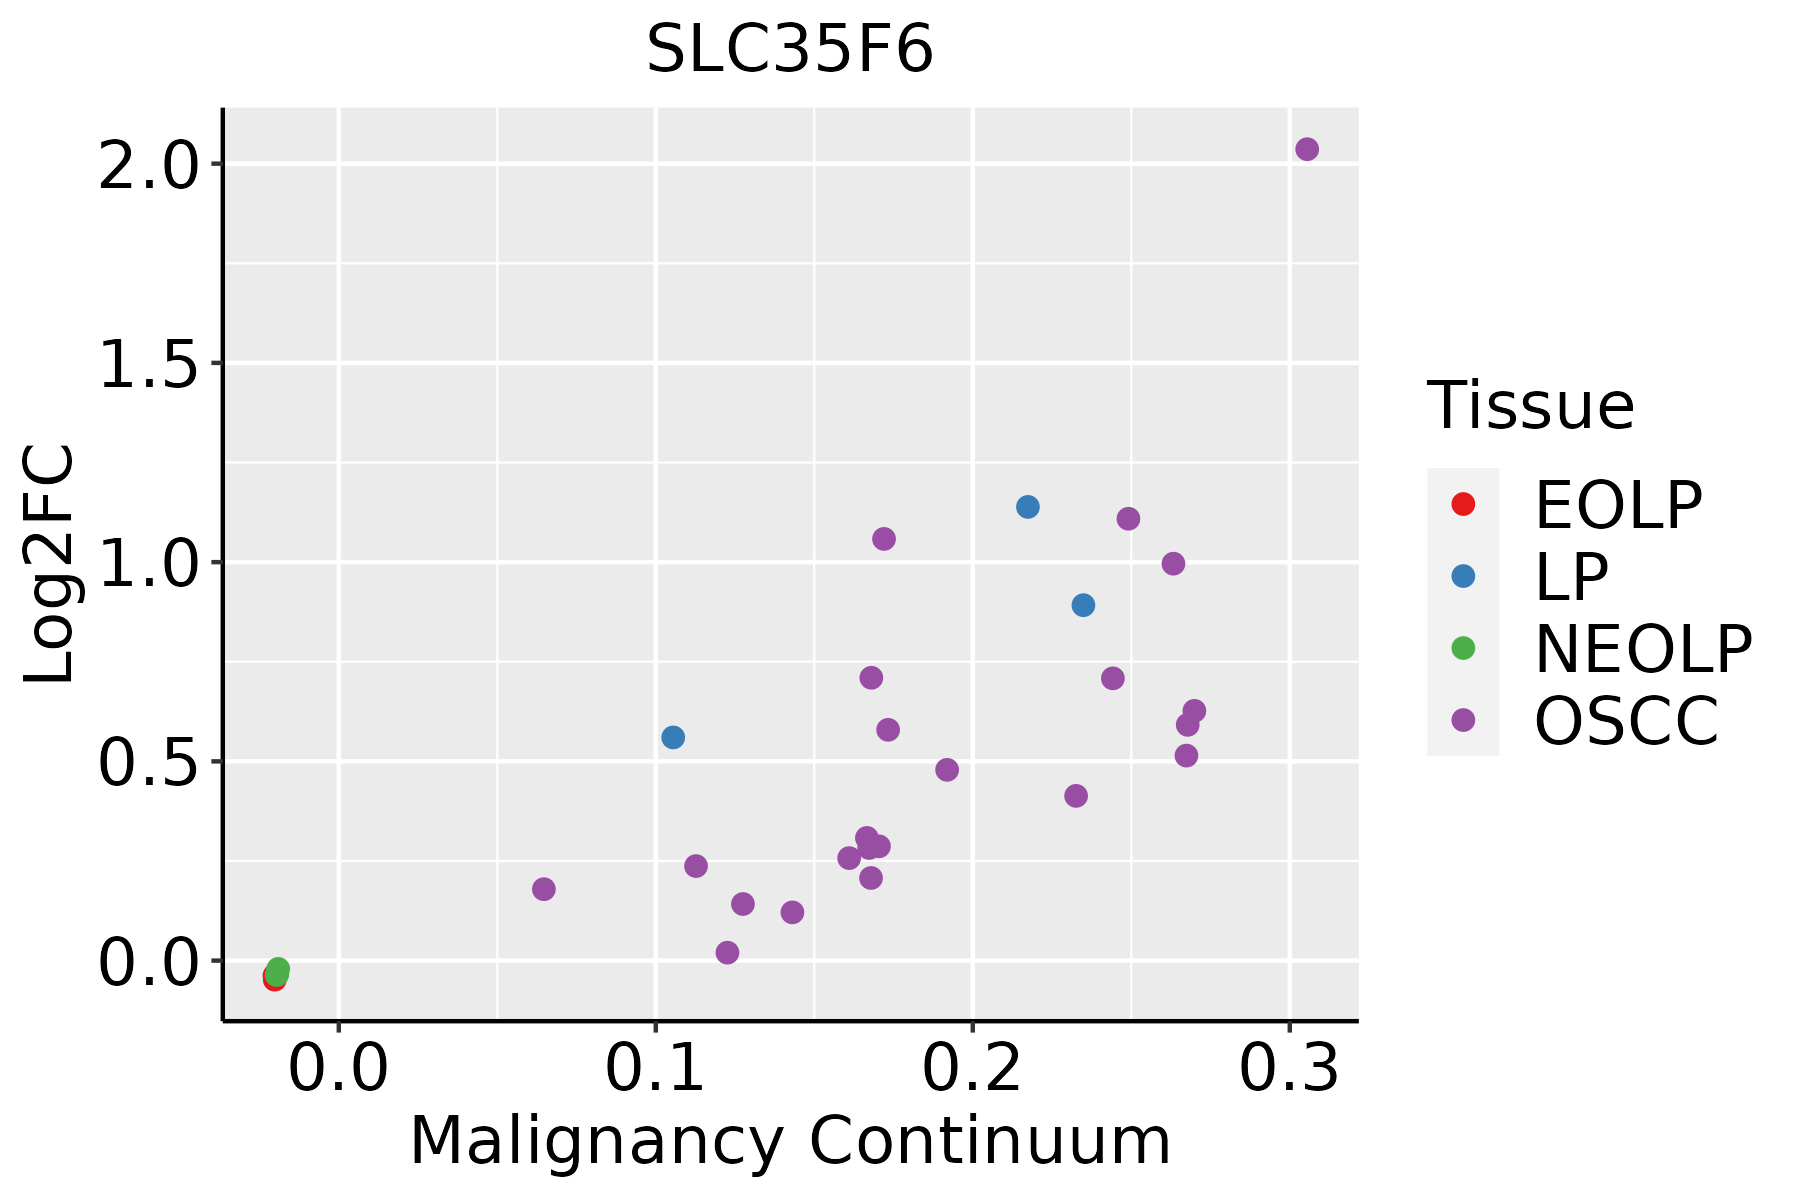 | EOLP: Erosive Oral lichen planus |
| LP: leukoplakia | ||
| NEOLP: Non-erosive oral lichen planus | ||
| OSCC: Oral squamous cell carcinoma | ||
| Skin | 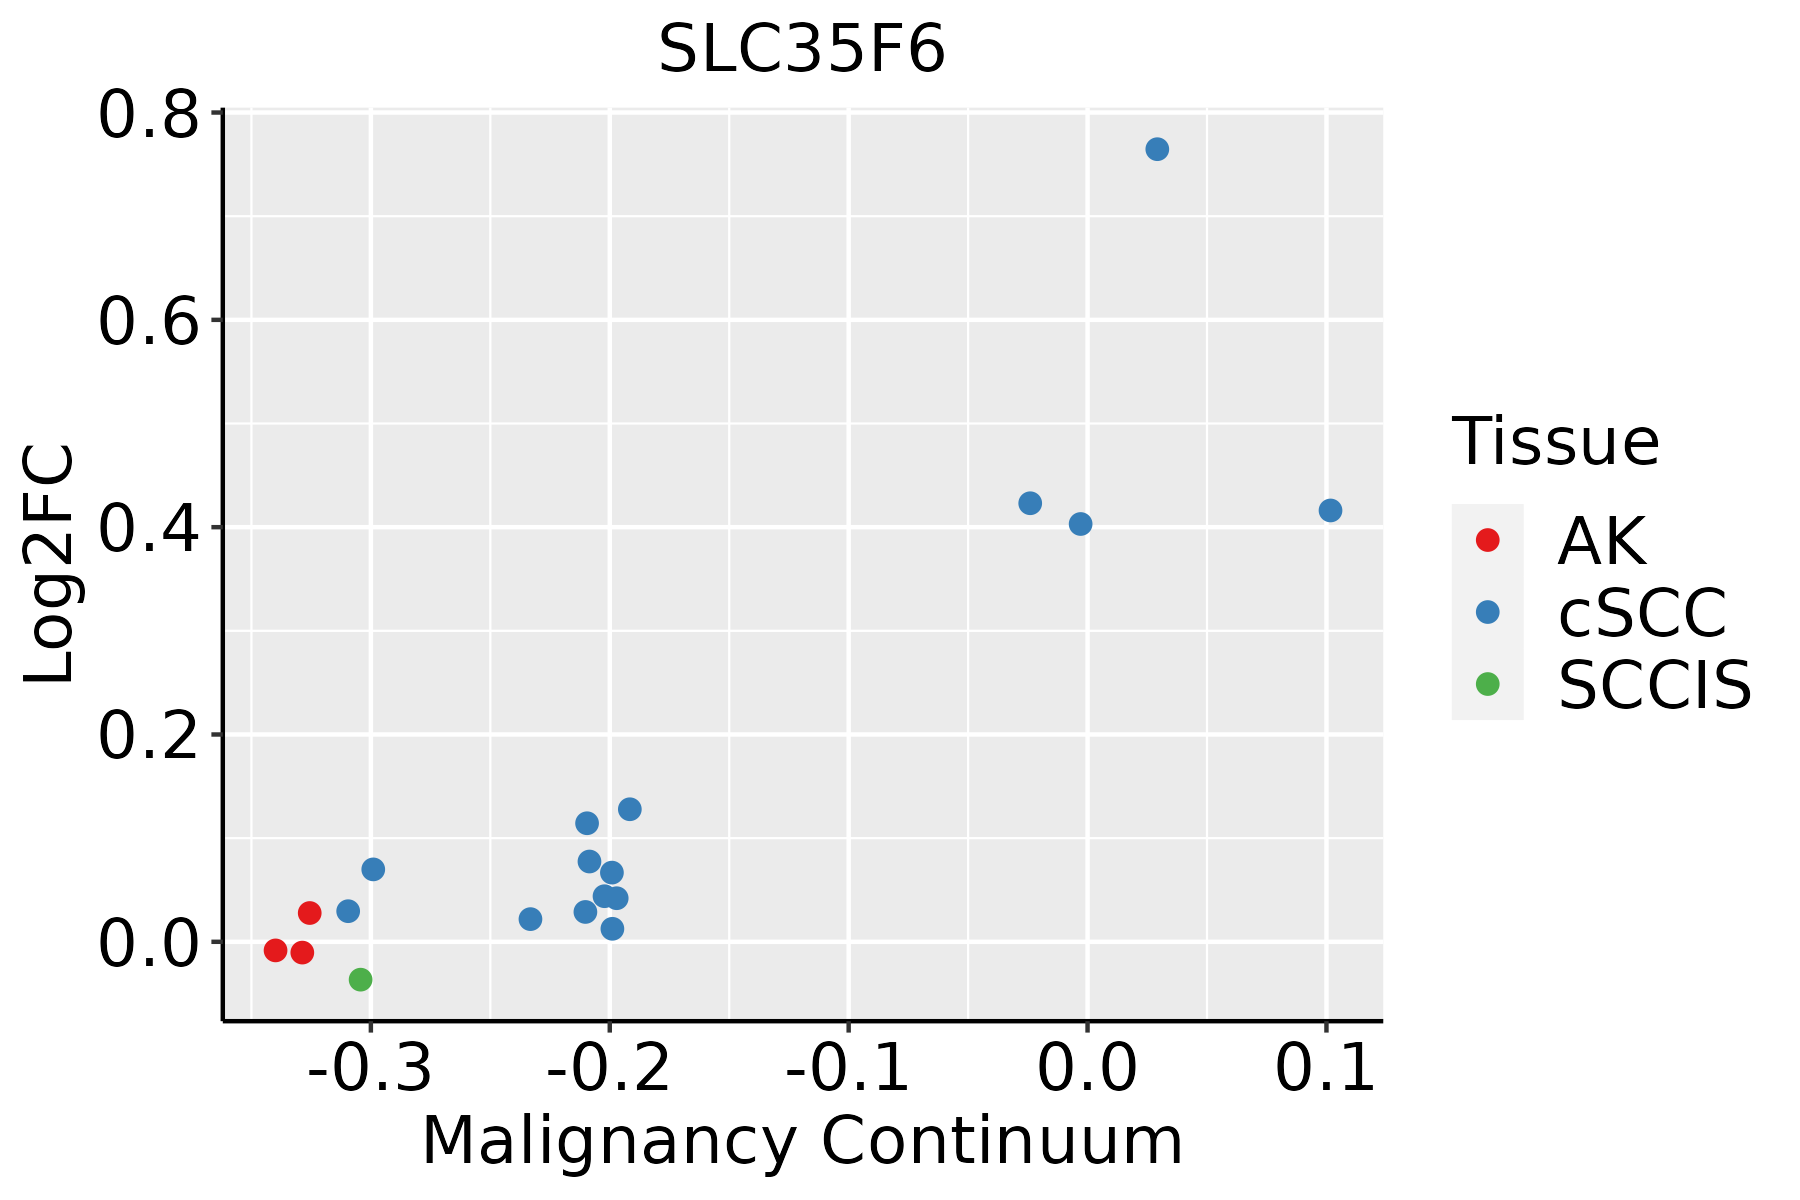 | AK: Actinic keratosis |
| cSCC: Cutaneous squamous cell carcinoma | ||
| SCCIS:squamous cell carcinoma in situ | ||
| Thyroid |  | ATC: Anaplastic thyroid cancer |
| HT: Hashimoto's thyroiditis | ||
| PTC: Papillary thyroid cancer |
| ∗log2FC in expression of this searched gene in stem-like cells from each diseased tissue sample relative to stem-like cells in normal samples in each tissue plotted against the malignancy continuum. Samples are colored based on if they are from different disease stage. |
Top |
Malignant transformation related pathway analysis |
| Find out the enriched GO biological processes and KEGG pathways involved in transition from healthy to precancer to cancer |
| Tissue | Disease Stage | Enriched GO biological Processes |
| Colorectum | AD |  |
| Colorectum | SER |  |
| Colorectum | MSS |  |
| Colorectum | MSI-H |  |
| Colorectum | FAP |  |
| ∗Top 15 enriched GO BP terms are showed in the bar plot of each disease state in each tissue. Each row represents a significant GO biological process which is colored according to the -log10(p.adjust). |
| Page: 1 2 3 4 5 6 7 8 9 |
| GO ID | Tissue | Disease Stage | Description | Gene Ratio | Bg Ratio | pvalue | p.adjust | Count |
| GO:2001233111 | Esophagus | ESCC | regulation of apoptotic signaling pathway | 256/8552 | 356/18723 | 4.11e-24 | 1.04e-21 | 256 |
| GO:0006839110 | Esophagus | ESCC | mitochondrial transport | 187/8552 | 254/18723 | 8.35e-20 | 9.81e-18 | 187 |
| GO:2001234111 | Esophagus | ESCC | negative regulation of apoptotic signaling pathway | 161/8552 | 224/18723 | 1.24e-15 | 8.09e-14 | 161 |
| GO:000700619 | Esophagus | ESCC | mitochondrial membrane organization | 93/8552 | 116/18723 | 2.16e-14 | 1.11e-12 | 93 |
| GO:0010821110 | Esophagus | ESCC | regulation of mitochondrion organization | 107/8552 | 144/18723 | 2.31e-12 | 9.41e-11 | 107 |
| GO:0008637110 | Esophagus | ESCC | apoptotic mitochondrial changes | 83/8552 | 107/18723 | 1.43e-11 | 5.08e-10 | 83 |
| GO:0010639110 | Esophagus | ESCC | negative regulation of organelle organization | 215/8552 | 348/18723 | 8.20e-10 | 2.01e-08 | 215 |
| GO:004690217 | Esophagus | ESCC | regulation of mitochondrial membrane permeability | 49/8552 | 63/18723 | 1.91e-07 | 2.97e-06 | 49 |
| GO:00905599 | Esophagus | ESCC | regulation of membrane permeability | 58/8552 | 78/18723 | 2.38e-07 | 3.61e-06 | 58 |
| GO:00357948 | Esophagus | ESCC | positive regulation of mitochondrial membrane permeability | 36/8552 | 43/18723 | 2.90e-07 | 4.20e-06 | 36 |
| GO:009734510 | Esophagus | ESCC | mitochondrial outer membrane permeabilization | 28/8552 | 32/18723 | 1.02e-06 | 1.29e-05 | 28 |
| GO:190268614 | Esophagus | ESCC | mitochondrial outer membrane permeabilization involved in programmed cell death | 33/8552 | 40/18723 | 1.80e-06 | 2.11e-05 | 33 |
| GO:19021108 | Esophagus | ESCC | positive regulation of mitochondrial membrane permeability involved in apoptotic process | 31/8552 | 38/18723 | 5.93e-06 | 6.10e-05 | 31 |
| GO:19057108 | Esophagus | ESCC | positive regulation of membrane permeability | 37/8552 | 48/18723 | 8.99e-06 | 8.65e-05 | 37 |
| GO:19010289 | Esophagus | ESCC | regulation of mitochondrial outer membrane permeabilization involved in apoptotic signaling pathway | 19/8552 | 21/18723 | 2.28e-05 | 1.96e-04 | 19 |
| GO:19021086 | Esophagus | ESCC | regulation of mitochondrial membrane permeability involved in apoptotic process | 34/8552 | 45/18723 | 4.37e-05 | 3.49e-04 | 34 |
| GO:001082315 | Esophagus | ESCC | negative regulation of mitochondrion organization | 36/8552 | 49/18723 | 7.24e-05 | 5.45e-04 | 36 |
| GO:200123312 | Liver | Cirrhotic | regulation of apoptotic signaling pathway | 163/4634 | 356/18723 | 2.62e-18 | 4.43e-16 | 163 |
| GO:20012347 | Liver | Cirrhotic | negative regulation of apoptotic signaling pathway | 102/4634 | 224/18723 | 8.40e-12 | 5.60e-10 | 102 |
| GO:00068397 | Liver | Cirrhotic | mitochondrial transport | 112/4634 | 254/18723 | 1.03e-11 | 6.66e-10 | 112 |
| Page: 1 2 3 4 5 6 7 |
| Pathway ID | Tissue | Disease Stage | Description | Gene Ratio | Bg Ratio | pvalue | p.adjust | qvalue | Count |
| Page: 1 |
Top |
Cell-cell communication analysis |
| Identification of potential cell-cell interactions between two cell types and their ligand-receptor pairs for different disease states |
| Ligand | Receptor | LRpair | Pathway | Tissue | Disease Stage |
| Page: 1 |
Top |
Single-cell gene regulatory network inference analysis |
| Find out the significant the regulons (TFs) and the target genes of each regulon across cell types for different disease states |
| TF | Cell Type | Tissue | Disease Stage | Target Gene | RSS | Regulon Activity |
| ∗The dot plots of a searched regulon are shown for all cell subpopulations in each disease state of each tissue based on the regulon specific score inferred using pySCENIC and by calculating the average expression. |
| Page: 1 |
Top |
Somatic mutation of malignant transformation related genes |
| Annotation of somatic variants for genes involved in malignant transformation |
| Hugo Symbol | Variant Class | Variant Classification | dbSNP RS | HGVSc | HGVSp | HGVSp Short | SWISSPROT | BIOTYPE | SIFT | PolyPhen | Tumor Sample Barcode | Tissue | Histology | Sex | Age | Stage | Therapy Types | Drugs | Outcome |
| SLC35F6 | insertion | Frame_Shift_Ins | novel | c.336_337insCACCTCAGCCTCCCAA | p.Ser113HisfsTer55 | p.S113Hfs*55 | Q8N357 | protein_coding | TCGA-A2-A0T2-01 | Breast | breast invasive carcinoma | Female | >=65 | III/IV | Chemotherapy | xeloda | PD | ||
| SLC35F6 | SNV | Missense_Mutation | rs764960262 | c.412C>T | p.Arg138Trp | p.R138W | Q8N357 | protein_coding | deleterious(0) | probably_damaging(0.996) | TCGA-AA-3667-01 | Colorectum | colon adenocarcinoma | Female | <65 | I/II | Unknown | Unknown | SD |
| SLC35F6 | SNV | Missense_Mutation | rs762124888 | c.895C>T | p.Arg299Cys | p.R299C | Q8N357 | protein_coding | deleterious(0) | probably_damaging(1) | TCGA-AD-5900-01 | Colorectum | colon adenocarcinoma | Male | >=65 | I/II | Unknown | Unknown | SD |
| SLC35F6 | SNV | Missense_Mutation | novel | c.638G>A | p.Gly213Asp | p.G213D | Q8N357 | protein_coding | deleterious(0) | probably_damaging(0.959) | TCGA-AY-4070-01 | Colorectum | colon adenocarcinoma | Female | <65 | III/IV | Chemotherapy | 5-fu | PD |
| SLC35F6 | SNV | Missense_Mutation | rs760556570 | c.284N>T | p.Ala95Val | p.A95V | Q8N357 | protein_coding | deleterious(0) | probably_damaging(0.966) | TCGA-DC-4745-01 | Colorectum | rectum adenocarcinoma | Female | <65 | III/IV | Chemotherapy | 5-fluorouracil | SD |
| SLC35F6 | SNV | Missense_Mutation | novel | c.308N>A | p.Ser103Asn | p.S103N | Q8N357 | protein_coding | deleterious(0) | probably_damaging(0.987) | TCGA-A5-A0G2-01 | Endometrium | uterine corpus endometrioid carcinoma | Female | <65 | III/IV | Unknown | Unknown | SD |
| SLC35F6 | SNV | Missense_Mutation | rs201991218 | c.568G>A | p.Val190Ile | p.V190I | Q8N357 | protein_coding | tolerated(0.18) | benign(0.006) | TCGA-A5-A1OF-01 | Endometrium | uterine corpus endometrioid carcinoma | Female | <65 | I/II | Unknown | Unknown | SD |
| SLC35F6 | SNV | Missense_Mutation | novel | c.506N>T | p.Ser169Ile | p.S169I | Q8N357 | protein_coding | tolerated(0.06) | benign(0.069) | TCGA-AJ-A3BH-01 | Endometrium | uterine corpus endometrioid carcinoma | Female | Unknown | I/II | Unknown | Unknown | SD |
| SLC35F6 | SNV | Missense_Mutation | c.9G>T | p.Trp3Cys | p.W3C | Q8N357 | protein_coding | deleterious(0) | probably_damaging(0.982) | TCGA-AP-A059-01 | Endometrium | uterine corpus endometrioid carcinoma | Female | >=65 | I/II | Unknown | Unknown | SD | |
| SLC35F6 | SNV | Missense_Mutation | novel | c.273C>A | p.Phe91Leu | p.F91L | Q8N357 | protein_coding | tolerated(0.37) | benign(0.036) | TCGA-AX-A2HC-01 | Endometrium | uterine corpus endometrioid carcinoma | Female | <65 | III/IV | Chemotherapy | paclitaxel | PD |
| Page: 1 2 3 |
Top |
Related drugs of malignant transformation related genes |
| Identification of chemicals and drugs interact with genes involved in malignant transfromation |
| (DGIdb 4.0) |
| Entrez ID | Symbol | Category | Interaction Types | Drug Claim Name | Drug Name | PMIDs |
| Page: 1 |

Copyright 2023-Present -The University of Texas Health Science Center at Houston |