
|
|||||
|
 | |
| |
| |
| |
| |
| |
|
Gene: SLC35F5 |
Gene summary for SLC35F5 |
| Gene information | Species | Human | Gene symbol | SLC35F5 | Gene ID | 80255 |
| Gene name | solute carrier family 35 member F5 | |
| Gene Alias | SLC35F5 | |
| Cytomap | 2q14.1 | |
| Gene Type | protein-coding | GO ID | GO:0005575 | UniProtAcc | B8ZZY4 |
Top |
Malignant transformation analysis |
| Identification of the aberrant gene expression in precancerous and cancerous lesions by comparing the gene expression of stem-like cells in diseased tissues with normal stem cells |
| Entrez ID | Symbol | Replicates | Species | Organ | Tissue | Adj P-value | Log2FC | Malignancy |
| 80255 | SLC35F5 | HTA11_3410_2000001011 | Human | Colorectum | AD | 1.82e-03 | -2.10e-01 | 0.0155 |
| 80255 | SLC35F5 | HTA11_347_2000001011 | Human | Colorectum | AD | 2.72e-09 | 4.68e-01 | -0.1954 |
| 80255 | SLC35F5 | HTA11_99999970781_79442 | Human | Colorectum | MSS | 7.50e-03 | 3.73e-01 | 0.294 |
| 80255 | SLC35F5 | A001-C-207 | Human | Colorectum | FAP | 9.04e-03 | -2.99e-01 | 0.1278 |
| 80255 | SLC35F5 | A015-C-203 | Human | Colorectum | FAP | 1.84e-20 | -4.23e-01 | -0.1294 |
| 80255 | SLC35F5 | A015-C-204 | Human | Colorectum | FAP | 1.05e-05 | -3.52e-01 | -0.0228 |
| 80255 | SLC35F5 | A014-C-040 | Human | Colorectum | FAP | 4.95e-02 | -3.71e-01 | -0.1184 |
| 80255 | SLC35F5 | A002-C-201 | Human | Colorectum | FAP | 4.57e-14 | -4.24e-01 | 0.0324 |
| 80255 | SLC35F5 | A001-C-119 | Human | Colorectum | FAP | 1.53e-04 | -3.74e-01 | -0.1557 |
| 80255 | SLC35F5 | A001-C-108 | Human | Colorectum | FAP | 7.69e-14 | -2.13e-01 | -0.0272 |
| 80255 | SLC35F5 | A002-C-205 | Human | Colorectum | FAP | 1.67e-16 | -4.45e-01 | -0.1236 |
| 80255 | SLC35F5 | A015-C-005 | Human | Colorectum | FAP | 9.27e-03 | -3.00e-01 | -0.0336 |
| 80255 | SLC35F5 | A015-C-006 | Human | Colorectum | FAP | 2.37e-12 | -4.74e-01 | -0.0994 |
| 80255 | SLC35F5 | A015-C-106 | Human | Colorectum | FAP | 2.82e-06 | -2.25e-01 | -0.0511 |
| 80255 | SLC35F5 | A002-C-114 | Human | Colorectum | FAP | 6.40e-14 | -4.76e-01 | -0.1561 |
| 80255 | SLC35F5 | A015-C-104 | Human | Colorectum | FAP | 7.04e-22 | -3.30e-01 | -0.1899 |
| 80255 | SLC35F5 | A001-C-014 | Human | Colorectum | FAP | 1.49e-10 | -3.44e-01 | 0.0135 |
| 80255 | SLC35F5 | A002-C-016 | Human | Colorectum | FAP | 1.40e-17 | -3.53e-01 | 0.0521 |
| 80255 | SLC35F5 | A015-C-002 | Human | Colorectum | FAP | 6.55e-10 | -4.41e-01 | -0.0763 |
| 80255 | SLC35F5 | A001-C-203 | Human | Colorectum | FAP | 1.10e-04 | -2.07e-01 | -0.0481 |
| Page: 1 2 3 4 5 6 7 |
| Tissue | Expression Dynamics | Abbreviation |
| Colorectum (GSE201348) |  | FAP: Familial adenomatous polyposis |
| CRC: Colorectal cancer | ||
| Colorectum (HTA11) |  | AD: Adenomas |
| SER: Sessile serrated lesions | ||
| MSI-H: Microsatellite-high colorectal cancer | ||
| MSS: Microsatellite stable colorectal cancer | ||
| Esophagus |  | ESCC: Esophageal squamous cell carcinoma |
| HGIN: High-grade intraepithelial neoplasias | ||
| LGIN: Low-grade intraepithelial neoplasias | ||
| Liver |  | HCC: Hepatocellular carcinoma |
| NAFLD: Non-alcoholic fatty liver disease | ||
| Oral Cavity | 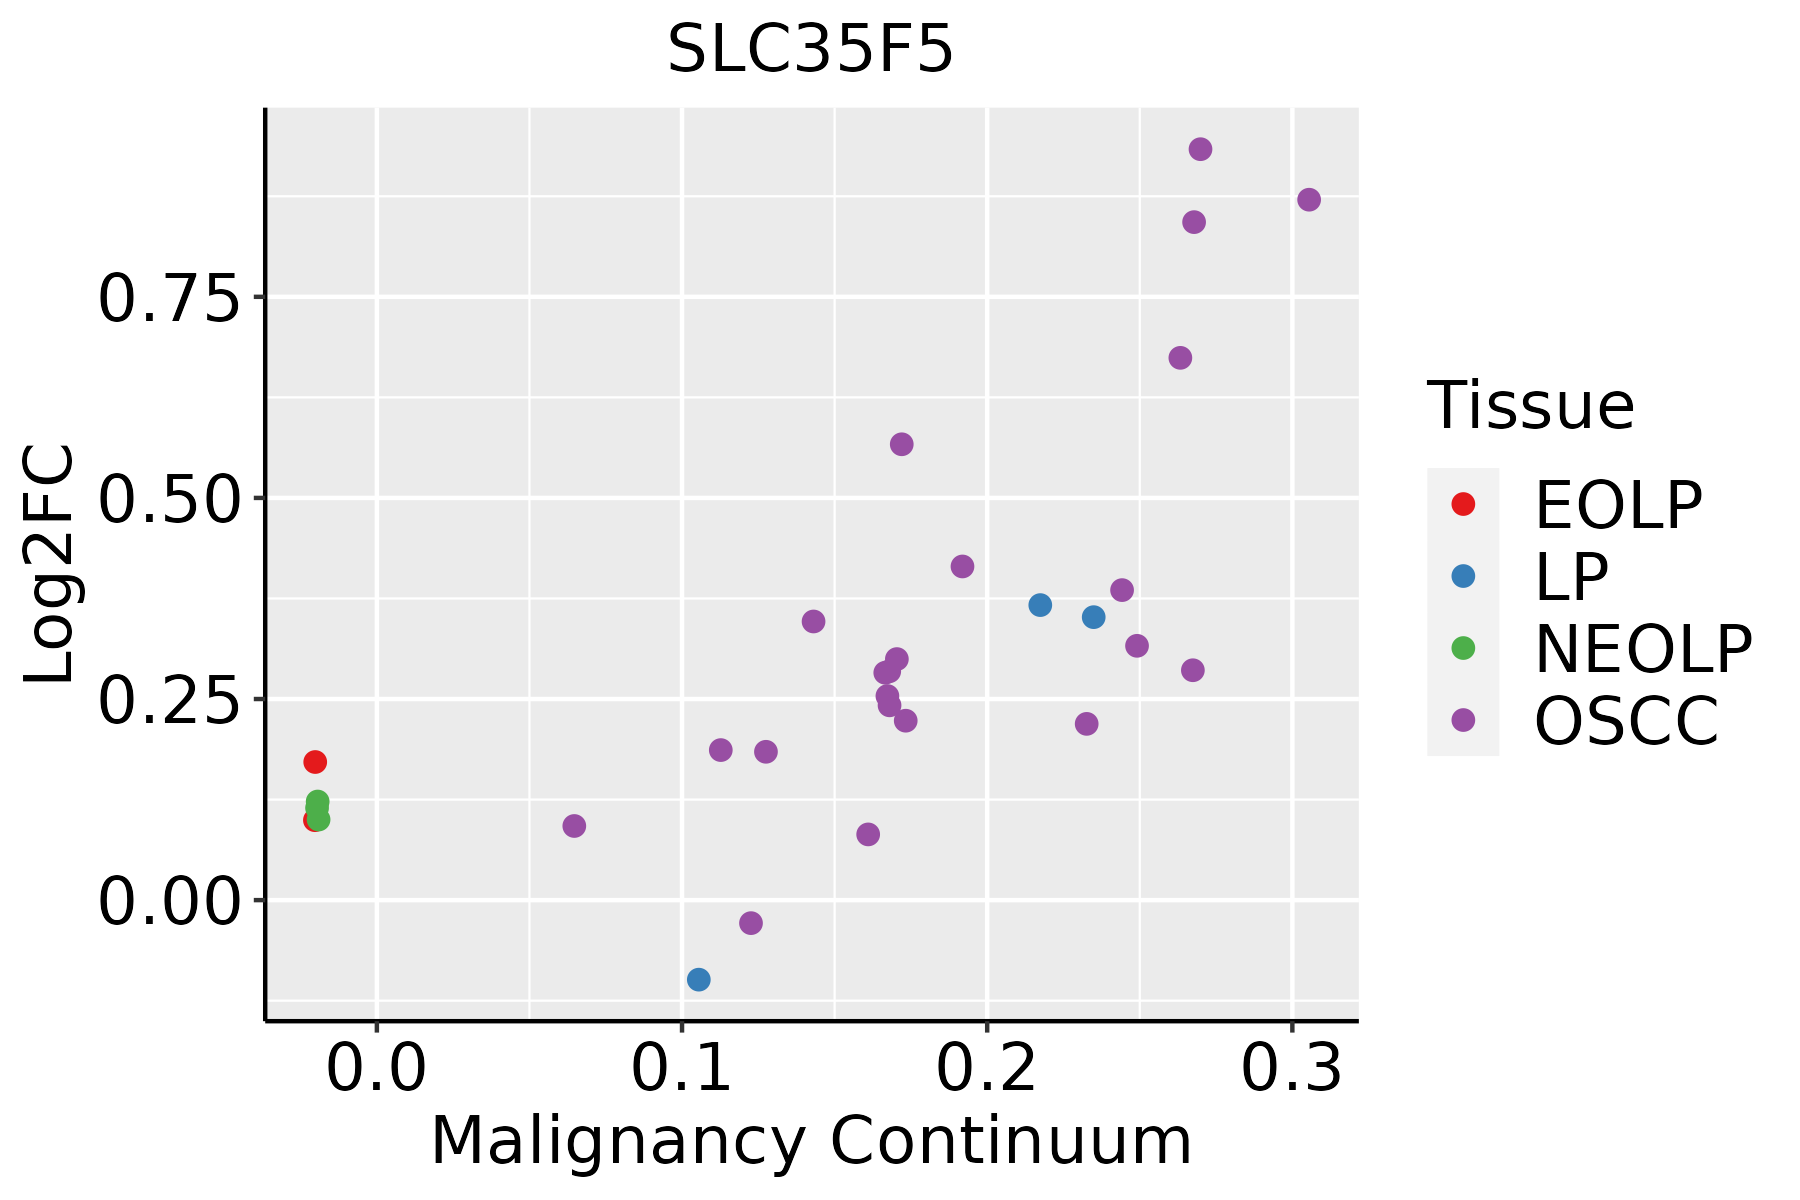 | EOLP: Erosive Oral lichen planus |
| LP: leukoplakia | ||
| NEOLP: Non-erosive oral lichen planus | ||
| OSCC: Oral squamous cell carcinoma | ||
| Skin | 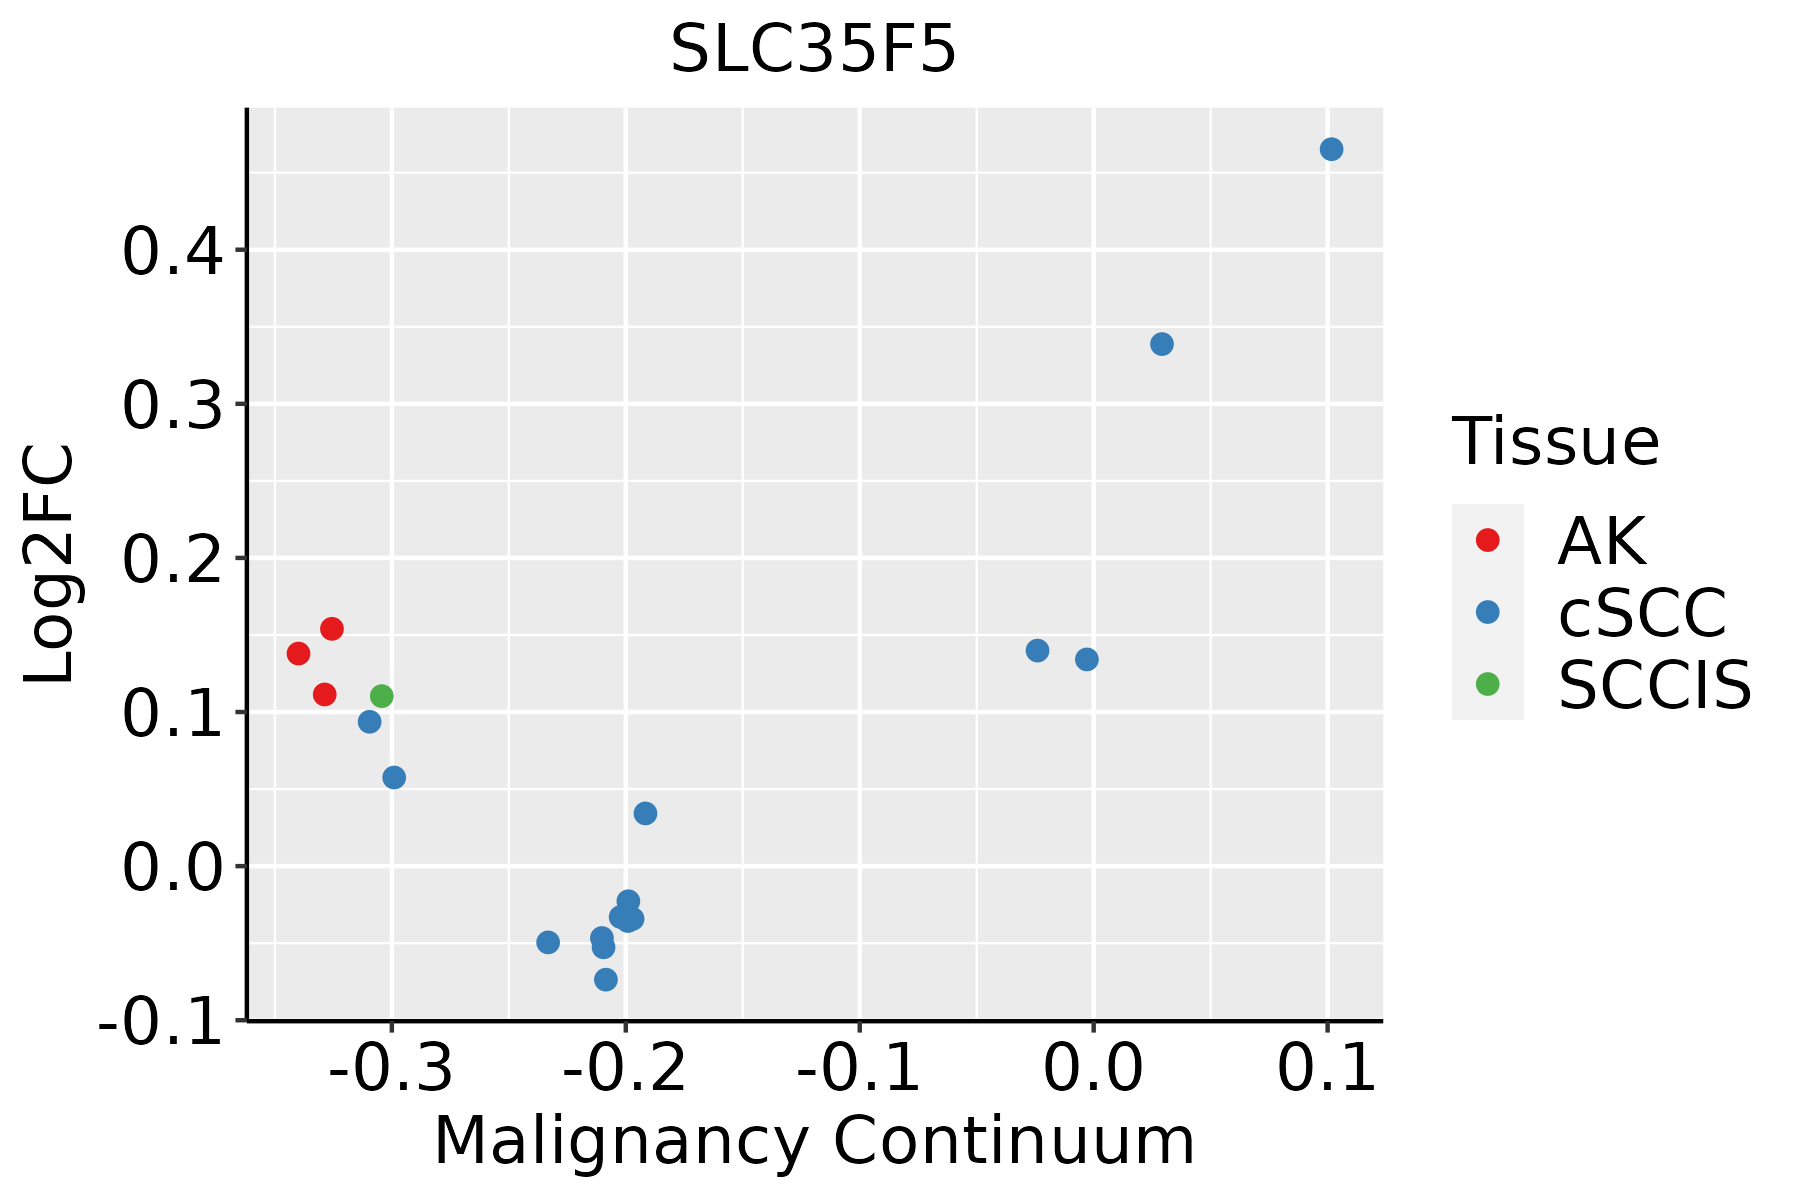 | AK: Actinic keratosis |
| cSCC: Cutaneous squamous cell carcinoma | ||
| SCCIS:squamous cell carcinoma in situ | ||
| Thyroid | 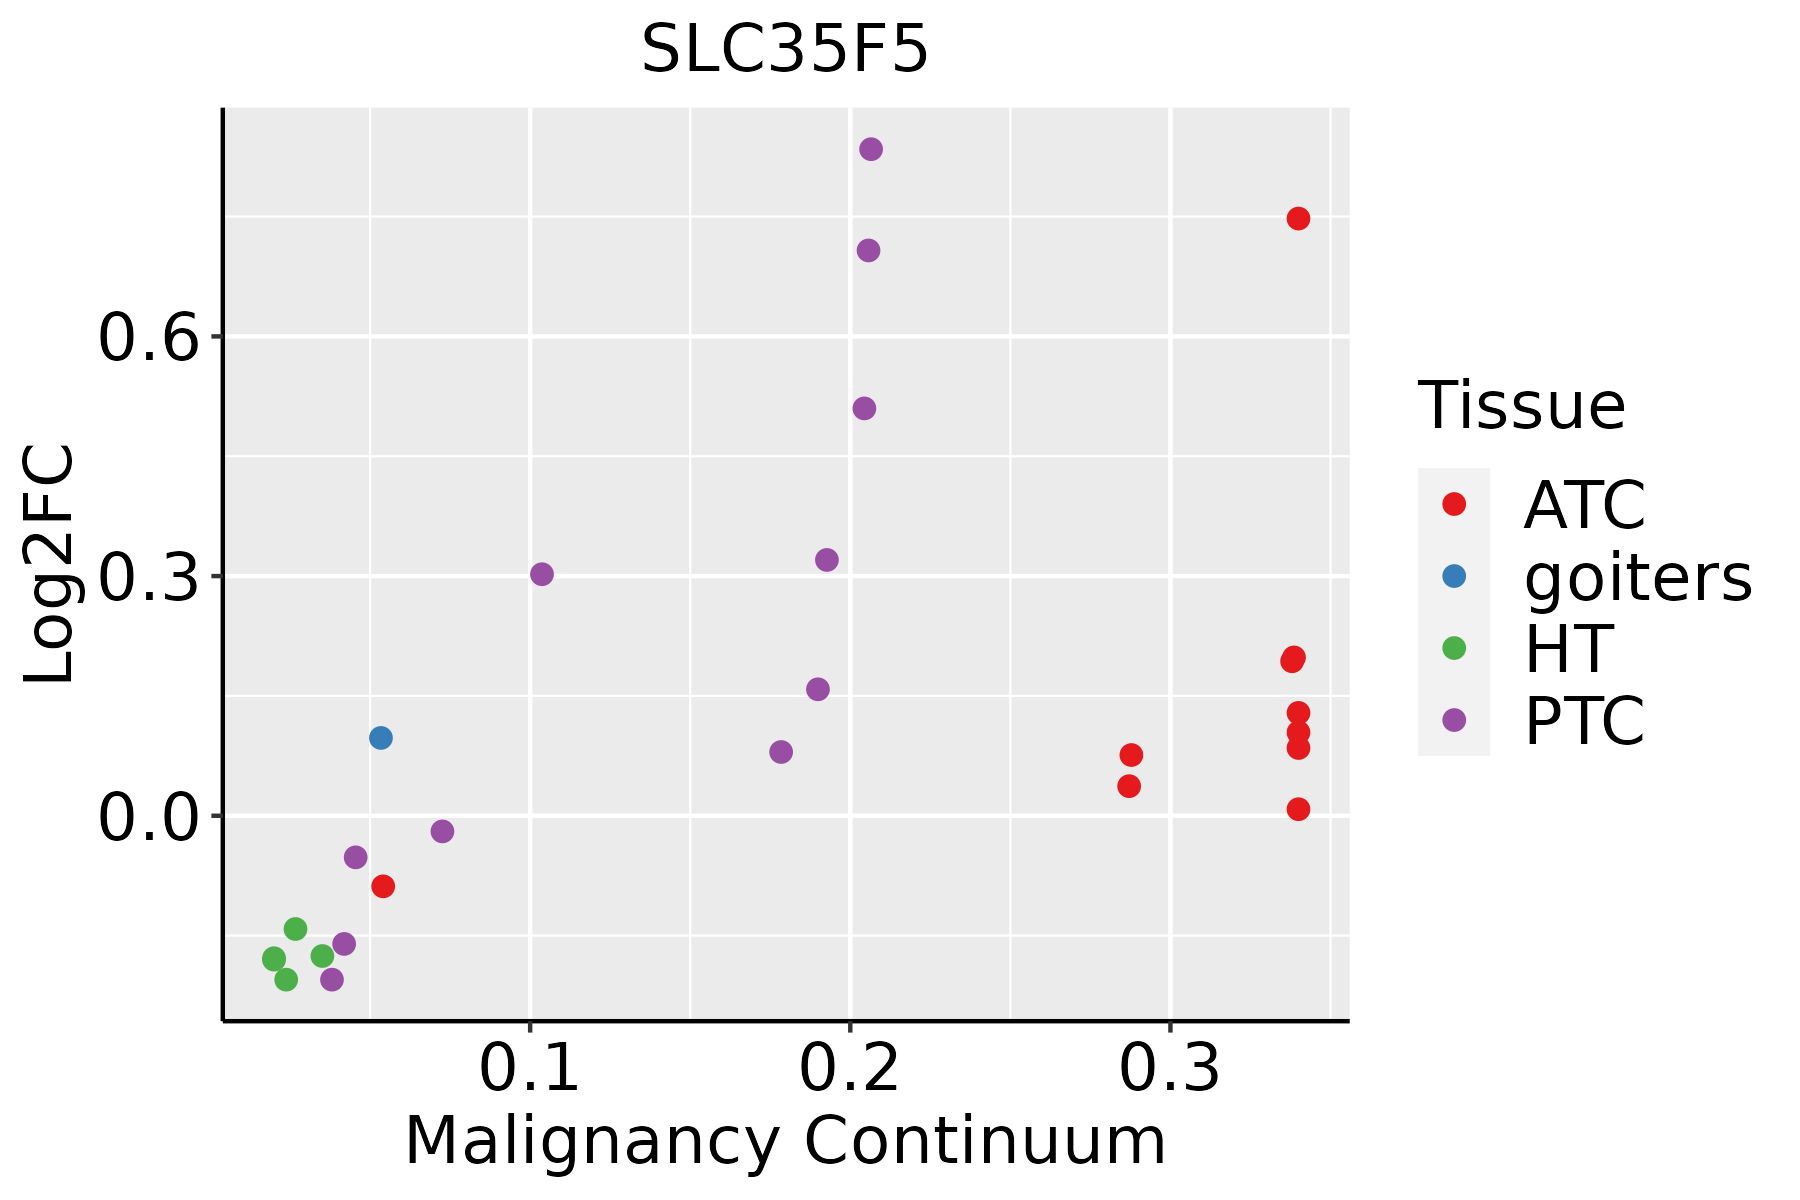 | ATC: Anaplastic thyroid cancer |
| HT: Hashimoto's thyroiditis | ||
| PTC: Papillary thyroid cancer |
| ∗log2FC in expression of this searched gene in stem-like cells from each diseased tissue sample relative to stem-like cells in normal samples in each tissue plotted against the malignancy continuum. Samples are colored based on if they are from different disease stage. |
Top |
Malignant transformation related pathway analysis |
| Find out the enriched GO biological processes and KEGG pathways involved in transition from healthy to precancer to cancer |
| Tissue | Disease Stage | Enriched GO biological Processes |
| Colorectum | AD |  |
| Colorectum | SER |  |
| Colorectum | MSS |  |
| Colorectum | MSI-H |  |
| Colorectum | FAP |  |
| ∗Top 15 enriched GO BP terms are showed in the bar plot of each disease state in each tissue. Each row represents a significant GO biological process which is colored according to the -log10(p.adjust). |
| Page: 1 2 3 4 5 6 7 8 9 |
| GO ID | Tissue | Disease Stage | Description | Gene Ratio | Bg Ratio | pvalue | p.adjust | Count |
| Page: 1 |
| Pathway ID | Tissue | Disease Stage | Description | Gene Ratio | Bg Ratio | pvalue | p.adjust | qvalue | Count |
| Page: 1 |
Top |
Cell-cell communication analysis |
| Identification of potential cell-cell interactions between two cell types and their ligand-receptor pairs for different disease states |
| Ligand | Receptor | LRpair | Pathway | Tissue | Disease Stage |
| Page: 1 |
Top |
Single-cell gene regulatory network inference analysis |
| Find out the significant the regulons (TFs) and the target genes of each regulon across cell types for different disease states |
| TF | Cell Type | Tissue | Disease Stage | Target Gene | RSS | Regulon Activity |
| ∗The dot plots of a searched regulon are shown for all cell subpopulations in each disease state of each tissue based on the regulon specific score inferred using pySCENIC and by calculating the average expression. |
| Page: 1 |
Top |
Somatic mutation of malignant transformation related genes |
| Annotation of somatic variants for genes involved in malignant transformation |
| Hugo Symbol | Variant Class | Variant Classification | dbSNP RS | HGVSc | HGVSp | HGVSp Short | SWISSPROT | BIOTYPE | SIFT | PolyPhen | Tumor Sample Barcode | Tissue | Histology | Sex | Age | Stage | Therapy Types | Drugs | Outcome |
| SLC35F5 | SNV | Missense_Mutation | c.262N>A | p.Glu88Lys | p.E88K | Q8WV83 | protein_coding | tolerated(0.11) | probably_damaging(0.971) | TCGA-B6-A0IK-01 | Breast | breast invasive carcinoma | Female | <65 | III/IV | Unknown | Unknown | PD | |
| SLC35F5 | SNV | Missense_Mutation | c.1220N>A | p.Gly407Glu | p.G407E | Q8WV83 | protein_coding | deleterious(0) | benign(0.014) | TCGA-BH-A0B3-01 | Breast | breast invasive carcinoma | Female | <65 | I/II | Chemotherapy | cyclophosphamide | SD | |
| SLC35F5 | SNV | Missense_Mutation | c.1102N>G | p.Leu368Val | p.L368V | Q8WV83 | protein_coding | tolerated(0.12) | probably_damaging(0.967) | TCGA-BH-A0B3-01 | Breast | breast invasive carcinoma | Female | <65 | I/II | Chemotherapy | cyclophosphamide | SD | |
| SLC35F5 | SNV | Missense_Mutation | c.22N>T | p.Arg8Cys | p.R8C | Q8WV83 | protein_coding | tolerated_low_confidence(0.1) | benign(0.353) | TCGA-JW-A5VL-01 | Cervix | cervical & endocervical cancer | Female | <65 | I/II | Unknown | Unknown | SD | |
| SLC35F5 | SNV | Missense_Mutation | c.251N>C | p.Val84Ala | p.V84A | Q8WV83 | protein_coding | deleterious(0.04) | probably_damaging(0.956) | TCGA-CM-6162-01 | Colorectum | colon adenocarcinoma | Female | <65 | III/IV | Chemotherapy | oxaliplatin | SD | |
| SLC35F5 | SNV | Missense_Mutation | c.143N>C | p.Val48Ala | p.V48A | Q8WV83 | protein_coding | tolerated_low_confidence(0.1) | benign(0.023) | TCGA-AG-A02N-01 | Colorectum | rectum adenocarcinoma | Male | >=65 | I/II | Chemotherapy | folinic | CR | |
| SLC35F5 | SNV | Missense_Mutation | c.482N>A | p.Ser161Asn | p.S161N | Q8WV83 | protein_coding | deleterious(0) | possibly_damaging(0.452) | TCGA-G5-6233-01 | Colorectum | rectum adenocarcinoma | Male | >=65 | III/IV | Chemotherapy | 5-fluorouracil | PD | |
| SLC35F5 | SNV | Missense_Mutation | novel | c.850C>A | p.Leu284Ile | p.L284I | Q8WV83 | protein_coding | deleterious(0.04) | probably_damaging(0.965) | TCGA-A5-A1OF-01 | Endometrium | uterine corpus endometrioid carcinoma | Female | <65 | I/II | Unknown | Unknown | SD |
| SLC35F5 | SNV | Missense_Mutation | novel | c.1189N>G | p.Leu397Val | p.L397V | Q8WV83 | protein_coding | tolerated(0.09) | benign(0.068) | TCGA-AP-A056-01 | Endometrium | uterine corpus endometrioid carcinoma | Female | <65 | I/II | Unknown | Unknown | SD |
| SLC35F5 | SNV | Missense_Mutation | c.1129G>T | p.Gly377Cys | p.G377C | Q8WV83 | protein_coding | tolerated(0.05) | probably_damaging(0.97) | TCGA-AP-A059-01 | Endometrium | uterine corpus endometrioid carcinoma | Female | >=65 | I/II | Unknown | Unknown | SD |
| Page: 1 2 3 4 |
Top |
Related drugs of malignant transformation related genes |
| Identification of chemicals and drugs interact with genes involved in malignant transfromation |
| (DGIdb 4.0) |
| Entrez ID | Symbol | Category | Interaction Types | Drug Claim Name | Drug Name | PMIDs |
| Page: 1 |

Copyright 2023-Present -The University of Texas Health Science Center at Houston |