
|
|||||
|
 | |
| |
| |
| |
| |
| |
|
Gene: SLC35E3 |
Gene summary for SLC35E3 |
| Gene information | Species | Human | Gene symbol | SLC35E3 | Gene ID | 55508 |
| Gene name | solute carrier family 35 member E3 | |
| Gene Alias | BLOV1 | |
| Cytomap | 12q15 | |
| Gene Type | protein-coding | GO ID | GO:0006810 | UniProtAcc | A0A024RB82 |
Top |
Malignant transformation analysis |
| Identification of the aberrant gene expression in precancerous and cancerous lesions by comparing the gene expression of stem-like cells in diseased tissues with normal stem cells |
| Entrez ID | Symbol | Replicates | Species | Organ | Tissue | Adj P-value | Log2FC | Malignancy |
| 55508 | SLC35E3 | LZE4T | Human | Esophagus | ESCC | 4.92e-13 | 4.33e-01 | 0.0811 |
| 55508 | SLC35E3 | LZE7T | Human | Esophagus | ESCC | 1.34e-05 | 2.76e-01 | 0.0667 |
| 55508 | SLC35E3 | LZE20T | Human | Esophagus | ESCC | 8.64e-05 | 2.47e-01 | 0.0662 |
| 55508 | SLC35E3 | LZE24T | Human | Esophagus | ESCC | 1.38e-07 | 2.41e-01 | 0.0596 |
| 55508 | SLC35E3 | P1T-E | Human | Esophagus | ESCC | 4.63e-08 | 5.75e-01 | 0.0875 |
| 55508 | SLC35E3 | P2T-E | Human | Esophagus | ESCC | 1.77e-34 | 6.69e-01 | 0.1177 |
| 55508 | SLC35E3 | P4T-E | Human | Esophagus | ESCC | 1.15e-15 | 4.07e-01 | 0.1323 |
| 55508 | SLC35E3 | P5T-E | Human | Esophagus | ESCC | 1.56e-07 | 1.69e-01 | 0.1327 |
| 55508 | SLC35E3 | P8T-E | Human | Esophagus | ESCC | 4.93e-12 | 3.18e-01 | 0.0889 |
| 55508 | SLC35E3 | P9T-E | Human | Esophagus | ESCC | 1.89e-02 | 1.51e-01 | 0.1131 |
| 55508 | SLC35E3 | P10T-E | Human | Esophagus | ESCC | 5.76e-20 | 2.72e-01 | 0.116 |
| 55508 | SLC35E3 | P11T-E | Human | Esophagus | ESCC | 1.81e-11 | 4.90e-01 | 0.1426 |
| 55508 | SLC35E3 | P12T-E | Human | Esophagus | ESCC | 1.03e-36 | 7.35e-01 | 0.1122 |
| 55508 | SLC35E3 | P15T-E | Human | Esophagus | ESCC | 1.49e-11 | 3.16e-01 | 0.1149 |
| 55508 | SLC35E3 | P16T-E | Human | Esophagus | ESCC | 2.16e-27 | 4.83e-01 | 0.1153 |
| 55508 | SLC35E3 | P19T-E | Human | Esophagus | ESCC | 2.09e-05 | 4.66e-01 | 0.1662 |
| 55508 | SLC35E3 | P20T-E | Human | Esophagus | ESCC | 8.92e-10 | 2.43e-01 | 0.1124 |
| 55508 | SLC35E3 | P21T-E | Human | Esophagus | ESCC | 1.86e-28 | 5.74e-01 | 0.1617 |
| 55508 | SLC35E3 | P22T-E | Human | Esophagus | ESCC | 4.22e-13 | 2.74e-01 | 0.1236 |
| 55508 | SLC35E3 | P23T-E | Human | Esophagus | ESCC | 8.11e-12 | 3.31e-01 | 0.108 |
| Page: 1 2 3 4 5 |
| Tissue | Expression Dynamics | Abbreviation |
| Esophagus | 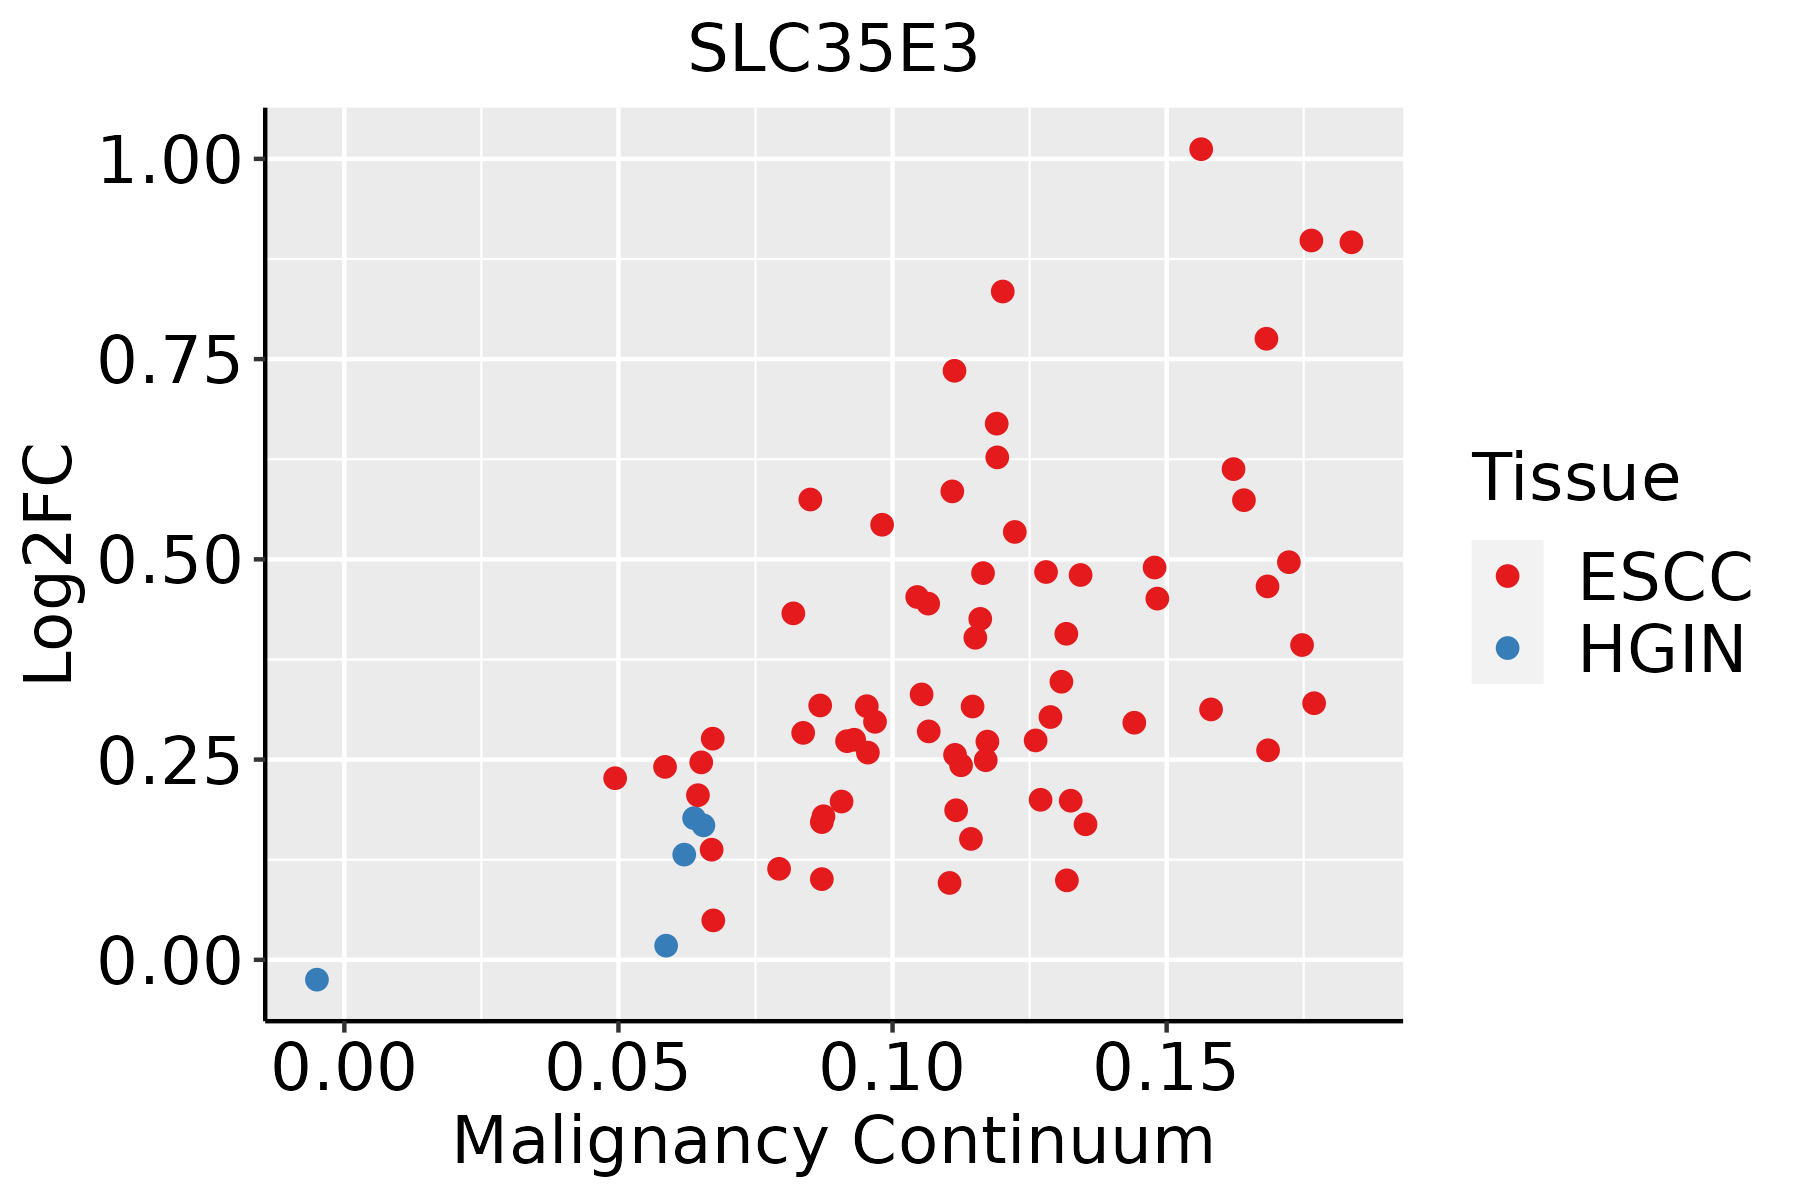 | ESCC: Esophageal squamous cell carcinoma |
| HGIN: High-grade intraepithelial neoplasias | ||
| LGIN: Low-grade intraepithelial neoplasias | ||
| Liver |  | HCC: Hepatocellular carcinoma |
| NAFLD: Non-alcoholic fatty liver disease | ||
| Oral Cavity | 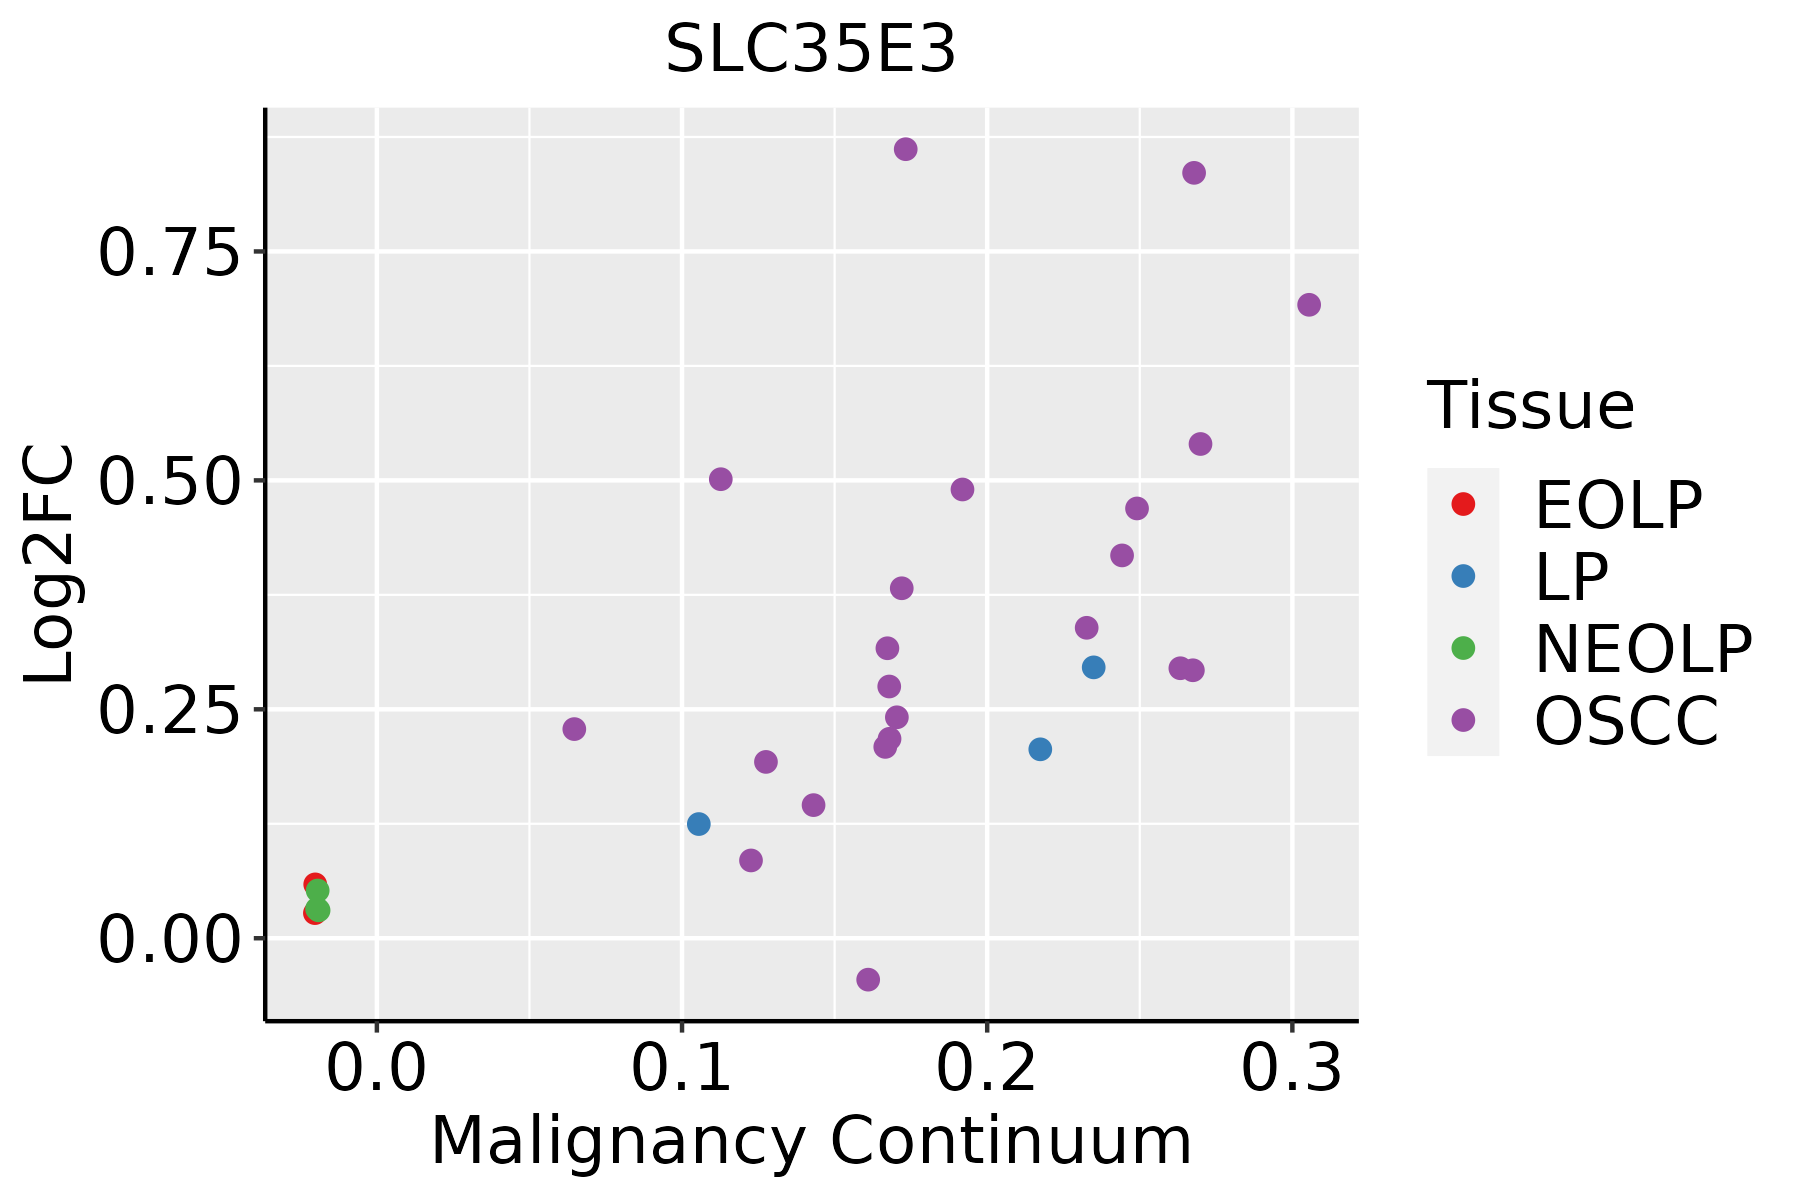 | EOLP: Erosive Oral lichen planus |
| LP: leukoplakia | ||
| NEOLP: Non-erosive oral lichen planus | ||
| OSCC: Oral squamous cell carcinoma | ||
| Thyroid | 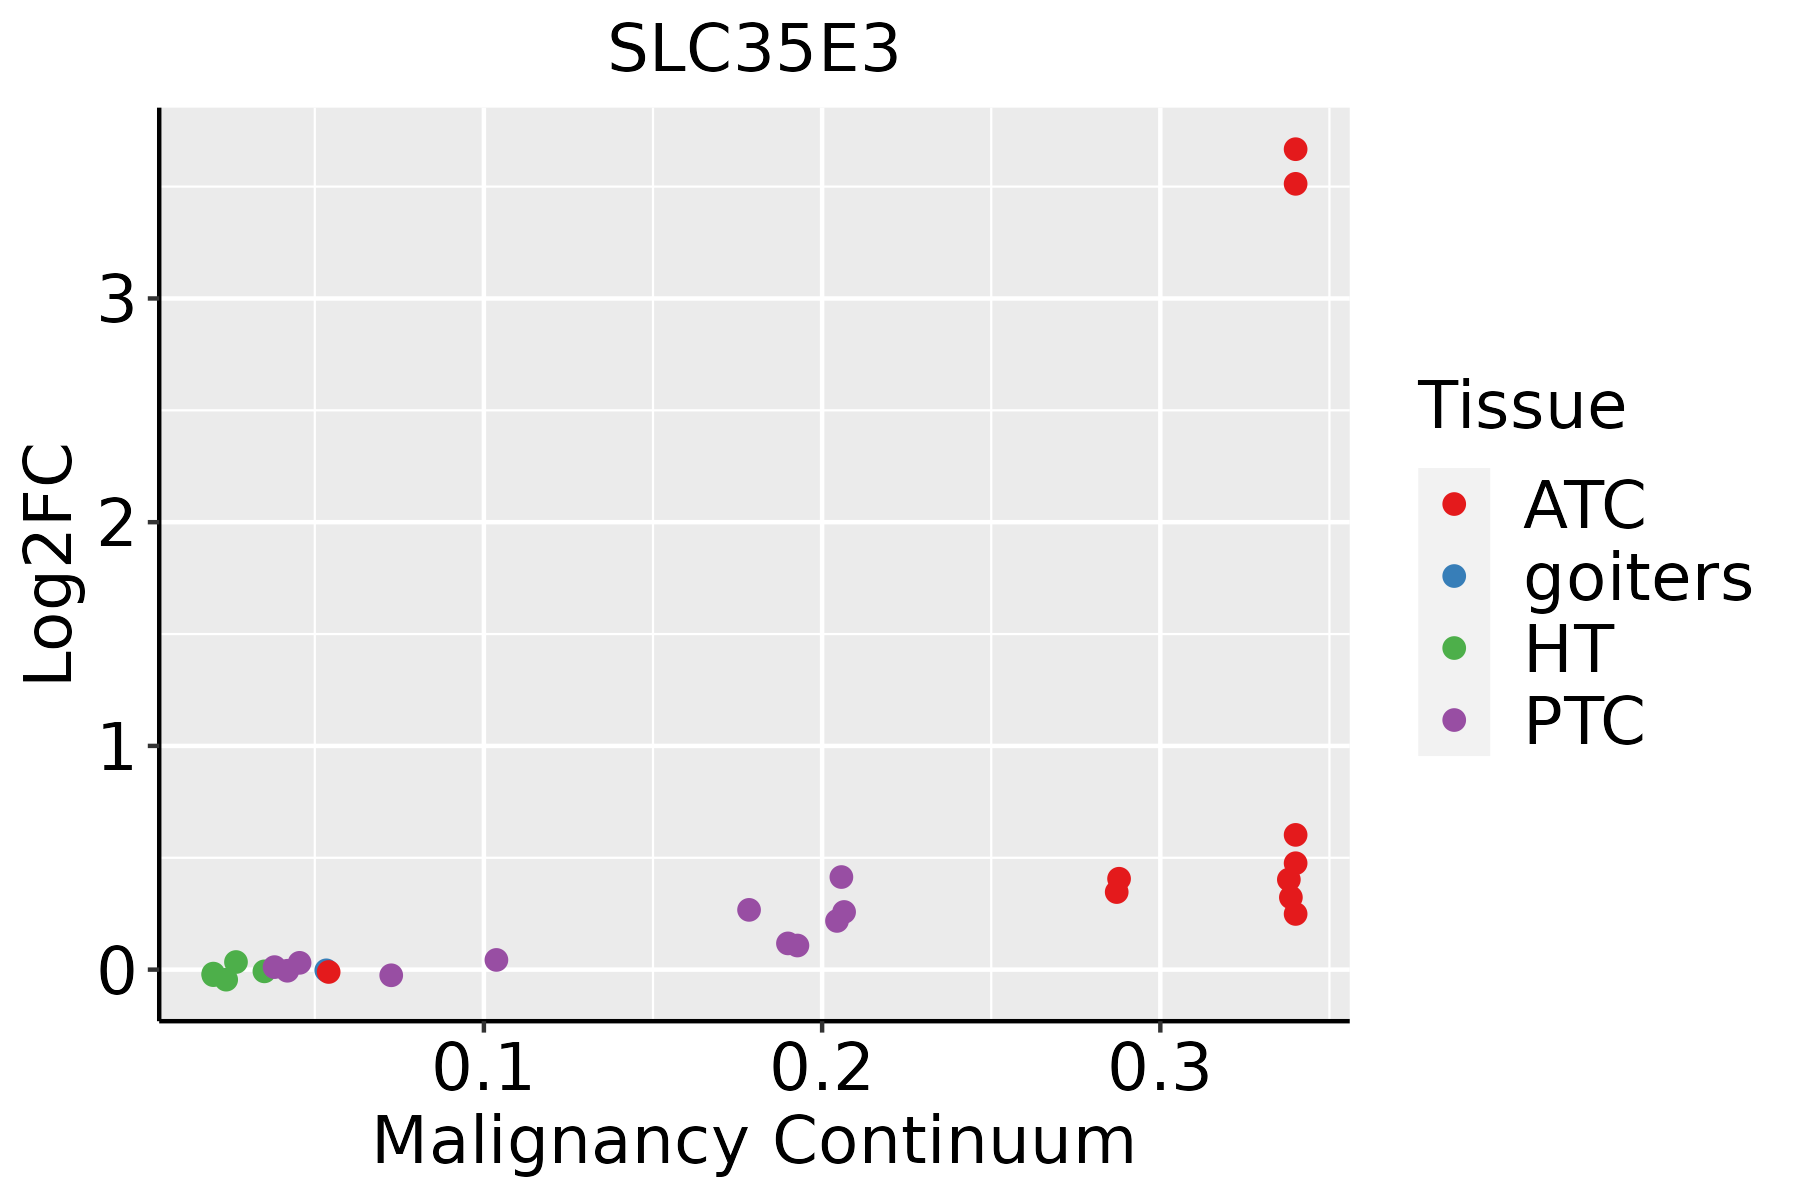 | ATC: Anaplastic thyroid cancer |
| HT: Hashimoto's thyroiditis | ||
| PTC: Papillary thyroid cancer |
| ∗log2FC in expression of this searched gene in stem-like cells from each diseased tissue sample relative to stem-like cells in normal samples in each tissue plotted against the malignancy continuum. Samples are colored based on if they are from different disease stage. |
Top |
Malignant transformation related pathway analysis |
| Find out the enriched GO biological processes and KEGG pathways involved in transition from healthy to precancer to cancer |
| Tissue | Disease Stage | Enriched GO biological Processes |
| Colorectum | AD |  |
| Colorectum | SER |  |
| Colorectum | MSS |  |
| Colorectum | MSI-H |  |
| Colorectum | FAP |  |
| ∗Top 15 enriched GO BP terms are showed in the bar plot of each disease state in each tissue. Each row represents a significant GO biological process which is colored according to the -log10(p.adjust). |
| Page: 1 2 3 4 5 6 7 8 9 |
| GO ID | Tissue | Disease Stage | Description | Gene Ratio | Bg Ratio | pvalue | p.adjust | Count |
| GO:001593117 | Esophagus | ESCC | nucleobase-containing compound transport | 162/8552 | 222/18723 | 9.87e-17 | 7.93e-15 | 162 |
| GO:001593111 | Liver | HCC | nucleobase-containing compound transport | 150/7958 | 222/18723 | 3.17e-14 | 2.03e-12 | 150 |
| GO:1901264 | Liver | HCC | carbohydrate derivative transport | 48/7958 | 80/18723 | 1.19e-03 | 6.62e-03 | 48 |
| GO:001593114 | Oral cavity | OSCC | nucleobase-containing compound transport | 150/7305 | 222/18723 | 4.86e-18 | 5.04e-16 | 150 |
| GO:19012642 | Oral cavity | OSCC | carbohydrate derivative transport | 44/7305 | 80/18723 | 2.67e-03 | 1.16e-02 | 44 |
| GO:0015931110 | Thyroid | PTC | nucleobase-containing compound transport | 120/5968 | 222/18723 | 5.45e-12 | 2.35e-10 | 120 |
| GO:001593122 | Thyroid | ATC | nucleobase-containing compound transport | 122/6293 | 222/18723 | 4.30e-11 | 1.41e-09 | 122 |
| Page: 1 |
| Pathway ID | Tissue | Disease Stage | Description | Gene Ratio | Bg Ratio | pvalue | p.adjust | qvalue | Count |
| Page: 1 |
Top |
Cell-cell communication analysis |
| Identification of potential cell-cell interactions between two cell types and their ligand-receptor pairs for different disease states |
| Ligand | Receptor | LRpair | Pathway | Tissue | Disease Stage |
| Page: 1 |
Top |
Single-cell gene regulatory network inference analysis |
| Find out the significant the regulons (TFs) and the target genes of each regulon across cell types for different disease states |
| TF | Cell Type | Tissue | Disease Stage | Target Gene | RSS | Regulon Activity |
| ∗The dot plots of a searched regulon are shown for all cell subpopulations in each disease state of each tissue based on the regulon specific score inferred using pySCENIC and by calculating the average expression. |
| Page: 1 |
Top |
Somatic mutation of malignant transformation related genes |
| Annotation of somatic variants for genes involved in malignant transformation |
| Hugo Symbol | Variant Class | Variant Classification | dbSNP RS | HGVSc | HGVSp | HGVSp Short | SWISSPROT | BIOTYPE | SIFT | PolyPhen | Tumor Sample Barcode | Tissue | Histology | Sex | Age | Stage | Therapy Types | Drugs | Outcome |
| SLC35E3 | SNV | Missense_Mutation | novel | c.634N>A | p.Glu212Lys | p.E212K | Q7Z769 | protein_coding | tolerated(0.22) | benign(0.005) | TCGA-GM-A2D9-01 | Breast | breast invasive carcinoma | Female | >=65 | I/II | Hormone Therapy | arimidex | SD |
| SLC35E3 | SNV | Missense_Mutation | c.665N>T | p.Ser222Phe | p.S222F | Q7Z769 | protein_coding | tolerated(0.33) | possibly_damaging(0.492) | TCGA-DR-A0ZM-01 | Cervix | cervical & endocervical cancer | Female | <65 | III/IV | Unspecific | Cisplatin | SD | |
| SLC35E3 | SNV | Missense_Mutation | c.105N>G | p.Ile35Met | p.I35M | Q7Z769 | protein_coding | deleterious(0.05) | benign(0.1) | TCGA-AA-A010-01 | Colorectum | colon adenocarcinoma | Female | <65 | I/II | Chemotherapy | folinic | CR | |
| SLC35E3 | SNV | Missense_Mutation | c.914N>A | p.Ser305Asn | p.S305N | Q7Z769 | protein_coding | tolerated(0.44) | benign(0) | TCGA-AD-6899-01 | Colorectum | colon adenocarcinoma | Male | >=65 | III/IV | Unknown | Unknown | SD | |
| SLC35E3 | SNV | Missense_Mutation | c.637G>A | p.Gly213Arg | p.G213R | Q7Z769 | protein_coding | tolerated(0.11) | possibly_damaging(0.703) | TCGA-F4-6856-01 | Colorectum | colon adenocarcinoma | Male | <65 | I/II | Ancillary | leucovorin | CR | |
| SLC35E3 | SNV | Missense_Mutation | c.244N>A | p.Leu82Ile | p.L82I | Q7Z769 | protein_coding | tolerated(0.09) | benign(0.271) | TCGA-AP-A051-01 | Endometrium | uterine corpus endometrioid carcinoma | Female | >=65 | I/II | Unknown | Unknown | SD | |
| SLC35E3 | SNV | Missense_Mutation | novel | c.404T>C | p.Ile135Thr | p.I135T | Q7Z769 | protein_coding | tolerated(0.14) | benign(0.06) | TCGA-AP-A1E0-01 | Endometrium | uterine corpus endometrioid carcinoma | Female | <65 | III/IV | Chemotherapy | paclitaxel | SD |
| SLC35E3 | SNV | Missense_Mutation | novel | c.119N>A | p.Gly40Asp | p.G40D | Q7Z769 | protein_coding | tolerated(0.09) | benign(0.007) | TCGA-AX-A1C5-01 | Endometrium | uterine corpus endometrioid carcinoma | Female | <65 | III/IV | Unspecific | Carboplatin | SD |
| SLC35E3 | SNV | Missense_Mutation | rs141445485 | c.761N>G | p.Asn254Ser | p.N254S | Q7Z769 | protein_coding | deleterious(0) | probably_damaging(0.977) | TCGA-B5-A3FA-01 | Endometrium | uterine corpus endometrioid carcinoma | Female | >=65 | I/II | Unknown | Unknown | SD |
| SLC35E3 | SNV | Missense_Mutation | c.602N>C | p.Val201Ala | p.V201A | Q7Z769 | protein_coding | tolerated(0.54) | benign(0.003) | TCGA-D1-A17Q-01 | Endometrium | uterine corpus endometrioid carcinoma | Female | <65 | I/II | Unknown | Unknown | SD |
| Page: 1 2 3 |
Top |
Related drugs of malignant transformation related genes |
| Identification of chemicals and drugs interact with genes involved in malignant transfromation |
| (DGIdb 4.0) |
| Entrez ID | Symbol | Category | Interaction Types | Drug Claim Name | Drug Name | PMIDs |
| Page: 1 |

Copyright 2023-Present -The University of Texas Health Science Center at Houston |