
|
|||||
|
 | |
| |
| |
| |
| |
| |
|
Gene: SLC35E2 |
Gene summary for SLC35E2 |
| Gene information | Species | Human | Gene symbol | SLC35E2 | Gene ID | 9906 |
| Gene name | solute carrier family 35 member E2A | |
| Gene Alias | SLC35E2 | |
| Cytomap | 1p36.33 | |
| Gene Type | protein-coding | GO ID | GO:0006810 | UniProtAcc | P0CK97 |
Top |
Malignant transformation analysis |
| Identification of the aberrant gene expression in precancerous and cancerous lesions by comparing the gene expression of stem-like cells in diseased tissues with normal stem cells |
| Entrez ID | Symbol | Replicates | Species | Organ | Tissue | Adj P-value | Log2FC | Malignancy |
| 9906 | SLC35E2 | HCC1 | Human | Liver | HCC | 3.89e-22 | 3.64e+00 | 0.5336 |
| 9906 | SLC35E2 | HCC2 | Human | Liver | HCC | 8.06e-20 | 2.26e+00 | 0.5341 |
| 9906 | SLC35E2 | HCC5 | Human | Liver | HCC | 5.09e-09 | 1.09e+00 | 0.4932 |
| Page: 1 |
| Tissue | Expression Dynamics | Abbreviation |
| Liver | 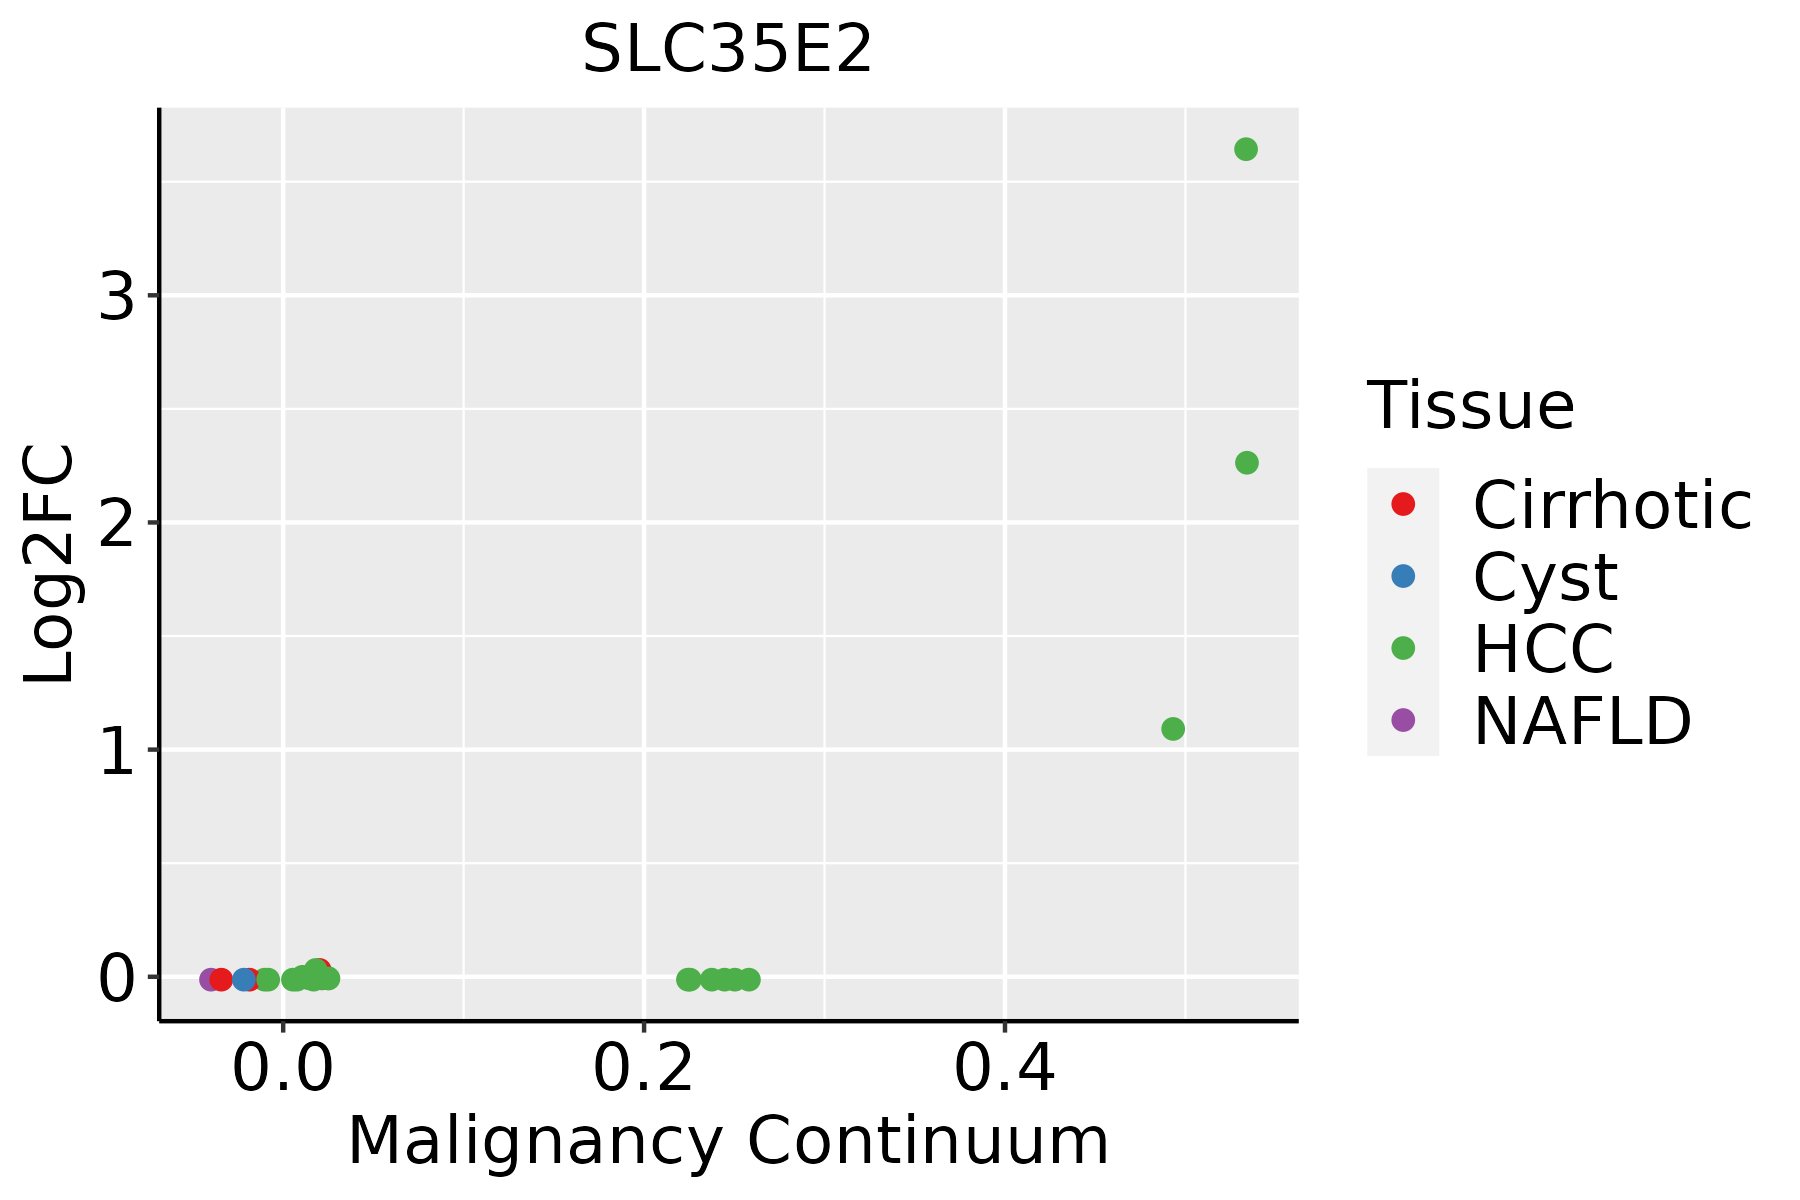 | HCC: Hepatocellular carcinoma |
| NAFLD: Non-alcoholic fatty liver disease |
| ∗log2FC in expression of this searched gene in stem-like cells from each diseased tissue sample relative to stem-like cells in normal samples in each tissue plotted against the malignancy continuum. Samples are colored based on if they are from different disease stage. |
Top |
Malignant transformation related pathway analysis |
| Find out the enriched GO biological processes and KEGG pathways involved in transition from healthy to precancer to cancer |
| Tissue | Disease Stage | Enriched GO biological Processes |
| Colorectum | AD |  |
| Colorectum | SER |  |
| Colorectum | MSS |  |
| Colorectum | MSI-H |  |
| Colorectum | FAP |  |
| ∗Top 15 enriched GO BP terms are showed in the bar plot of each disease state in each tissue. Each row represents a significant GO biological process which is colored according to the -log10(p.adjust). |
| Page: 1 2 3 4 5 6 7 8 9 |
| GO ID | Tissue | Disease Stage | Description | Gene Ratio | Bg Ratio | pvalue | p.adjust | Count |
| GO:0001701 | Colorectum | AD | in utero embryonic development | 110/3918 | 367/18723 | 2.36e-05 | 4.62e-04 | 110 |
| GO:00017012 | Colorectum | MSS | in utero embryonic development | 99/3467 | 367/18723 | 3.71e-05 | 7.10e-04 | 99 |
| GO:00017013 | Colorectum | FAP | in utero embryonic development | 81/2622 | 367/18723 | 1.58e-05 | 4.10e-04 | 81 |
| GO:000170119 | Esophagus | ESCC | in utero embryonic development | 243/8552 | 367/18723 | 1.00e-15 | 6.86e-14 | 243 |
| GO:000182412 | Esophagus | ESCC | blastocyst development | 73/8552 | 106/18723 | 1.13e-06 | 1.40e-05 | 73 |
| GO:000170116 | Oral cavity | OSCC | in utero embryonic development | 207/7305 | 367/18723 | 7.92e-12 | 2.95e-10 | 207 |
| GO:00018243 | Oral cavity | OSCC | blastocyst development | 66/7305 | 106/18723 | 1.04e-06 | 1.40e-05 | 66 |
| Page: 1 |
| Pathway ID | Tissue | Disease Stage | Description | Gene Ratio | Bg Ratio | pvalue | p.adjust | qvalue | Count |
| Page: 1 |
Top |
Cell-cell communication analysis |
| Identification of potential cell-cell interactions between two cell types and their ligand-receptor pairs for different disease states |
| Ligand | Receptor | LRpair | Pathway | Tissue | Disease Stage |
| Page: 1 |
Top |
Single-cell gene regulatory network inference analysis |
| Find out the significant the regulons (TFs) and the target genes of each regulon across cell types for different disease states |
| TF | Cell Type | Tissue | Disease Stage | Target Gene | RSS | Regulon Activity |
| ∗The dot plots of a searched regulon are shown for all cell subpopulations in each disease state of each tissue based on the regulon specific score inferred using pySCENIC and by calculating the average expression. |
| Page: 1 |
Top |
Somatic mutation of malignant transformation related genes |
| Annotation of somatic variants for genes involved in malignant transformation |
| Hugo Symbol | Variant Class | Variant Classification | dbSNP RS | HGVSc | HGVSp | HGVSp Short | SWISSPROT | BIOTYPE | SIFT | PolyPhen | Tumor Sample Barcode | Tissue | Histology | Sex | Age | Stage | Therapy Types | Drugs | Outcome |
| SLC35E2 | SNV | Missense_Mutation | novel | c.350N>G | p.Val117Gly | p.V117G | P0CK97 | protein_coding | deleterious(0) | benign(0.236) | TCGA-D8-A1XK-01 | Breast | breast invasive carcinoma | Female | <65 | I/II | Chemotherapy | doxorubicine+cyclophosphamide | SD |
| SLC35E2 | SNV | Missense_Mutation | rs149746326 | c.737C>T | p.Pro246Leu | p.P246L | P0CK97 | protein_coding | tolerated_low_confidence(0.12) | benign(0.001) | TCGA-2W-A8YY-01 | Cervix | cervical & endocervical cancer | Female | <65 | I/II | Chemotherapy | cisplatin | CR |
| SLC35E2 | SNV | Missense_Mutation | c.587N>T | p.Gly196Val | p.G196V | P0CK97 | protein_coding | deleterious(0) | probably_damaging(0.937) | TCGA-A6-5667-01 | Colorectum | colon adenocarcinoma | Female | <65 | III/IV | Chemotherapy | oxaliplatin | SD | |
| SLC35E2 | SNV | Missense_Mutation | novel | c.530N>A | p.Ser177Asn | p.S177N | P0CK97 | protein_coding | deleterious(0) | possibly_damaging(0.902) | TCGA-AP-A0LM-01 | Endometrium | uterine corpus endometrioid carcinoma | Female | <65 | III/IV | Chemotherapy | cisplatin | SD |
| SLC35E2 | SNV | Missense_Mutation | novel | c.677C>A | p.Pro226His | p.P226H | P0CK97 | protein_coding | deleterious_low_confidence(0.02) | benign(0.067) | TCGA-DF-A2KN-01 | Endometrium | uterine corpus endometrioid carcinoma | Female | Unknown | I/II | Unknown | Unknown | SD |
| SLC35E2 | SNV | Missense_Mutation | novel | c.770N>T | p.Ala257Val | p.A257V | P0CK97 | protein_coding | deleterious_low_confidence(0) | benign(0.007) | TCGA-DF-A2KU-01 | Endometrium | uterine corpus endometrioid carcinoma | Female | Unknown | I/II | Unknown | Unknown | SD |
| SLC35E2 | SNV | Missense_Mutation | novel | c.567N>T | p.Met189Ile | p.M189I | P0CK97 | protein_coding | tolerated(0.19) | benign(0.019) | TCGA-E6-A1LX-01 | Endometrium | uterine corpus endometrioid carcinoma | Female | <65 | I/II | Unknown | Unknown | SD |
| SLC35E2 | SNV | Missense_Mutation | novel | c.704A>G | p.His235Arg | p.H235R | P0CK97 | protein_coding | deleterious_low_confidence(0.01) | benign(0.278) | TCGA-FI-A2D5-01 | Endometrium | uterine corpus endometrioid carcinoma | Female | <65 | III/IV | Chemotherapy | carboplatinum | PD |
| SLC35E2 | insertion | Frame_Shift_Ins | novel | c.783_784insC | p.Met262HisfsTer65 | p.M262Hfs*65 | P0CK97 | protein_coding | TCGA-D1-A16F-01 | Endometrium | uterine corpus endometrioid carcinoma | Female | <65 | I/II | Unknown | Unknown | SD | ||
| SLC35E2 | SNV | Missense_Mutation | c.602G>T | p.Arg201Leu | p.R201L | P0CK97 | protein_coding | tolerated_low_confidence(0.51) | benign(0.071) | TCGA-49-6767-01 | Lung | lung adenocarcinoma | Female | <65 | I/II | Unknown | Unknown | SD |
| Page: 1 2 |
Top |
Related drugs of malignant transformation related genes |
| Identification of chemicals and drugs interact with genes involved in malignant transfromation |
| (DGIdb 4.0) |
| Entrez ID | Symbol | Category | Interaction Types | Drug Claim Name | Drug Name | PMIDs |
| Page: 1 |

Copyright 2023-Present -The University of Texas Health Science Center at Houston |