
|
|||||
|
 | |
| |
| |
| |
| |
| |
|
Gene: SLC35E1 |
Gene summary for SLC35E1 |
| Gene information | Species | Human | Gene symbol | SLC35E1 | Gene ID | 79939 |
| Gene name | solute carrier family 35 member E1 | |
| Gene Alias | SLC35E1 | |
| Cytomap | 19p13.11 | |
| Gene Type | protein-coding | GO ID | GO:0006810 | UniProtAcc | A0A024R7G7 |
Top |
Malignant transformation analysis |
| Identification of the aberrant gene expression in precancerous and cancerous lesions by comparing the gene expression of stem-like cells in diseased tissues with normal stem cells |
| Entrez ID | Symbol | Replicates | Species | Organ | Tissue | Adj P-value | Log2FC | Malignancy |
| 79939 | SLC35E1 | HCC1_Meng | Human | Liver | HCC | 2.73e-53 | 9.92e-02 | 0.0246 |
| 79939 | SLC35E1 | HCC2_Meng | Human | Liver | HCC | 3.20e-25 | 1.32e-01 | 0.0107 |
| 79939 | SLC35E1 | HCC1 | Human | Liver | HCC | 7.57e-17 | 4.29e+00 | 0.5336 |
| 79939 | SLC35E1 | HCC2 | Human | Liver | HCC | 2.92e-29 | 3.83e+00 | 0.5341 |
| 79939 | SLC35E1 | HCC5 | Human | Liver | HCC | 8.54e-21 | 1.84e+00 | 0.4932 |
| 79939 | SLC35E1 | Pt13.b | Human | Liver | HCC | 3.51e-02 | 3.25e-02 | 0.0251 |
| 79939 | SLC35E1 | Pt14.b | Human | Liver | HCC | 2.76e-02 | 1.66e-01 | 0.018 |
| 79939 | SLC35E1 | S014 | Human | Liver | HCC | 3.66e-03 | 1.76e-01 | 0.2254 |
| 79939 | SLC35E1 | S016 | Human | Liver | HCC | 3.89e-03 | 2.02e-01 | 0.2243 |
| 79939 | SLC35E1 | S027 | Human | Liver | HCC | 6.62e-10 | 7.55e-01 | 0.2446 |
| 79939 | SLC35E1 | S028 | Human | Liver | HCC | 8.95e-23 | 8.90e-01 | 0.2503 |
| 79939 | SLC35E1 | S029 | Human | Liver | HCC | 1.37e-19 | 8.88e-01 | 0.2581 |
| 79939 | SLC35E1 | C04 | Human | Oral cavity | OSCC | 6.42e-15 | 5.38e-01 | 0.2633 |
| 79939 | SLC35E1 | C21 | Human | Oral cavity | OSCC | 1.72e-08 | 3.04e-01 | 0.2678 |
| 79939 | SLC35E1 | C30 | Human | Oral cavity | OSCC | 3.79e-30 | 1.08e+00 | 0.3055 |
| 79939 | SLC35E1 | C38 | Human | Oral cavity | OSCC | 8.12e-03 | 6.13e-01 | 0.172 |
| 79939 | SLC35E1 | C43 | Human | Oral cavity | OSCC | 5.74e-18 | 3.79e-01 | 0.1704 |
| 79939 | SLC35E1 | C46 | Human | Oral cavity | OSCC | 3.90e-13 | 2.62e-01 | 0.1673 |
| 79939 | SLC35E1 | C51 | Human | Oral cavity | OSCC | 5.24e-10 | 3.32e-01 | 0.2674 |
| 79939 | SLC35E1 | C57 | Human | Oral cavity | OSCC | 5.76e-16 | 3.44e-01 | 0.1679 |
| Page: 1 2 3 |
| Tissue | Expression Dynamics | Abbreviation |
| Liver | 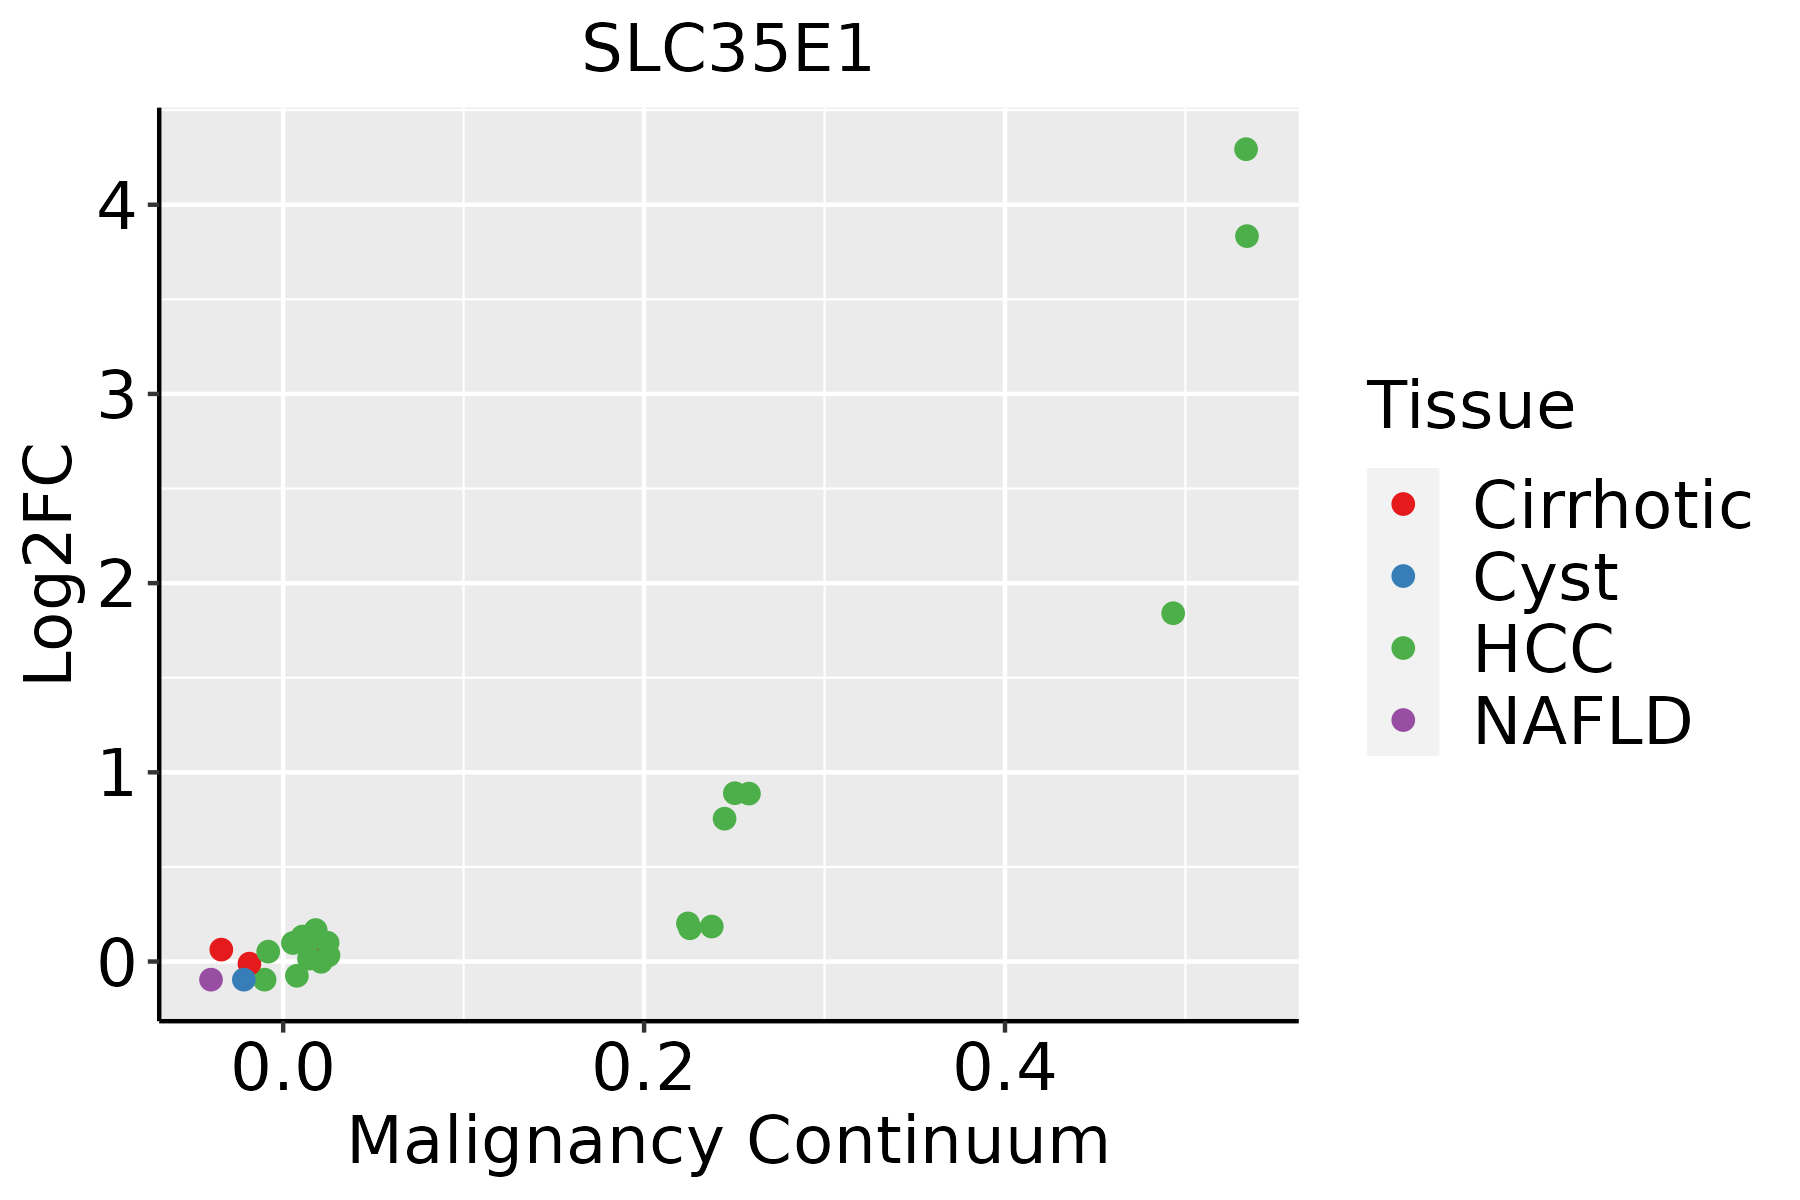 | HCC: Hepatocellular carcinoma |
| NAFLD: Non-alcoholic fatty liver disease | ||
| Oral Cavity | 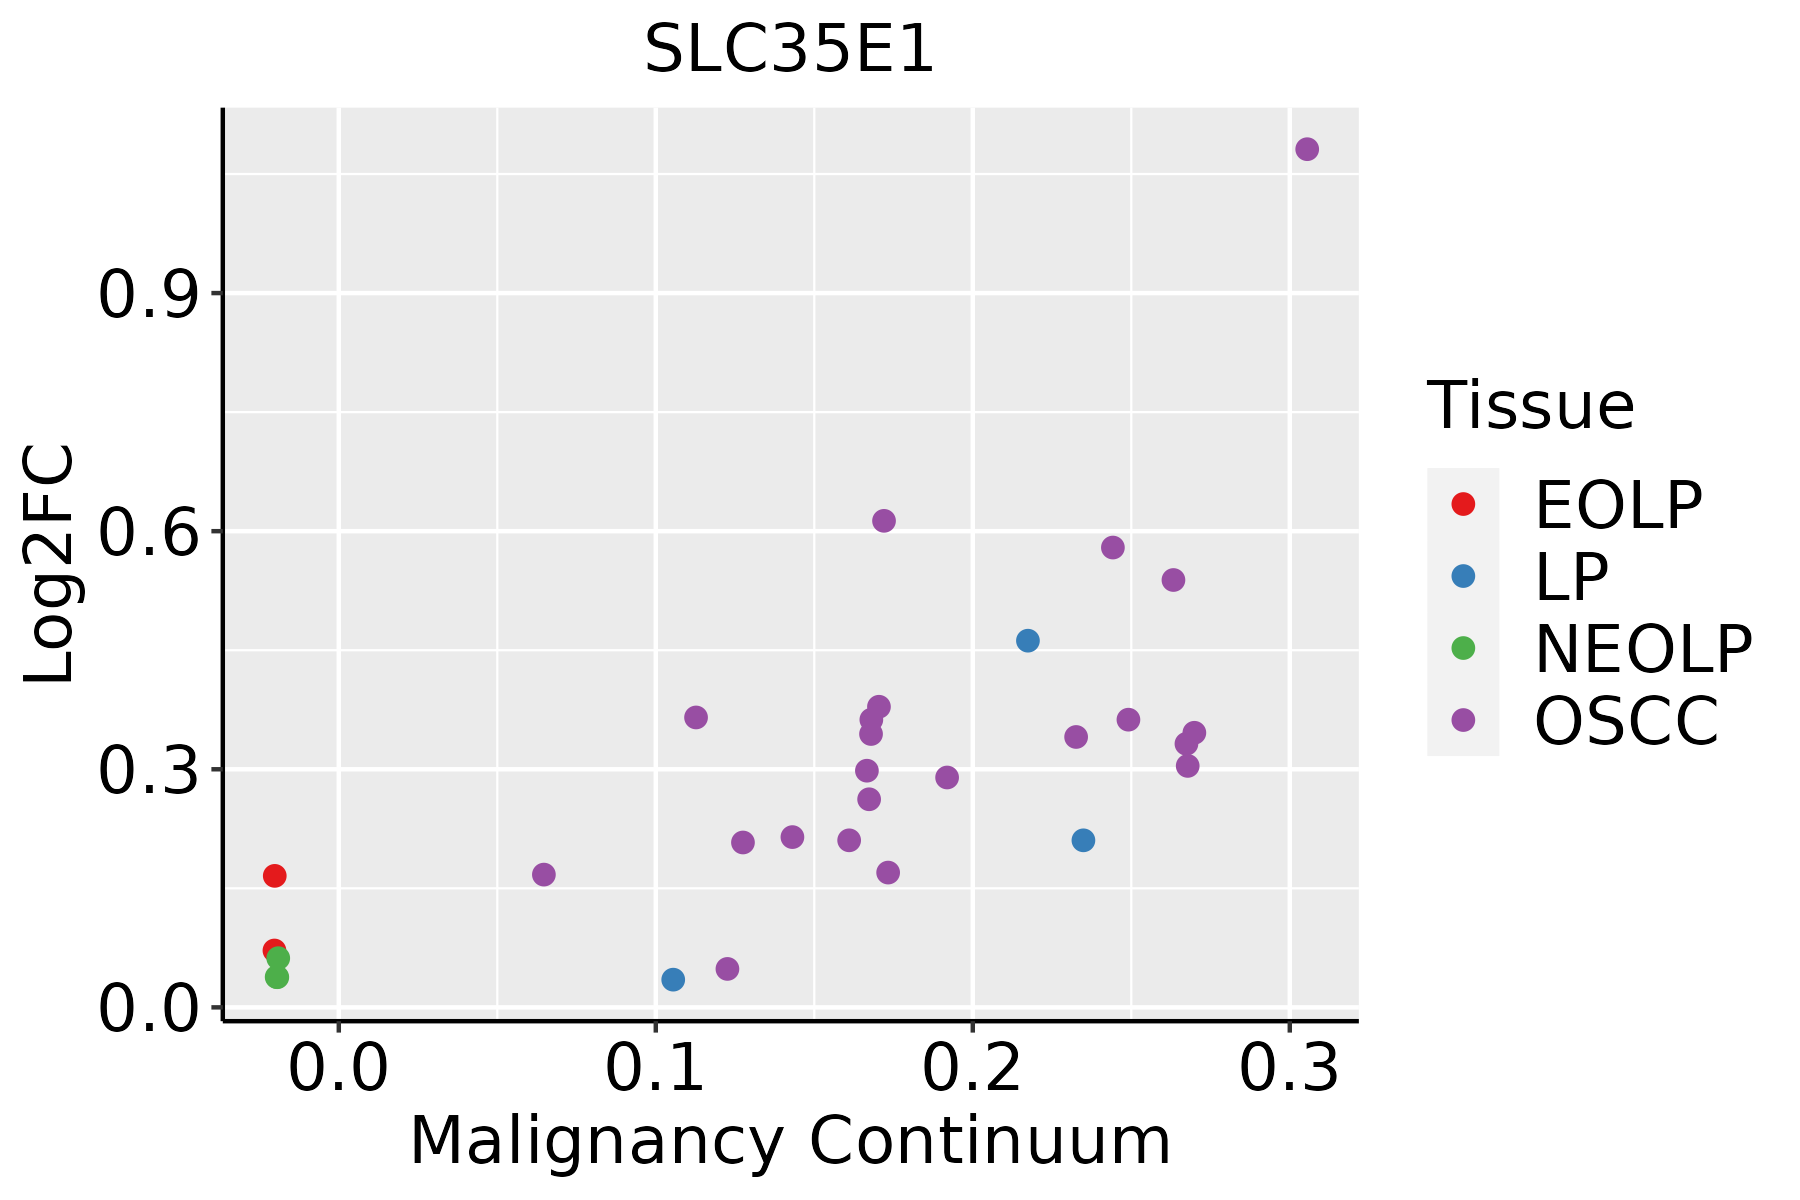 | EOLP: Erosive Oral lichen planus |
| LP: leukoplakia | ||
| NEOLP: Non-erosive oral lichen planus | ||
| OSCC: Oral squamous cell carcinoma | ||
| Prostate | 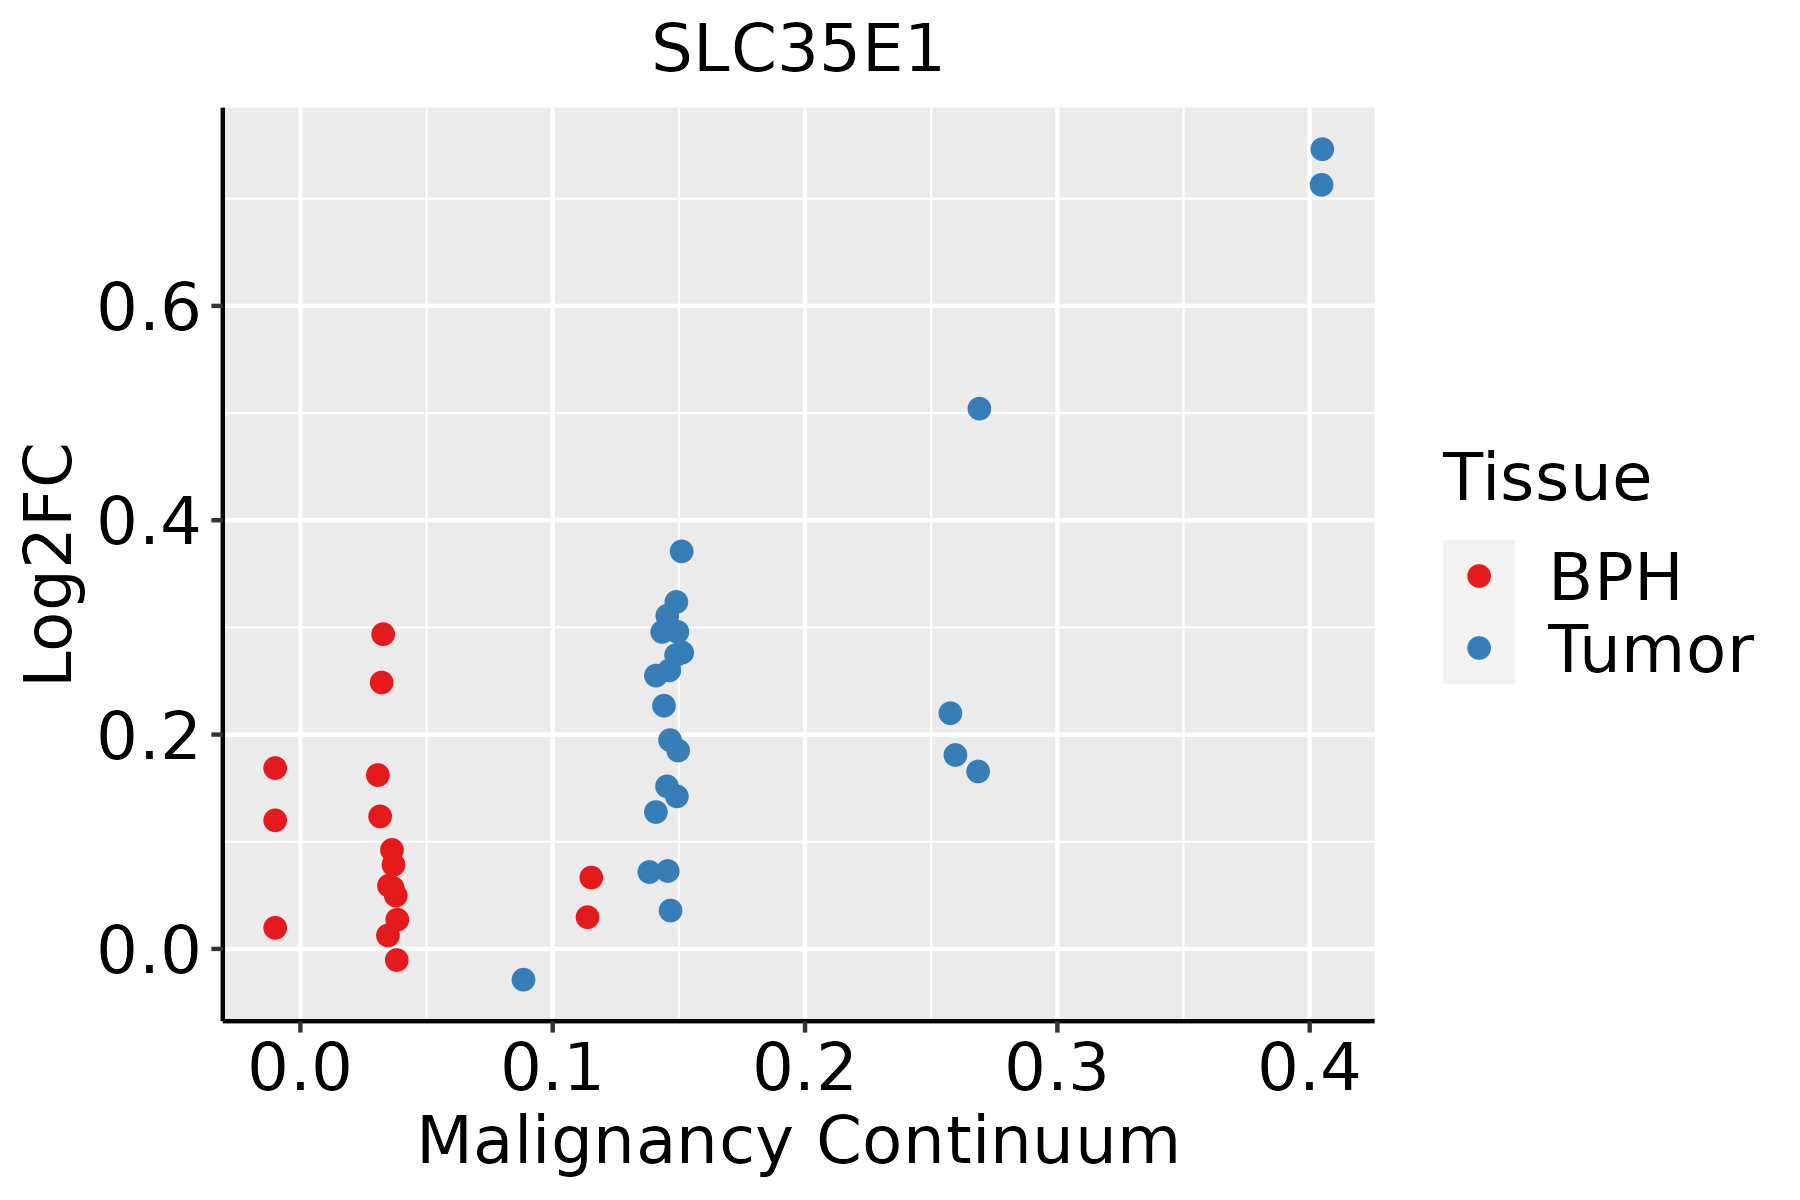 | BPH: Benign Prostatic Hyperplasia |
| Thyroid | 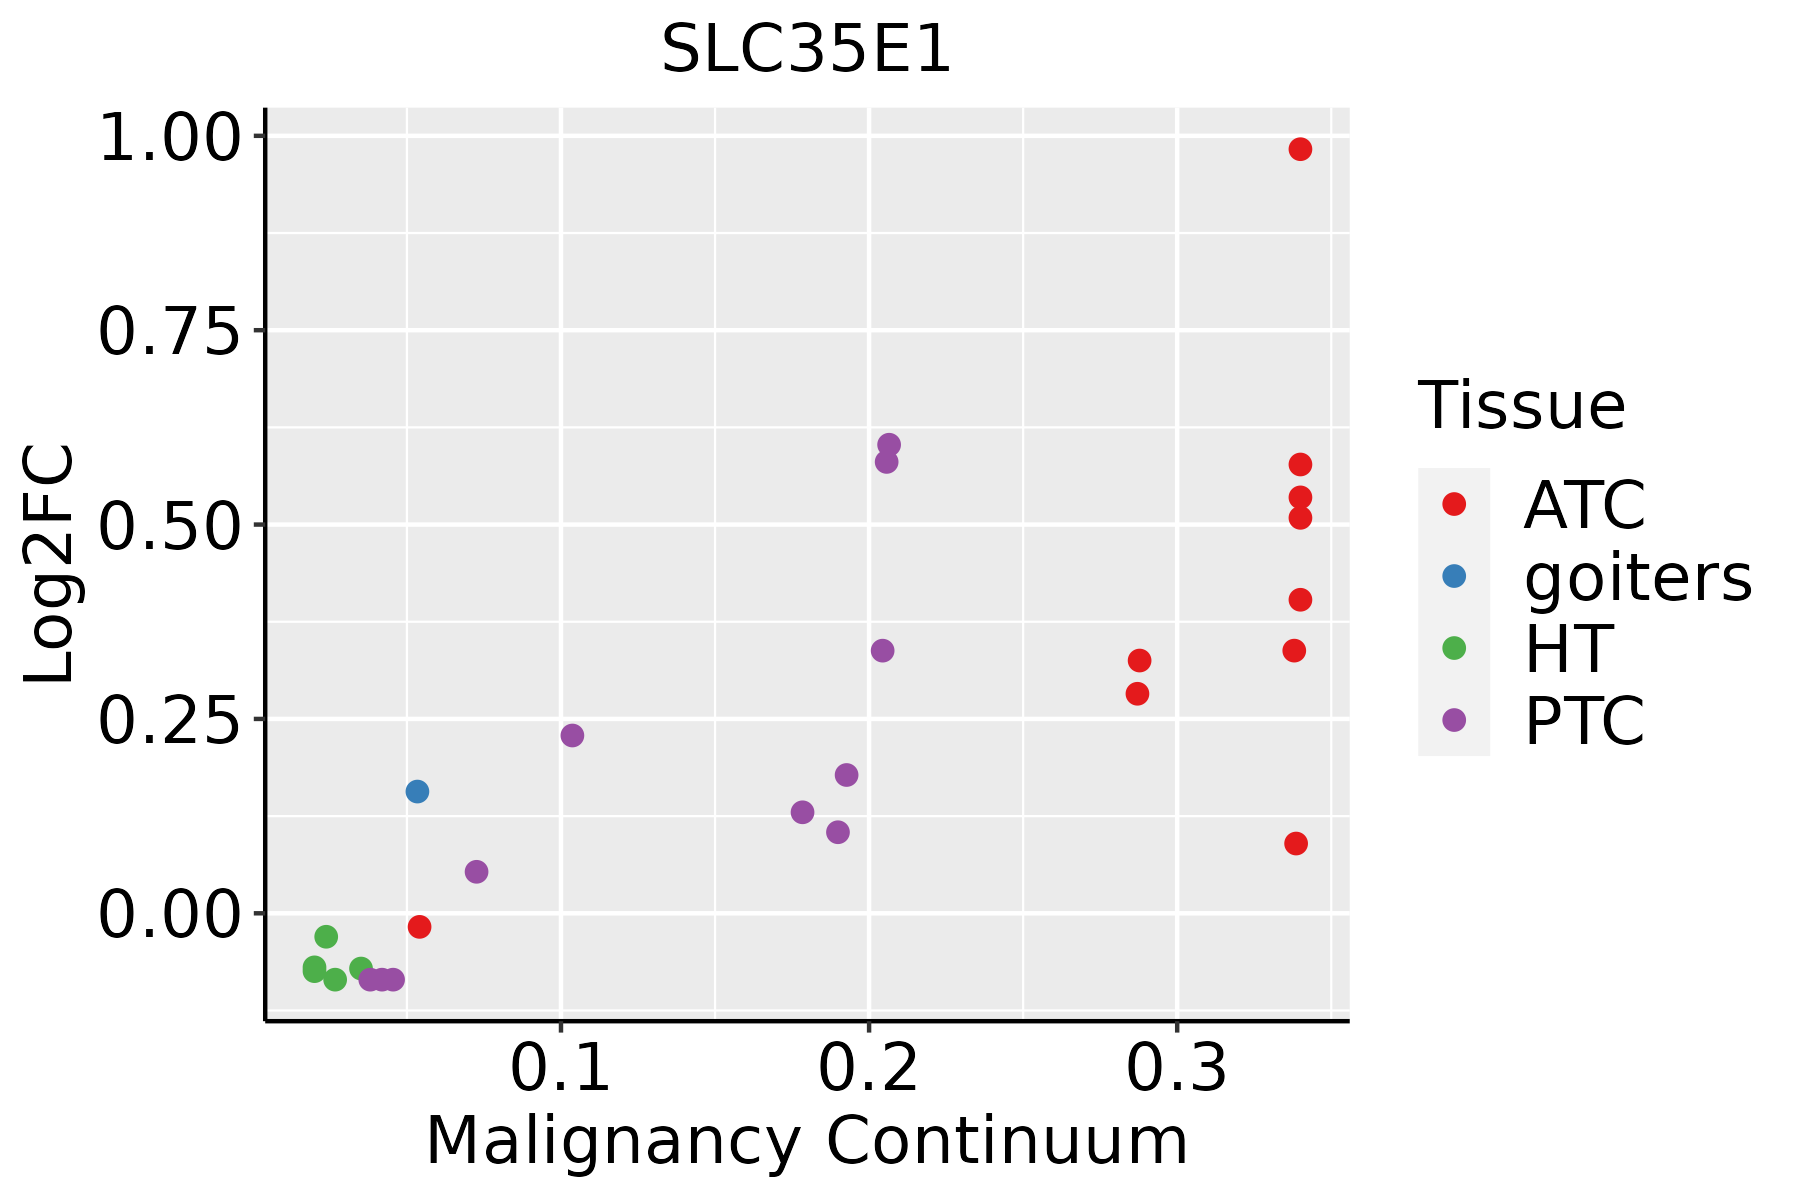 | ATC: Anaplastic thyroid cancer |
| HT: Hashimoto's thyroiditis | ||
| PTC: Papillary thyroid cancer |
| ∗log2FC in expression of this searched gene in stem-like cells from each diseased tissue sample relative to stem-like cells in normal samples in each tissue plotted against the malignancy continuum. Samples are colored based on if they are from different disease stage. |
Top |
Malignant transformation related pathway analysis |
| Find out the enriched GO biological processes and KEGG pathways involved in transition from healthy to precancer to cancer |
| Tissue | Disease Stage | Enriched GO biological Processes |
| Colorectum | AD |  |
| Colorectum | SER |  |
| Colorectum | MSS |  |
| Colorectum | MSI-H |  |
| Colorectum | FAP |  |
| ∗Top 15 enriched GO BP terms are showed in the bar plot of each disease state in each tissue. Each row represents a significant GO biological process which is colored according to the -log10(p.adjust). |
| Page: 1 2 3 4 5 6 7 8 9 |
| GO ID | Tissue | Disease Stage | Description | Gene Ratio | Bg Ratio | pvalue | p.adjust | Count |
| Page: 1 |
| Pathway ID | Tissue | Disease Stage | Description | Gene Ratio | Bg Ratio | pvalue | p.adjust | qvalue | Count |
| Page: 1 |
Top |
Cell-cell communication analysis |
| Identification of potential cell-cell interactions between two cell types and their ligand-receptor pairs for different disease states |
| Ligand | Receptor | LRpair | Pathway | Tissue | Disease Stage |
| Page: 1 |
Top |
Single-cell gene regulatory network inference analysis |
| Find out the significant the regulons (TFs) and the target genes of each regulon across cell types for different disease states |
| TF | Cell Type | Tissue | Disease Stage | Target Gene | RSS | Regulon Activity |
| ∗The dot plots of a searched regulon are shown for all cell subpopulations in each disease state of each tissue based on the regulon specific score inferred using pySCENIC and by calculating the average expression. |
| Page: 1 |
Top |
Somatic mutation of malignant transformation related genes |
| Annotation of somatic variants for genes involved in malignant transformation |
| Hugo Symbol | Variant Class | Variant Classification | dbSNP RS | HGVSc | HGVSp | HGVSp Short | SWISSPROT | BIOTYPE | SIFT | PolyPhen | Tumor Sample Barcode | Tissue | Histology | Sex | Age | Stage | Therapy Types | Drugs | Outcome |
| SLC35E1 | SNV | Missense_Mutation | novel | c.527N>G | p.Val176Gly | p.V176G | Q96K37 | protein_coding | deleterious(0.03) | benign(0.04) | TCGA-A2-A3XV-01 | Breast | breast invasive carcinoma | Female | <65 | I/II | Chemotherapy | carboplatin | CR |
| SLC35E1 | SNV | Missense_Mutation | c.738N>G | p.Phe246Leu | p.F246L | Q96K37 | protein_coding | tolerated(0.35) | possibly_damaging(0.621) | TCGA-B6-A0I8-01 | Breast | breast invasive carcinoma | Female | <65 | I/II | Unknown | Unknown | PD | |
| SLC35E1 | SNV | Missense_Mutation | rs753256934 | c.497N>G | p.Tyr166Cys | p.Y166C | Q96K37 | protein_coding | deleterious(0) | probably_damaging(1) | TCGA-D8-A1XK-01 | Breast | breast invasive carcinoma | Female | <65 | I/II | Chemotherapy | doxorubicine+cyclophosphamide | SD |
| SLC35E1 | SNV | Missense_Mutation | novel | c.581N>T | p.Ala194Val | p.A194V | Q96K37 | protein_coding | deleterious(0.03) | possibly_damaging(0.666) | TCGA-2W-A8YY-01 | Cervix | cervical & endocervical cancer | Female | <65 | I/II | Chemotherapy | cisplatin | CR |
| SLC35E1 | SNV | Missense_Mutation | novel | c.76G>A | p.Glu26Lys | p.E26K | Q96K37 | protein_coding | tolerated(0.13) | benign(0.007) | TCGA-EA-A3HU-01 | Cervix | cervical & endocervical cancer | Female | <65 | I/II | Unknown | Unknown | SD |
| SLC35E1 | SNV | Missense_Mutation | rs765255227 | c.646N>T | p.Arg216Trp | p.R216W | Q96K37 | protein_coding | deleterious(0.02) | possibly_damaging(0.877) | TCGA-EK-A2RE-01 | Cervix | cervical & endocervical cancer | Female | <65 | I/II | Unknown | Unknown | SD |
| SLC35E1 | SNV | Missense_Mutation | c.640G>C | p.Asp214His | p.D214H | Q96K37 | protein_coding | deleterious(0) | probably_damaging(0.995) | TCGA-EK-A3GK-01 | Cervix | cervical & endocervical cancer | Female | <65 | I/II | Unknown | Unknown | SD | |
| SLC35E1 | SNV | Missense_Mutation | rs200335570 | c.1079N>A | p.Arg360His | p.R360H | Q96K37 | protein_coding | tolerated(1) | benign(0) | TCGA-AA-3695-01 | Colorectum | colon adenocarcinoma | Female | <65 | III/IV | Unknown | Unknown | SD |
| SLC35E1 | SNV | Missense_Mutation | c.547N>A | p.Glu183Lys | p.E183K | Q96K37 | protein_coding | deleterious(0.02) | benign(0.068) | TCGA-AA-3695-01 | Colorectum | colon adenocarcinoma | Female | <65 | III/IV | Unknown | Unknown | SD | |
| SLC35E1 | SNV | Missense_Mutation | rs765255227 | c.646C>T | p.Arg216Trp | p.R216W | Q96K37 | protein_coding | deleterious(0.02) | possibly_damaging(0.877) | TCGA-AA-3984-01 | Colorectum | colon adenocarcinoma | Female | <65 | I/II | Unknown | Unknown | SD |
| Page: 1 2 3 4 |
Top |
Related drugs of malignant transformation related genes |
| Identification of chemicals and drugs interact with genes involved in malignant transfromation |
| (DGIdb 4.0) |
| Entrez ID | Symbol | Category | Interaction Types | Drug Claim Name | Drug Name | PMIDs |
| Page: 1 |

Copyright 2023-Present -The University of Texas Health Science Center at Houston |