
|
|||||
|
 | |
| |
| |
| |
| |
| |
|
Gene: SLC35D2 |
Gene summary for SLC35D2 |
| Gene information | Species | Human | Gene symbol | SLC35D2 | Gene ID | 11046 |
| Gene name | solute carrier family 35 member D2 | |
| Gene Alias | HFRC1 | |
| Cytomap | 9q22.32 | |
| Gene Type | protein-coding | GO ID | GO:0006022 | UniProtAcc | Q76EJ3 |
Top |
Malignant transformation analysis |
| Identification of the aberrant gene expression in precancerous and cancerous lesions by comparing the gene expression of stem-like cells in diseased tissues with normal stem cells |
| Entrez ID | Symbol | Replicates | Species | Organ | Tissue | Adj P-value | Log2FC | Malignancy |
| 11046 | SLC35D2 | HTA11_3410_2000001011 | Human | Colorectum | AD | 7.27e-05 | 3.33e-01 | 0.0155 |
| 11046 | SLC35D2 | HTA11_2487_2000001011 | Human | Colorectum | SER | 3.29e-19 | 8.77e-01 | -0.1808 |
| 11046 | SLC35D2 | HTA11_1938_2000001011 | Human | Colorectum | AD | 2.22e-14 | 7.44e-01 | -0.0811 |
| 11046 | SLC35D2 | HTA11_78_2000001011 | Human | Colorectum | AD | 2.24e-06 | 5.37e-01 | -0.1088 |
| 11046 | SLC35D2 | HTA11_347_2000001011 | Human | Colorectum | AD | 6.31e-28 | 9.17e-01 | -0.1954 |
| 11046 | SLC35D2 | HTA11_411_2000001011 | Human | Colorectum | SER | 1.70e-10 | 1.34e+00 | -0.2602 |
| 11046 | SLC35D2 | HTA11_2112_2000001011 | Human | Colorectum | SER | 7.14e-06 | 8.47e-01 | -0.2196 |
| 11046 | SLC35D2 | HTA11_3361_2000001011 | Human | Colorectum | AD | 1.17e-04 | 4.72e-01 | -0.1207 |
| 11046 | SLC35D2 | HTA11_83_2000001011 | Human | Colorectum | SER | 1.67e-07 | 6.81e-01 | -0.1526 |
| 11046 | SLC35D2 | HTA11_696_2000001011 | Human | Colorectum | AD | 2.00e-21 | 7.68e-01 | -0.1464 |
| 11046 | SLC35D2 | HTA11_866_2000001011 | Human | Colorectum | AD | 4.47e-13 | 5.36e-01 | -0.1001 |
| 11046 | SLC35D2 | HTA11_1391_2000001011 | Human | Colorectum | AD | 3.29e-15 | 7.23e-01 | -0.059 |
| 11046 | SLC35D2 | HTA11_546_2000001011 | Human | Colorectum | AD | 6.20e-05 | 5.87e-01 | -0.0842 |
| 11046 | SLC35D2 | HTA11_10623_2000001011 | Human | Colorectum | AD | 2.65e-04 | 6.34e-01 | -0.0177 |
| 11046 | SLC35D2 | HTA11_10711_2000001011 | Human | Colorectum | AD | 7.72e-03 | 3.76e-01 | 0.0338 |
| 11046 | SLC35D2 | HTA11_7696_3000711011 | Human | Colorectum | AD | 3.05e-07 | 4.35e-01 | 0.0674 |
| 11046 | SLC35D2 | HTA11_99999965062_69753 | Human | Colorectum | MSI-H | 1.79e-09 | 1.54e+00 | 0.3487 |
| 11046 | SLC35D2 | HTA11_99999965104_69814 | Human | Colorectum | MSS | 4.42e-13 | 7.44e-01 | 0.281 |
| 11046 | SLC35D2 | HTA11_99999971662_82457 | Human | Colorectum | MSS | 7.43e-14 | 7.37e-01 | 0.3859 |
| 11046 | SLC35D2 | A015-C-203 | Human | Colorectum | FAP | 3.07e-07 | -1.89e-01 | -0.1294 |
| Page: 1 2 3 |
| Tissue | Expression Dynamics | Abbreviation |
| Colorectum (GSE201348) |  | FAP: Familial adenomatous polyposis |
| CRC: Colorectal cancer | ||
| Colorectum (HTA11) |  | AD: Adenomas |
| SER: Sessile serrated lesions | ||
| MSI-H: Microsatellite-high colorectal cancer | ||
| MSS: Microsatellite stable colorectal cancer | ||
| Liver | 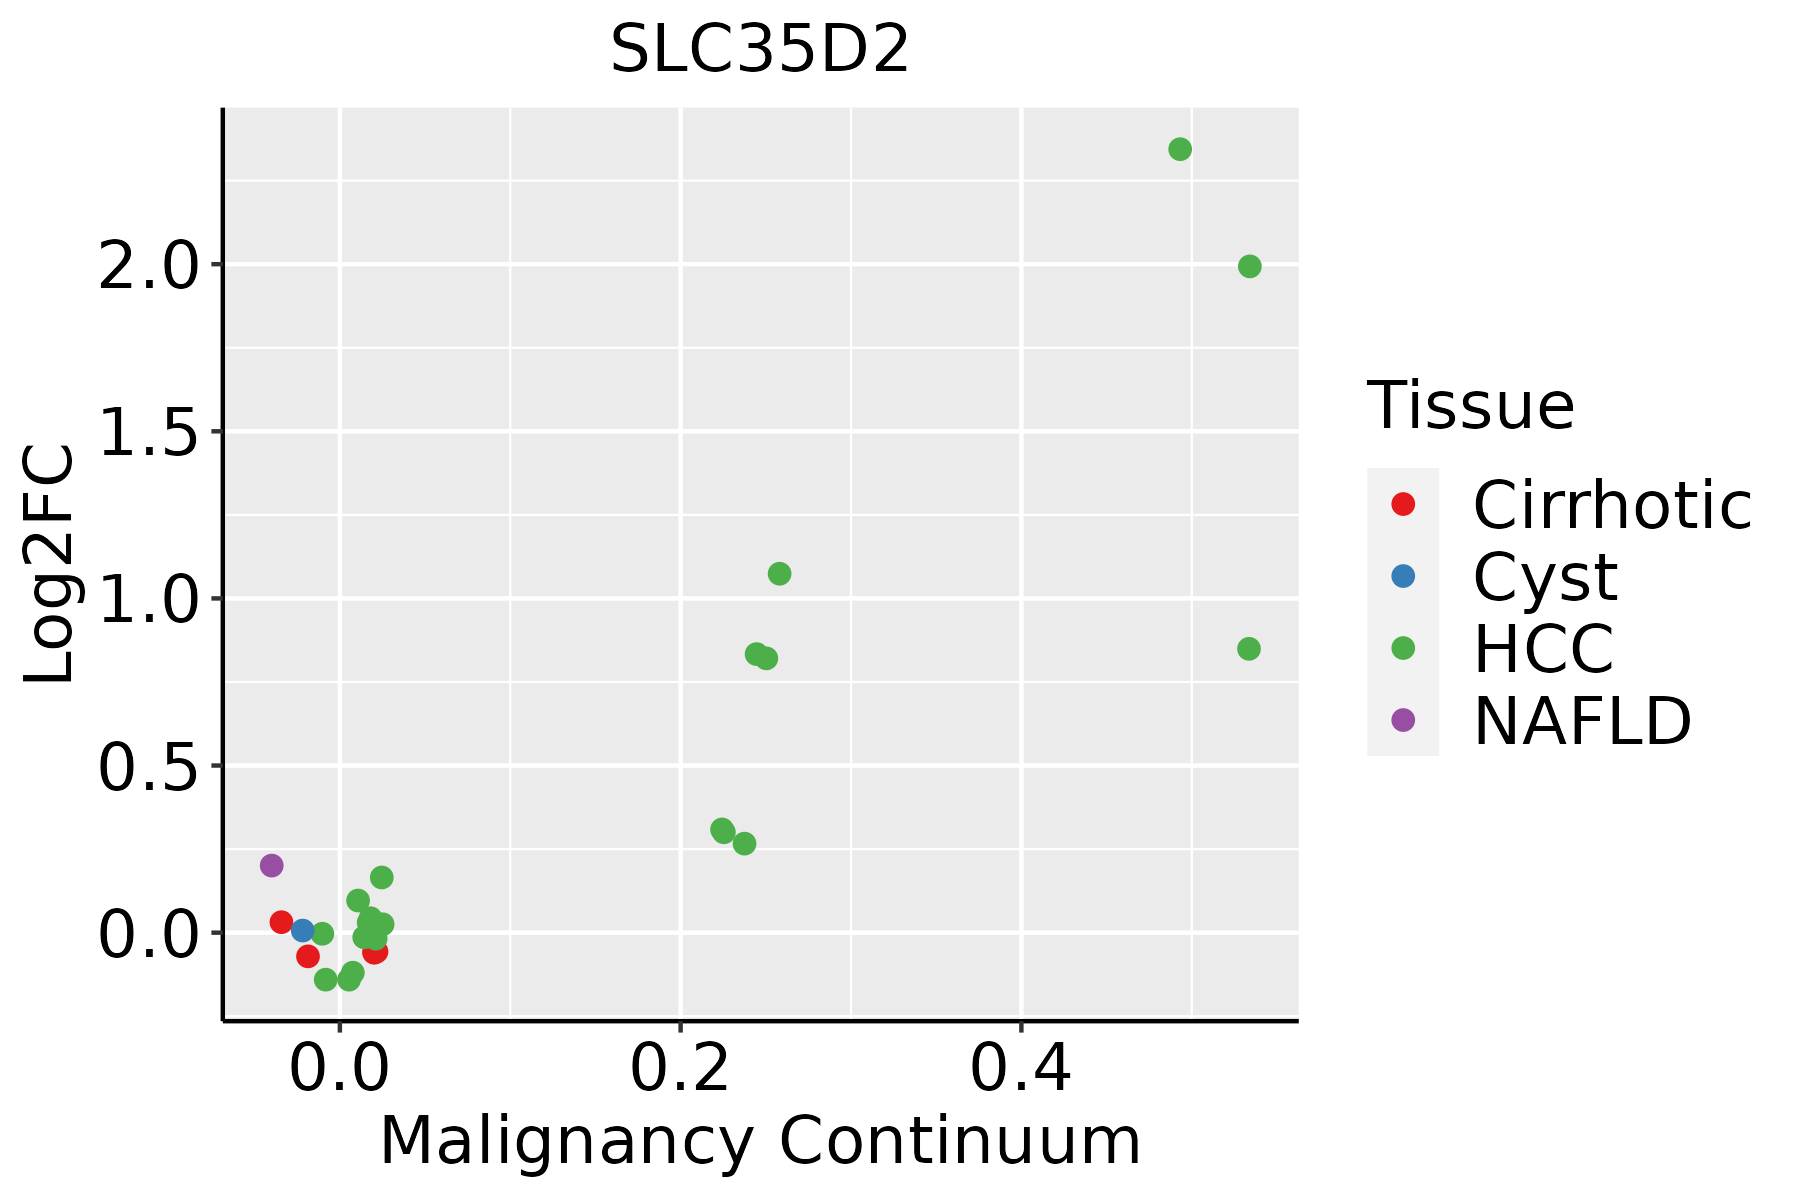 | HCC: Hepatocellular carcinoma |
| NAFLD: Non-alcoholic fatty liver disease | ||
| Oral Cavity | 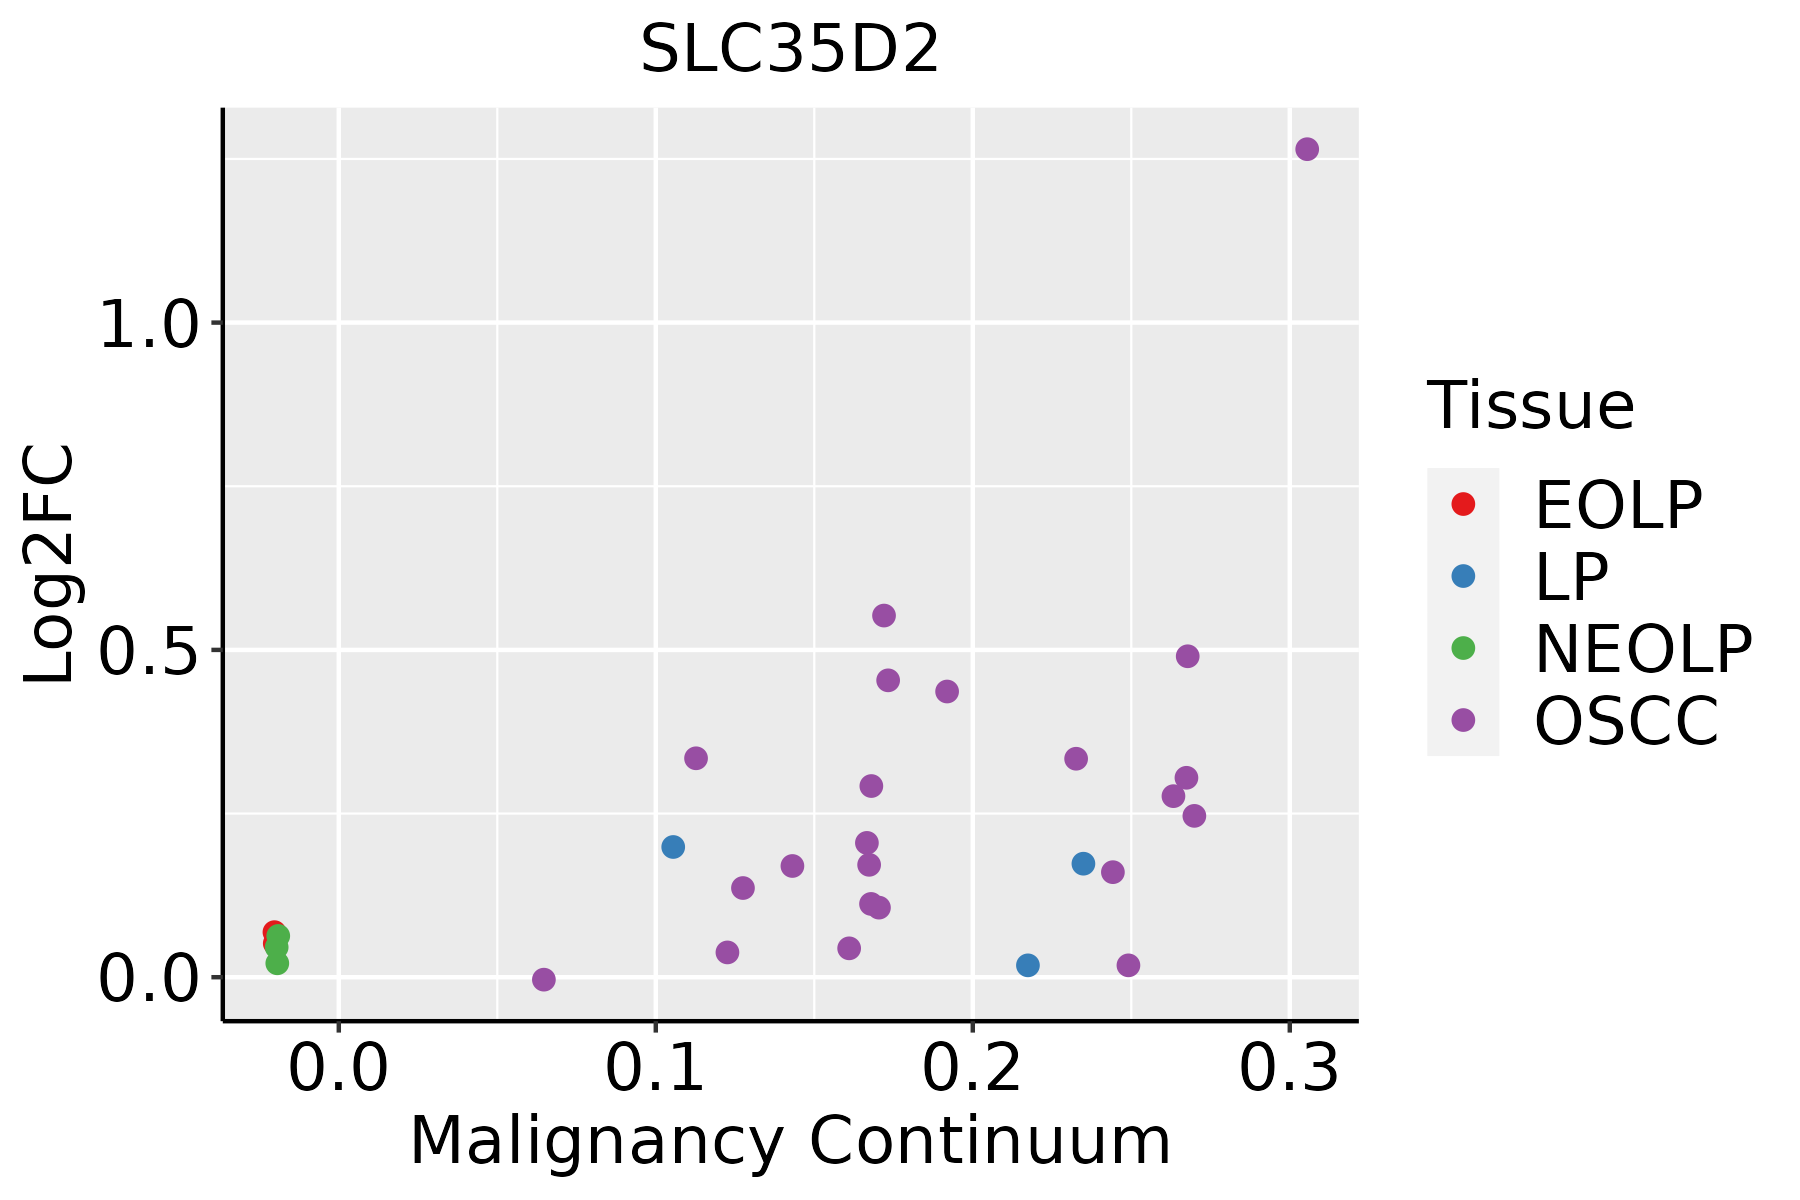 | EOLP: Erosive Oral lichen planus |
| LP: leukoplakia | ||
| NEOLP: Non-erosive oral lichen planus | ||
| OSCC: Oral squamous cell carcinoma | ||
| Thyroid | 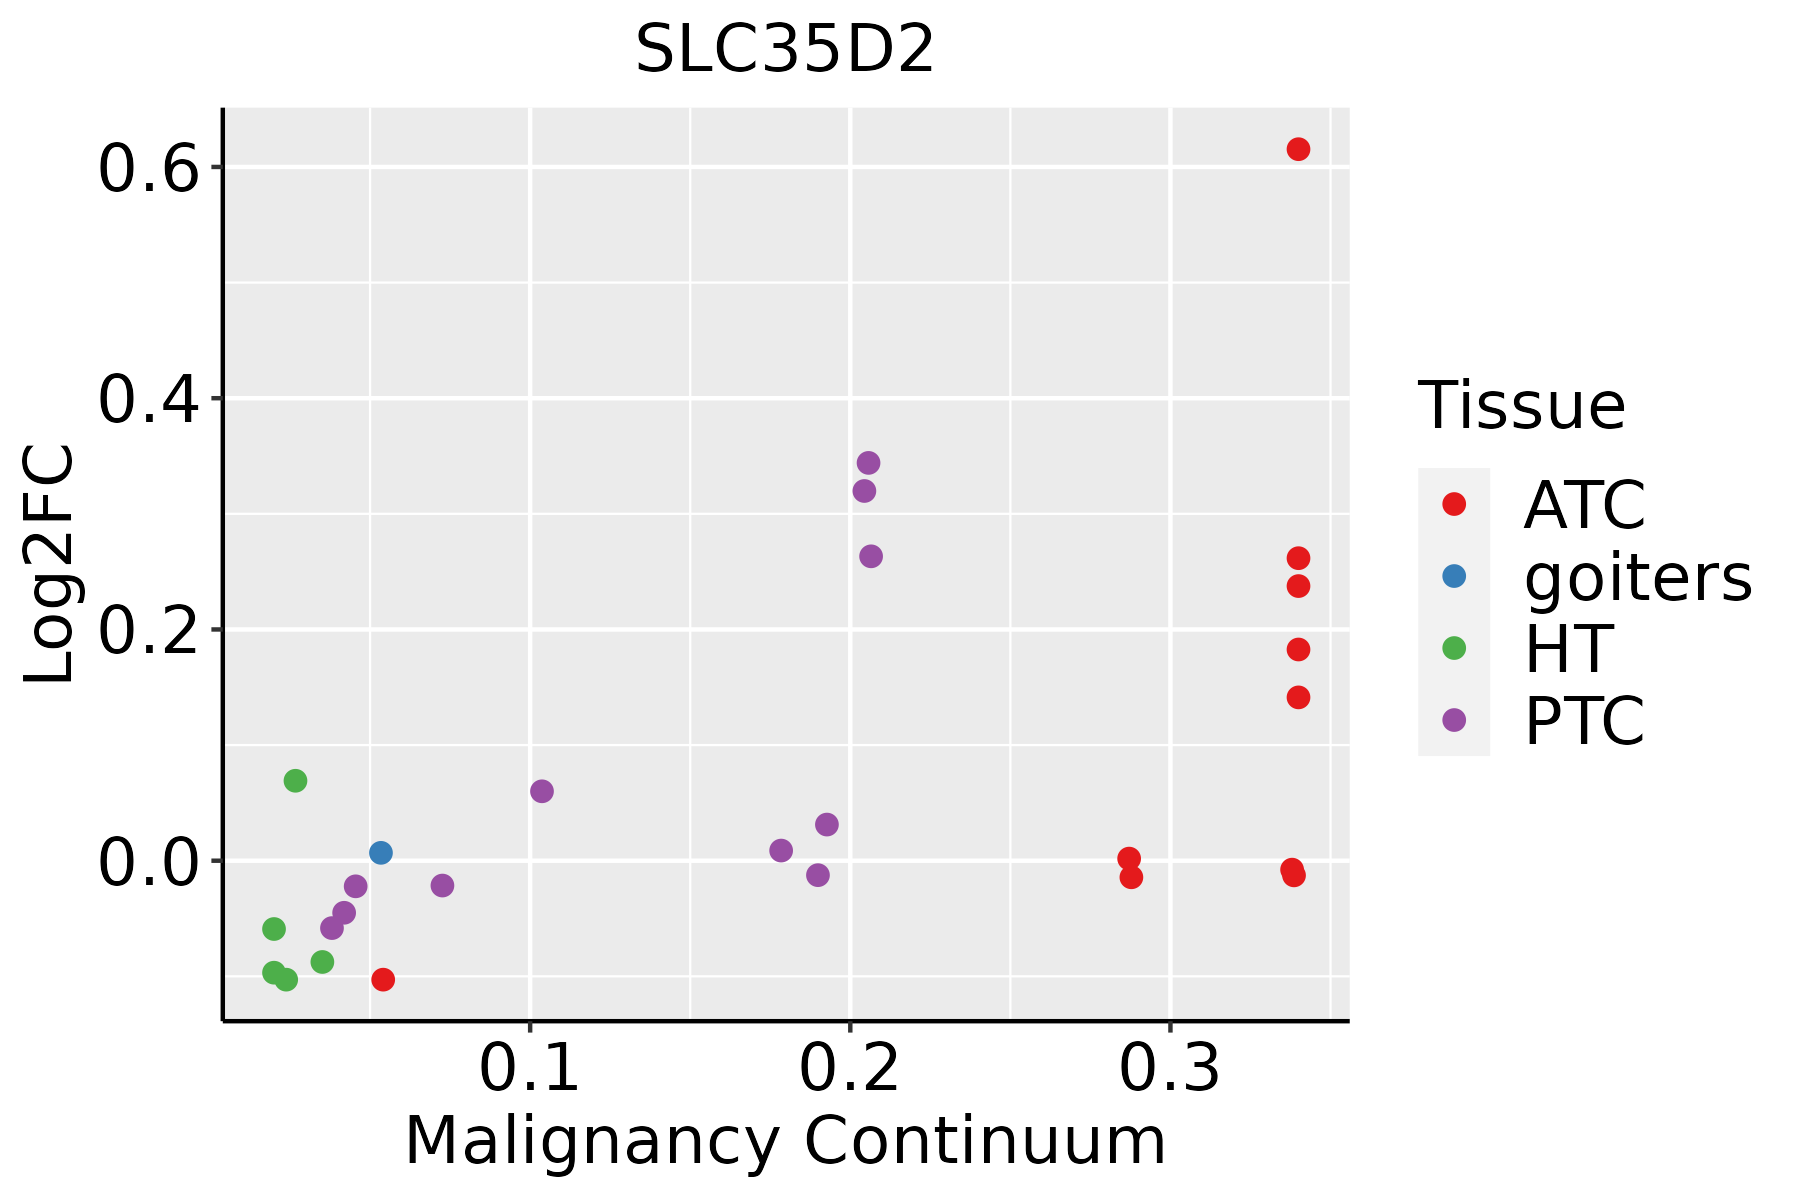 | ATC: Anaplastic thyroid cancer |
| HT: Hashimoto's thyroiditis | ||
| PTC: Papillary thyroid cancer |
| ∗log2FC in expression of this searched gene in stem-like cells from each diseased tissue sample relative to stem-like cells in normal samples in each tissue plotted against the malignancy continuum. Samples are colored based on if they are from different disease stage. |
Top |
Malignant transformation related pathway analysis |
| Find out the enriched GO biological processes and KEGG pathways involved in transition from healthy to precancer to cancer |
| Tissue | Disease Stage | Enriched GO biological Processes |
| Colorectum | AD |  |
| Colorectum | SER |  |
| Colorectum | MSS |  |
| Colorectum | MSI-H |  |
| Colorectum | FAP |  |
| ∗Top 15 enriched GO BP terms are showed in the bar plot of each disease state in each tissue. Each row represents a significant GO biological process which is colored according to the -log10(p.adjust). |
| Page: 1 2 3 4 5 6 7 8 9 |
| GO ID | Tissue | Disease Stage | Description | Gene Ratio | Bg Ratio | pvalue | p.adjust | Count |
| GO:0015931 | Colorectum | AD | nucleobase-containing compound transport | 73/3918 | 222/18723 | 2.02e-05 | 4.10e-04 | 73 |
| GO:0006790 | Colorectum | AD | sulfur compound metabolic process | 101/3918 | 339/18723 | 6.46e-05 | 1.07e-03 | 101 |
| GO:00159311 | Colorectum | SER | nucleobase-containing compound transport | 54/2897 | 222/18723 | 3.65e-04 | 5.67e-03 | 54 |
| GO:00067901 | Colorectum | SER | sulfur compound metabolic process | 73/2897 | 339/18723 | 1.75e-03 | 1.81e-02 | 73 |
| GO:00159312 | Colorectum | MSS | nucleobase-containing compound transport | 70/3467 | 222/18723 | 1.92e-06 | 6.01e-05 | 70 |
| GO:00067902 | Colorectum | MSS | sulfur compound metabolic process | 85/3467 | 339/18723 | 1.52e-03 | 1.39e-02 | 85 |
| GO:00159313 | Colorectum | MSI-H | nucleobase-containing compound transport | 30/1319 | 222/18723 | 4.45e-04 | 9.50e-03 | 30 |
| GO:00159314 | Colorectum | FAP | nucleobase-containing compound transport | 45/2622 | 222/18723 | 6.22e-03 | 3.90e-02 | 45 |
| GO:000679011 | Liver | Cirrhotic | sulfur compound metabolic process | 129/4634 | 339/18723 | 3.06e-08 | 1.04e-06 | 129 |
| GO:00159316 | Liver | Cirrhotic | nucleobase-containing compound transport | 87/4634 | 222/18723 | 1.25e-06 | 2.52e-05 | 87 |
| GO:00442721 | Liver | Cirrhotic | sulfur compound biosynthetic process | 58/4634 | 148/18723 | 6.93e-05 | 7.83e-04 | 58 |
| GO:001593111 | Liver | HCC | nucleobase-containing compound transport | 150/7958 | 222/18723 | 3.17e-14 | 2.03e-12 | 150 |
| GO:000679021 | Liver | HCC | sulfur compound metabolic process | 212/7958 | 339/18723 | 5.60e-14 | 3.39e-12 | 212 |
| GO:00442722 | Liver | HCC | sulfur compound biosynthetic process | 95/7958 | 148/18723 | 7.89e-08 | 1.58e-06 | 95 |
| GO:1901264 | Liver | HCC | carbohydrate derivative transport | 48/7958 | 80/18723 | 1.19e-03 | 6.62e-03 | 48 |
| GO:0008643 | Liver | HCC | carbohydrate transport | 80/7958 | 152/18723 | 7.34e-03 | 2.92e-02 | 80 |
| GO:001593114 | Oral cavity | OSCC | nucleobase-containing compound transport | 150/7305 | 222/18723 | 4.86e-18 | 5.04e-16 | 150 |
| GO:00442724 | Oral cavity | OSCC | sulfur compound biosynthetic process | 82/7305 | 148/18723 | 3.71e-05 | 3.31e-04 | 82 |
| GO:00067905 | Oral cavity | OSCC | sulfur compound metabolic process | 168/7305 | 339/18723 | 4.50e-05 | 3.84e-04 | 168 |
| GO:19012642 | Oral cavity | OSCC | carbohydrate derivative transport | 44/7305 | 80/18723 | 2.67e-03 | 1.16e-02 | 44 |
| Page: 1 2 |
| Pathway ID | Tissue | Disease Stage | Description | Gene Ratio | Bg Ratio | pvalue | p.adjust | qvalue | Count |
| Page: 1 |
Top |
Cell-cell communication analysis |
| Identification of potential cell-cell interactions between two cell types and their ligand-receptor pairs for different disease states |
| Ligand | Receptor | LRpair | Pathway | Tissue | Disease Stage |
| Page: 1 |
Top |
Single-cell gene regulatory network inference analysis |
| Find out the significant the regulons (TFs) and the target genes of each regulon across cell types for different disease states |
| TF | Cell Type | Tissue | Disease Stage | Target Gene | RSS | Regulon Activity |
| ∗The dot plots of a searched regulon are shown for all cell subpopulations in each disease state of each tissue based on the regulon specific score inferred using pySCENIC and by calculating the average expression. |
| Page: 1 |
Top |
Somatic mutation of malignant transformation related genes |
| Annotation of somatic variants for genes involved in malignant transformation |
| Hugo Symbol | Variant Class | Variant Classification | dbSNP RS | HGVSc | HGVSp | HGVSp Short | SWISSPROT | BIOTYPE | SIFT | PolyPhen | Tumor Sample Barcode | Tissue | Histology | Sex | Age | Stage | Therapy Types | Drugs | Outcome |
| SLC35D2 | SNV | Missense_Mutation | novel | c.576G>C | p.Gln192His | p.Q192H | Q76EJ3 | protein_coding | deleterious(0) | benign(0.326) | TCGA-AR-A2LE-01 | Breast | breast invasive carcinoma | Female | >=65 | I/II | Hormone Therapy | tamoxiphen | PD |
| SLC35D2 | insertion | In_Frame_Ins | novel | c.351_352insATAGGTTCTCACAATGTTTCCCAAGCTTAT | p.Leu117_Pro118insIleGlySerHisAsnValSerGlnAlaTyr | p.L117_P118insIGSHNVSQAY | Q76EJ3 | protein_coding | TCGA-A2-A0EY-01 | Breast | breast invasive carcinoma | Female | <65 | I/II | Chemotherapy | adriamycin | SD | ||
| SLC35D2 | SNV | Missense_Mutation | novel | c.944N>C | p.Leu315Ser | p.L315S | Q76EJ3 | protein_coding | deleterious(0.03) | benign(0.017) | TCGA-VS-A959-01 | Cervix | cervical & endocervical cancer | Female | >=65 | I/II | Unknown | Unknown | SD |
| SLC35D2 | SNV | Missense_Mutation | novel | c.493G>C | p.Asp165His | p.D165H | Q76EJ3 | protein_coding | deleterious(0) | probably_damaging(0.912) | TCGA-ZJ-AAXU-01 | Cervix | cervical & endocervical cancer | Female | <65 | I/II | Unknown | Unknown | SD |
| SLC35D2 | SNV | Missense_Mutation | c.932G>T | p.Arg311Ile | p.R311I | Q76EJ3 | protein_coding | tolerated(0.26) | benign(0.017) | TCGA-AA-A00N-01 | Colorectum | colon adenocarcinoma | Male | >=65 | I/II | Unknown | Unknown | PD | |
| SLC35D2 | SNV | Missense_Mutation | c.800C>T | p.Ala267Val | p.A267V | Q76EJ3 | protein_coding | deleterious(0) | probably_damaging(0.978) | TCGA-G4-6588-01 | Colorectum | colon adenocarcinoma | Female | <65 | I/II | Unknown | Unknown | SD | |
| SLC35D2 | SNV | Missense_Mutation | c.484G>C | p.Ala162Pro | p.A162P | Q76EJ3 | protein_coding | deleterious(0.02) | possibly_damaging(0.883) | TCGA-AF-A56L-01 | Colorectum | rectum adenocarcinoma | Female | <65 | III/IV | Chemotherapy | oxaliplatin | CR | |
| SLC35D2 | SNV | Missense_Mutation | c.901N>A | p.Gly301Arg | p.G301R | Q76EJ3 | protein_coding | deleterious(0) | probably_damaging(1) | TCGA-AG-3901-01 | Colorectum | rectum adenocarcinoma | Female | >=65 | III/IV | Unknown | Unknown | SD | |
| SLC35D2 | SNV | Missense_Mutation | novel | c.858N>G | p.Ile286Met | p.I286M | Q76EJ3 | protein_coding | tolerated(1) | benign(0.003) | TCGA-A5-A0G2-01 | Endometrium | uterine corpus endometrioid carcinoma | Female | <65 | III/IV | Unknown | Unknown | SD |
| SLC35D2 | SNV | Missense_Mutation | c.932N>T | p.Arg311Ile | p.R311I | Q76EJ3 | protein_coding | tolerated(0.26) | benign(0.017) | TCGA-AX-A2HC-01 | Endometrium | uterine corpus endometrioid carcinoma | Female | <65 | III/IV | Chemotherapy | paclitaxel | PD |
| Page: 1 2 3 |
Top |
Related drugs of malignant transformation related genes |
| Identification of chemicals and drugs interact with genes involved in malignant transfromation |
| (DGIdb 4.0) |
| Entrez ID | Symbol | Category | Interaction Types | Drug Claim Name | Drug Name | PMIDs |
| Page: 1 |

Copyright 2023-Present -The University of Texas Health Science Center at Houston |