
|
|||||
|
 | |
| |
| |
| |
| |
| |
|
Gene: SLC35D1 |
Gene summary for SLC35D1 |
| Gene information | Species | Human | Gene symbol | SLC35D1 | Gene ID | 23169 |
| Gene name | solute carrier family 35 member D1 | |
| Gene Alias | SHNKND | |
| Cytomap | 1p31.3 | |
| Gene Type | protein-coding | GO ID | GO:0006810 | UniProtAcc | Q9NTN3 |
Top |
Malignant transformation analysis |
| Identification of the aberrant gene expression in precancerous and cancerous lesions by comparing the gene expression of stem-like cells in diseased tissues with normal stem cells |
| Entrez ID | Symbol | Replicates | Species | Organ | Tissue | Adj P-value | Log2FC | Malignancy |
| 23169 | SLC35D1 | HTA11_3410_2000001011 | Human | Colorectum | AD | 7.85e-15 | -5.56e-01 | 0.0155 |
| 23169 | SLC35D1 | HTA11_3361_2000001011 | Human | Colorectum | AD | 3.93e-03 | -4.28e-01 | -0.1207 |
| 23169 | SLC35D1 | HTA11_866_2000001011 | Human | Colorectum | AD | 6.00e-07 | -3.88e-01 | -0.1001 |
| 23169 | SLC35D1 | HTA11_866_3004761011 | Human | Colorectum | AD | 8.64e-11 | -5.44e-01 | 0.096 |
| 23169 | SLC35D1 | HTA11_7696_3000711011 | Human | Colorectum | AD | 6.22e-09 | -4.12e-01 | 0.0674 |
| 23169 | SLC35D1 | HTA11_99999970781_79442 | Human | Colorectum | MSS | 2.30e-13 | -4.76e-01 | 0.294 |
| 23169 | SLC35D1 | HTA11_99999965104_69814 | Human | Colorectum | MSS | 1.74e-03 | -4.61e-01 | 0.281 |
| 23169 | SLC35D1 | HTA11_99999971662_82457 | Human | Colorectum | MSS | 7.86e-03 | -3.30e-01 | 0.3859 |
| 23169 | SLC35D1 | HTA11_99999973899_84307 | Human | Colorectum | MSS | 1.53e-08 | -6.58e-01 | 0.2585 |
| 23169 | SLC35D1 | HTA11_99999974143_84620 | Human | Colorectum | MSS | 2.40e-17 | -5.16e-01 | 0.3005 |
| 23169 | SLC35D1 | A002-C-010 | Human | Colorectum | FAP | 9.51e-03 | -2.09e-01 | 0.242 |
| 23169 | SLC35D1 | A015-C-203 | Human | Colorectum | FAP | 1.45e-27 | -4.30e-01 | -0.1294 |
| 23169 | SLC35D1 | A015-C-204 | Human | Colorectum | FAP | 8.13e-07 | -2.76e-01 | -0.0228 |
| 23169 | SLC35D1 | A014-C-040 | Human | Colorectum | FAP | 8.77e-03 | -3.18e-01 | -0.1184 |
| 23169 | SLC35D1 | A002-C-201 | Human | Colorectum | FAP | 7.56e-13 | -3.44e-01 | 0.0324 |
| 23169 | SLC35D1 | A002-C-203 | Human | Colorectum | FAP | 7.03e-05 | -1.39e-01 | 0.2786 |
| 23169 | SLC35D1 | A001-C-119 | Human | Colorectum | FAP | 8.40e-12 | -5.11e-01 | -0.1557 |
| 23169 | SLC35D1 | A001-C-108 | Human | Colorectum | FAP | 6.57e-16 | -2.93e-01 | -0.0272 |
| 23169 | SLC35D1 | A002-C-205 | Human | Colorectum | FAP | 1.32e-21 | -4.62e-01 | -0.1236 |
| 23169 | SLC35D1 | A001-C-104 | Human | Colorectum | FAP | 3.59e-03 | -2.18e-01 | 0.0184 |
| Page: 1 2 3 |
| Tissue | Expression Dynamics | Abbreviation |
| Colorectum (GSE201348) | 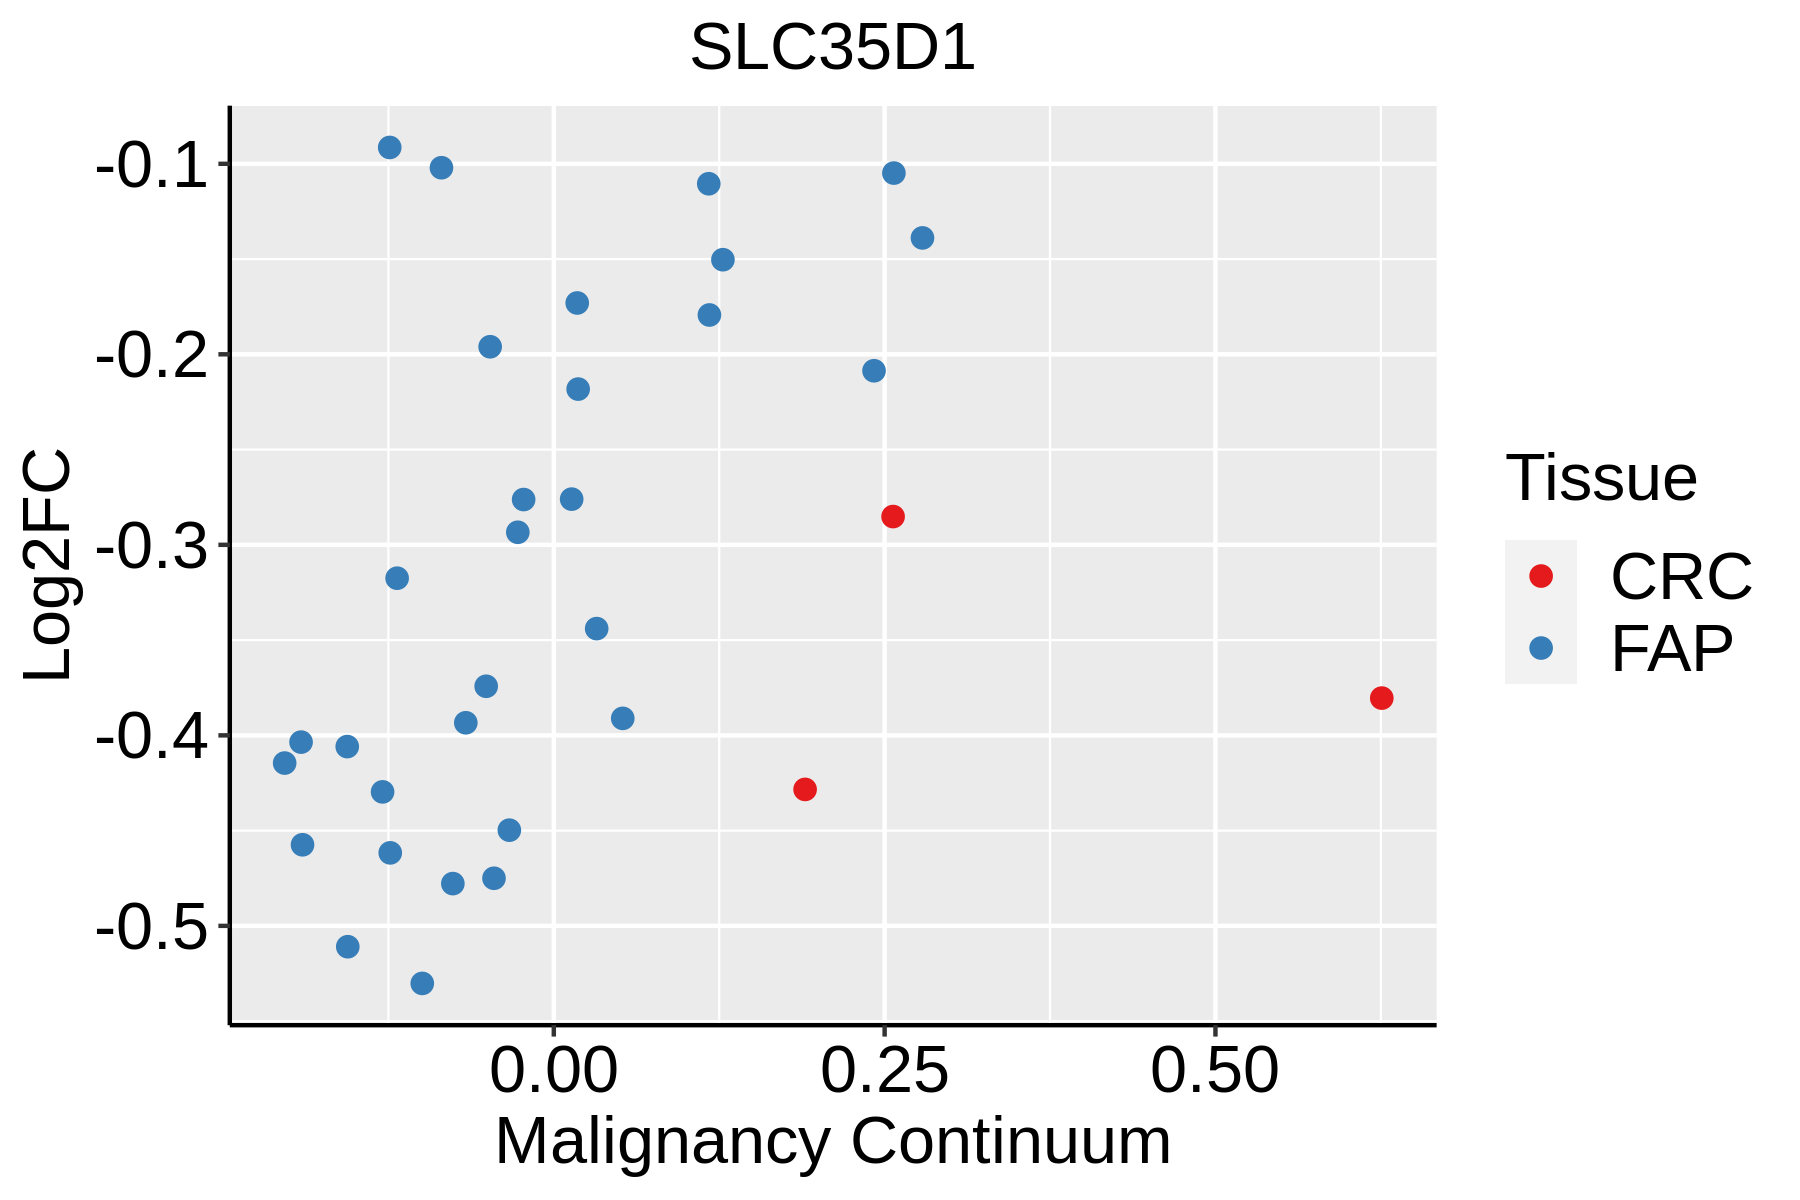 | FAP: Familial adenomatous polyposis |
| CRC: Colorectal cancer | ||
| Colorectum (HTA11) |  | AD: Adenomas |
| SER: Sessile serrated lesions | ||
| MSI-H: Microsatellite-high colorectal cancer | ||
| MSS: Microsatellite stable colorectal cancer | ||
| Liver | 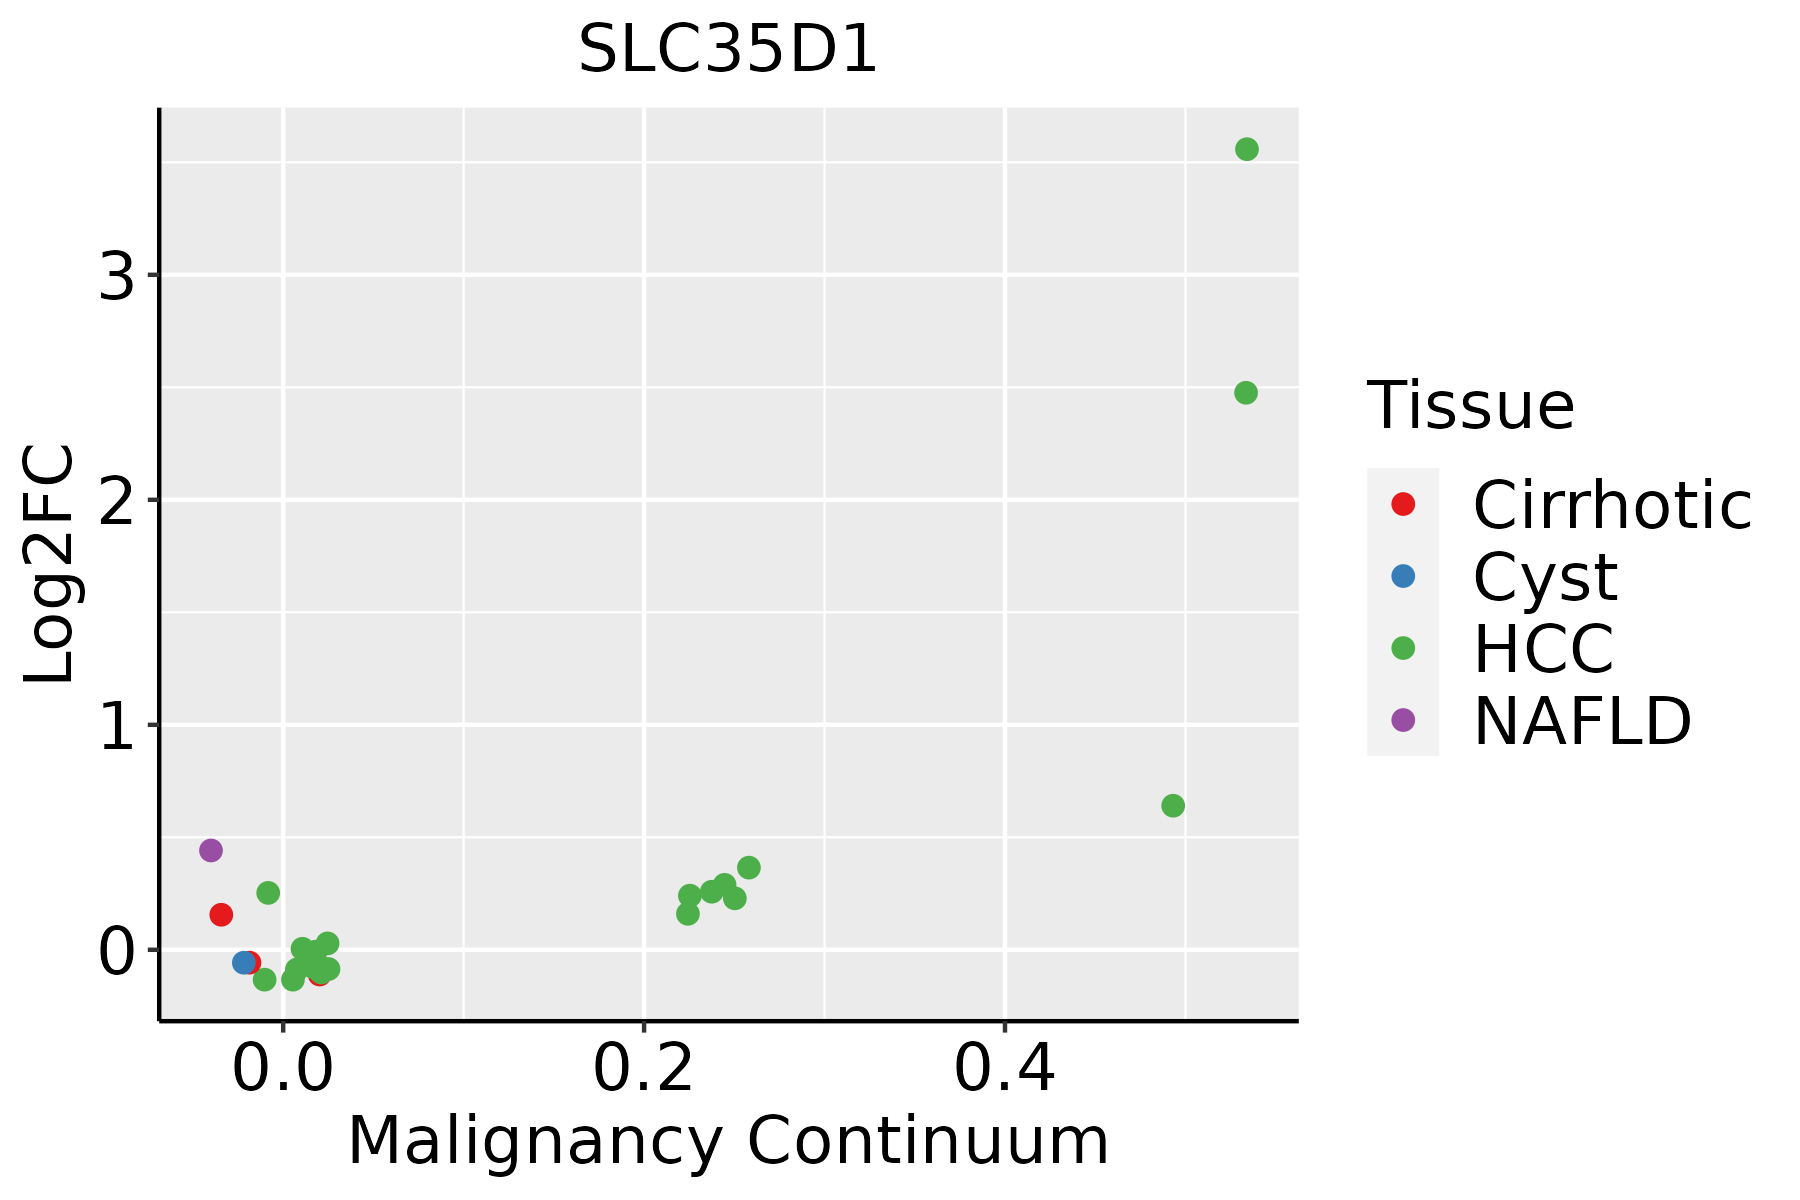 | HCC: Hepatocellular carcinoma |
| NAFLD: Non-alcoholic fatty liver disease |
| ∗log2FC in expression of this searched gene in stem-like cells from each diseased tissue sample relative to stem-like cells in normal samples in each tissue plotted against the malignancy continuum. Samples are colored based on if they are from different disease stage. |
Top |
Malignant transformation related pathway analysis |
| Find out the enriched GO biological processes and KEGG pathways involved in transition from healthy to precancer to cancer |
| Tissue | Disease Stage | Enriched GO biological Processes |
| Colorectum | AD |  |
| Colorectum | SER |  |
| Colorectum | MSS |  |
| Colorectum | MSI-H |  |
| Colorectum | FAP |  |
| ∗Top 15 enriched GO BP terms are showed in the bar plot of each disease state in each tissue. Each row represents a significant GO biological process which is colored according to the -log10(p.adjust). |
| Page: 1 2 3 4 5 6 7 8 9 |
| GO ID | Tissue | Disease Stage | Description | Gene Ratio | Bg Ratio | pvalue | p.adjust | Count |
| GO:0015931 | Colorectum | AD | nucleobase-containing compound transport | 73/3918 | 222/18723 | 2.02e-05 | 4.10e-04 | 73 |
| GO:00159312 | Colorectum | MSS | nucleobase-containing compound transport | 70/3467 | 222/18723 | 1.92e-06 | 6.01e-05 | 70 |
| GO:00159314 | Colorectum | FAP | nucleobase-containing compound transport | 45/2622 | 222/18723 | 6.22e-03 | 3.90e-02 | 45 |
| GO:001593111 | Liver | HCC | nucleobase-containing compound transport | 150/7958 | 222/18723 | 3.17e-14 | 2.03e-12 | 150 |
| GO:1901264 | Liver | HCC | carbohydrate derivative transport | 48/7958 | 80/18723 | 1.19e-03 | 6.62e-03 | 48 |
| GO:0008643 | Liver | HCC | carbohydrate transport | 80/7958 | 152/18723 | 7.34e-03 | 2.92e-02 | 80 |
| Page: 1 |
| Pathway ID | Tissue | Disease Stage | Description | Gene Ratio | Bg Ratio | pvalue | p.adjust | qvalue | Count |
| Page: 1 |
Top |
Cell-cell communication analysis |
| Identification of potential cell-cell interactions between two cell types and their ligand-receptor pairs for different disease states |
| Ligand | Receptor | LRpair | Pathway | Tissue | Disease Stage |
| Page: 1 |
Top |
Single-cell gene regulatory network inference analysis |
| Find out the significant the regulons (TFs) and the target genes of each regulon across cell types for different disease states |
| TF | Cell Type | Tissue | Disease Stage | Target Gene | RSS | Regulon Activity |
| ∗The dot plots of a searched regulon are shown for all cell subpopulations in each disease state of each tissue based on the regulon specific score inferred using pySCENIC and by calculating the average expression. |
| Page: 1 |
Top |
Somatic mutation of malignant transformation related genes |
| Annotation of somatic variants for genes involved in malignant transformation |
| Hugo Symbol | Variant Class | Variant Classification | dbSNP RS | HGVSc | HGVSp | HGVSp Short | SWISSPROT | BIOTYPE | SIFT | PolyPhen | Tumor Sample Barcode | Tissue | Histology | Sex | Age | Stage | Therapy Types | Drugs | Outcome |
| SLC35D1 | SNV | Missense_Mutation | c.689N>G | p.Pro230Arg | p.P230R | Q9NTN3 | protein_coding | deleterious(0) | benign(0.224) | TCGA-E2-A150-01 | Breast | breast invasive carcinoma | Female | <65 | I/II | Chemotherapy | doxorubicin | SD | |
| SLC35D1 | SNV | Missense_Mutation | novel | c.754N>A | p.Asp252Asn | p.D252N | Q9NTN3 | protein_coding | tolerated(0.95) | benign(0.02) | TCGA-IR-A3LH-01 | Cervix | cervical & endocervical cancer | Female | <65 | I/II | Chemotherapy | cisplatin | CR |
| SLC35D1 | SNV | Missense_Mutation | c.632C>T | p.Ser211Leu | p.S211L | Q9NTN3 | protein_coding | tolerated(0.05) | benign(0.213) | TCGA-MY-A5BD-01 | Cervix | cervical & endocervical cancer | Female | <65 | I/II | Chemotherapy | cisplatin | CR | |
| SLC35D1 | SNV | Missense_Mutation | novel | c.718G>A | p.Asp240Asn | p.D240N | Q9NTN3 | protein_coding | deleterious(0.01) | benign(0.279) | TCGA-F5-6814-01 | Colorectum | rectum adenocarcinoma | Male | <65 | I/II | Unknown | Unknown | SD |
| SLC35D1 | SNV | Missense_Mutation | novel | c.17N>A | p.Arg6Lys | p.R6K | Q9NTN3 | protein_coding | tolerated_low_confidence(0.45) | benign(0.017) | TCGA-A5-A0G1-01 | Endometrium | uterine corpus endometrioid carcinoma | Female | >=65 | I/II | Unknown | Unknown | SD |
| SLC35D1 | SNV | Missense_Mutation | c.701N>C | p.Ile234Thr | p.I234T | Q9NTN3 | protein_coding | deleterious(0.02) | benign(0.099) | TCGA-A5-A0VP-01 | Endometrium | uterine corpus endometrioid carcinoma | Female | >=65 | I/II | Unknown | Unknown | SD | |
| SLC35D1 | SNV | Missense_Mutation | rs751766785 | c.904G>A | p.Val302Ile | p.V302I | Q9NTN3 | protein_coding | tolerated(0.2) | benign(0.062) | TCGA-AP-A051-01 | Endometrium | uterine corpus endometrioid carcinoma | Female | >=65 | I/II | Unknown | Unknown | SD |
| SLC35D1 | SNV | Missense_Mutation | c.1003G>A | p.Glu335Lys | p.E335K | Q9NTN3 | protein_coding | tolerated(0.87) | benign(0.003) | TCGA-AP-A056-01 | Endometrium | uterine corpus endometrioid carcinoma | Female | <65 | I/II | Unknown | Unknown | SD | |
| SLC35D1 | SNV | Missense_Mutation | c.550N>A | p.Asp184Asn | p.D184N | Q9NTN3 | protein_coding | tolerated(0.76) | benign(0.07) | TCGA-AP-A0LM-01 | Endometrium | uterine corpus endometrioid carcinoma | Female | <65 | III/IV | Chemotherapy | cisplatin | SD | |
| SLC35D1 | SNV | Missense_Mutation | rs750542739 | c.583N>A | p.Asp195Asn | p.D195N | Q9NTN3 | protein_coding | tolerated(0.35) | benign(0.02) | TCGA-BS-A0UV-01 | Endometrium | uterine corpus endometrioid carcinoma | Female | <65 | III/IV | Unknown | Unknown | SD |
| Page: 1 2 3 |
Top |
Related drugs of malignant transformation related genes |
| Identification of chemicals and drugs interact with genes involved in malignant transfromation |
| (DGIdb 4.0) |
| Entrez ID | Symbol | Category | Interaction Types | Drug Claim Name | Drug Name | PMIDs |
| Page: 1 |

Copyright 2023-Present -The University of Texas Health Science Center at Houston |