
|
|||||
|
 | |
| |
| |
| |
| |
| |
|
Gene: SLC35B4 |
Gene summary for SLC35B4 |
| Gene information | Species | Human | Gene symbol | SLC35B4 | Gene ID | 84912 |
| Gene name | solute carrier family 35 member B4 | |
| Gene Alias | YEA | |
| Cytomap | 7q33 | |
| Gene Type | protein-coding | GO ID | GO:0005975 | UniProtAcc | Q969S0 |
Top |
Malignant transformation analysis |
| Identification of the aberrant gene expression in precancerous and cancerous lesions by comparing the gene expression of stem-like cells in diseased tissues with normal stem cells |
| Entrez ID | Symbol | Replicates | Species | Organ | Tissue | Adj P-value | Log2FC | Malignancy |
| 84912 | SLC35B4 | HCC1_Meng | Human | Liver | HCC | 3.01e-49 | 5.34e-02 | 0.0246 |
| 84912 | SLC35B4 | HCC2_Meng | Human | Liver | HCC | 1.66e-09 | -1.75e-02 | 0.0107 |
| 84912 | SLC35B4 | HCC1 | Human | Liver | HCC | 1.64e-02 | 2.21e+00 | 0.5336 |
| 84912 | SLC35B4 | HCC2 | Human | Liver | HCC | 6.09e-17 | 3.29e+00 | 0.5341 |
| 84912 | SLC35B4 | HCC5 | Human | Liver | HCC | 1.62e-03 | 2.12e+00 | 0.4932 |
| 84912 | SLC35B4 | S014 | Human | Liver | HCC | 5.43e-03 | 3.24e-01 | 0.2254 |
| 84912 | SLC35B4 | S015 | Human | Liver | HCC | 3.73e-05 | 4.30e-01 | 0.2375 |
| 84912 | SLC35B4 | S016 | Human | Liver | HCC | 4.42e-05 | 3.23e-01 | 0.2243 |
| 84912 | SLC35B4 | S028 | Human | Liver | HCC | 2.53e-09 | 5.32e-01 | 0.2503 |
| 84912 | SLC35B4 | S029 | Human | Liver | HCC | 2.37e-02 | 3.58e-01 | 0.2581 |
| 84912 | SLC35B4 | male-WTA | Human | Thyroid | PTC | 4.50e-05 | 4.80e-02 | 0.1037 |
| 84912 | SLC35B4 | PTC01 | Human | Thyroid | PTC | 2.74e-05 | 8.45e-02 | 0.1899 |
| 84912 | SLC35B4 | PTC05 | Human | Thyroid | PTC | 9.52e-04 | 1.83e-01 | 0.2065 |
| 84912 | SLC35B4 | PTC06 | Human | Thyroid | PTC | 1.97e-05 | 1.35e-01 | 0.2057 |
| 84912 | SLC35B4 | PTC07 | Human | Thyroid | PTC | 2.88e-06 | 1.37e-01 | 0.2044 |
| 84912 | SLC35B4 | ATC09 | Human | Thyroid | ATC | 2.26e-06 | 2.17e-01 | 0.2871 |
| 84912 | SLC35B4 | ATC11 | Human | Thyroid | ATC | 7.49e-03 | 2.68e-01 | 0.3386 |
| 84912 | SLC35B4 | ATC12 | Human | Thyroid | ATC | 7.47e-18 | 4.24e-01 | 0.34 |
| 84912 | SLC35B4 | ATC13 | Human | Thyroid | ATC | 2.34e-20 | 3.64e-01 | 0.34 |
| 84912 | SLC35B4 | ATC1 | Human | Thyroid | ATC | 2.63e-07 | 2.56e-01 | 0.2878 |
| Page: 1 2 |
| Tissue | Expression Dynamics | Abbreviation |
| Liver | 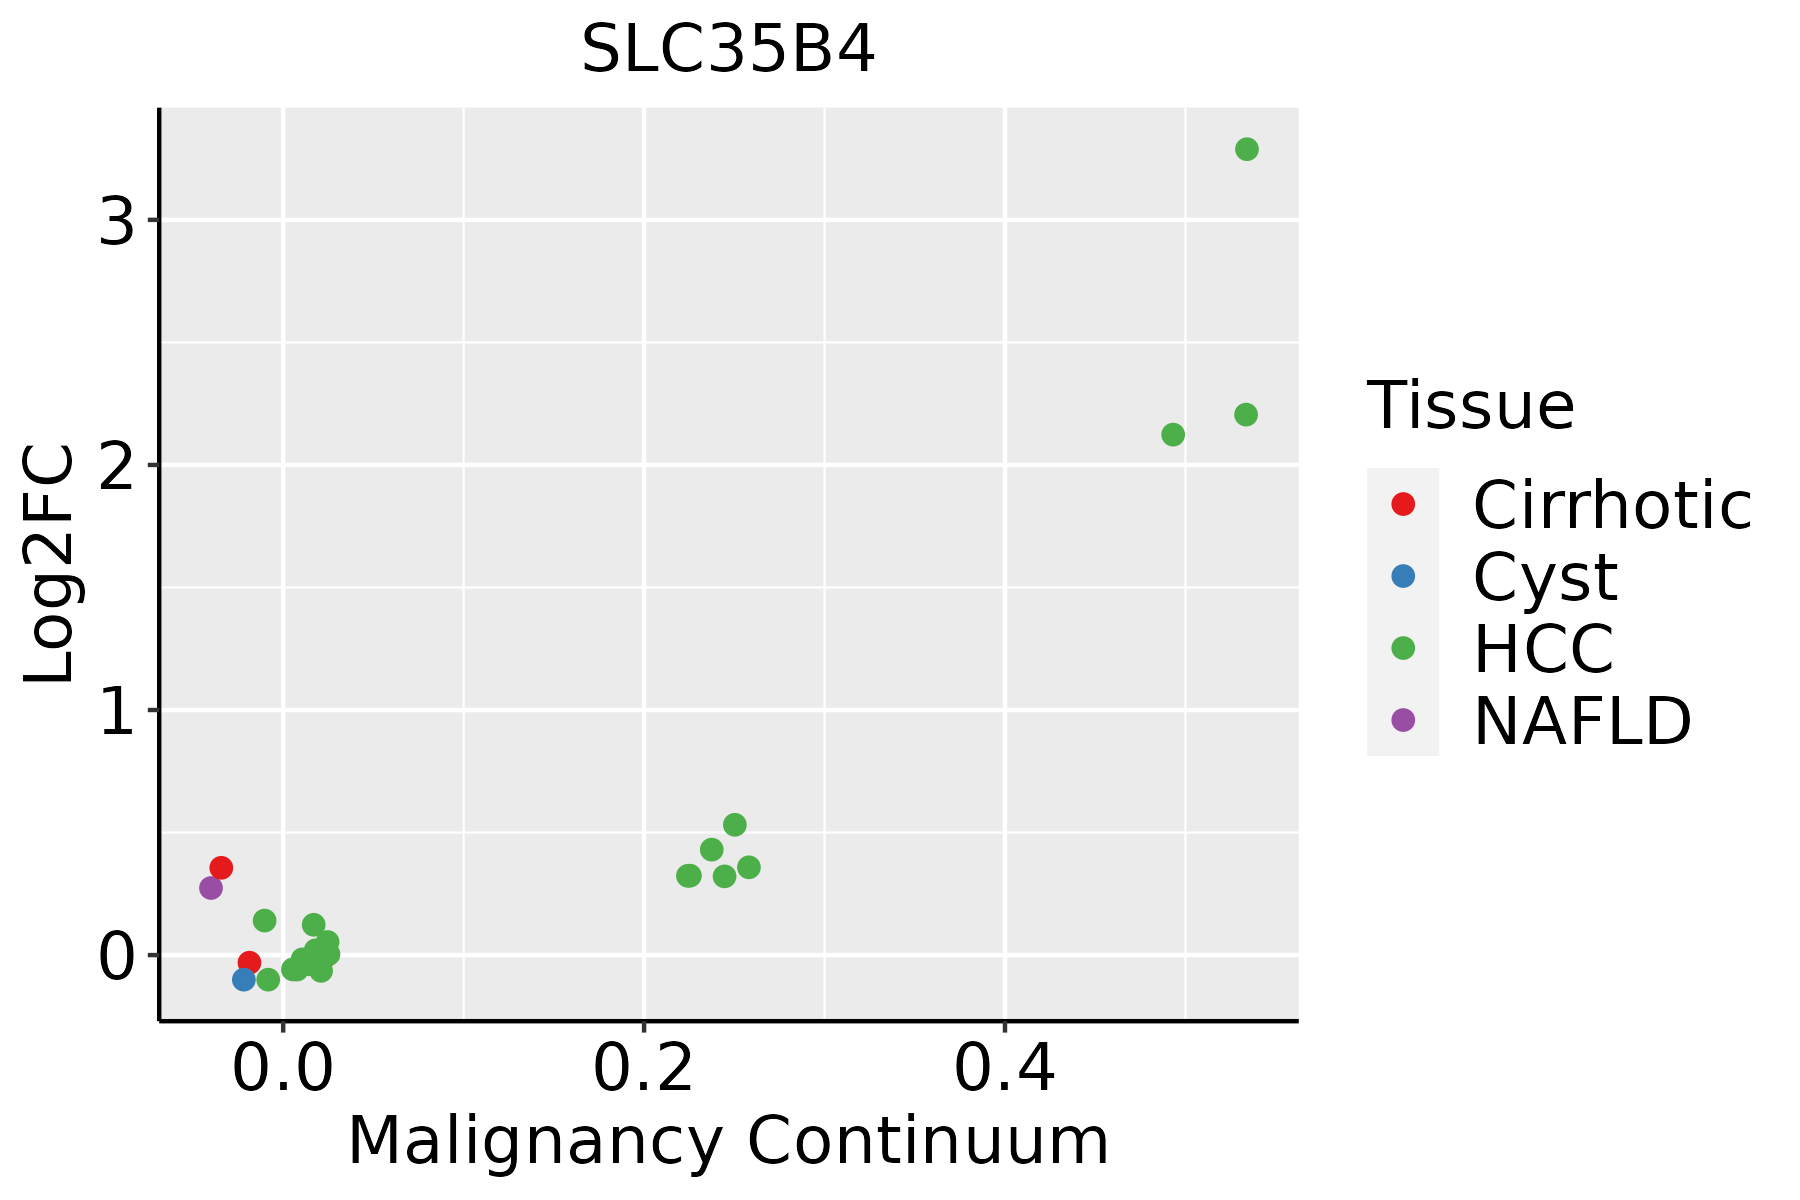 | HCC: Hepatocellular carcinoma |
| NAFLD: Non-alcoholic fatty liver disease | ||
| Thyroid | 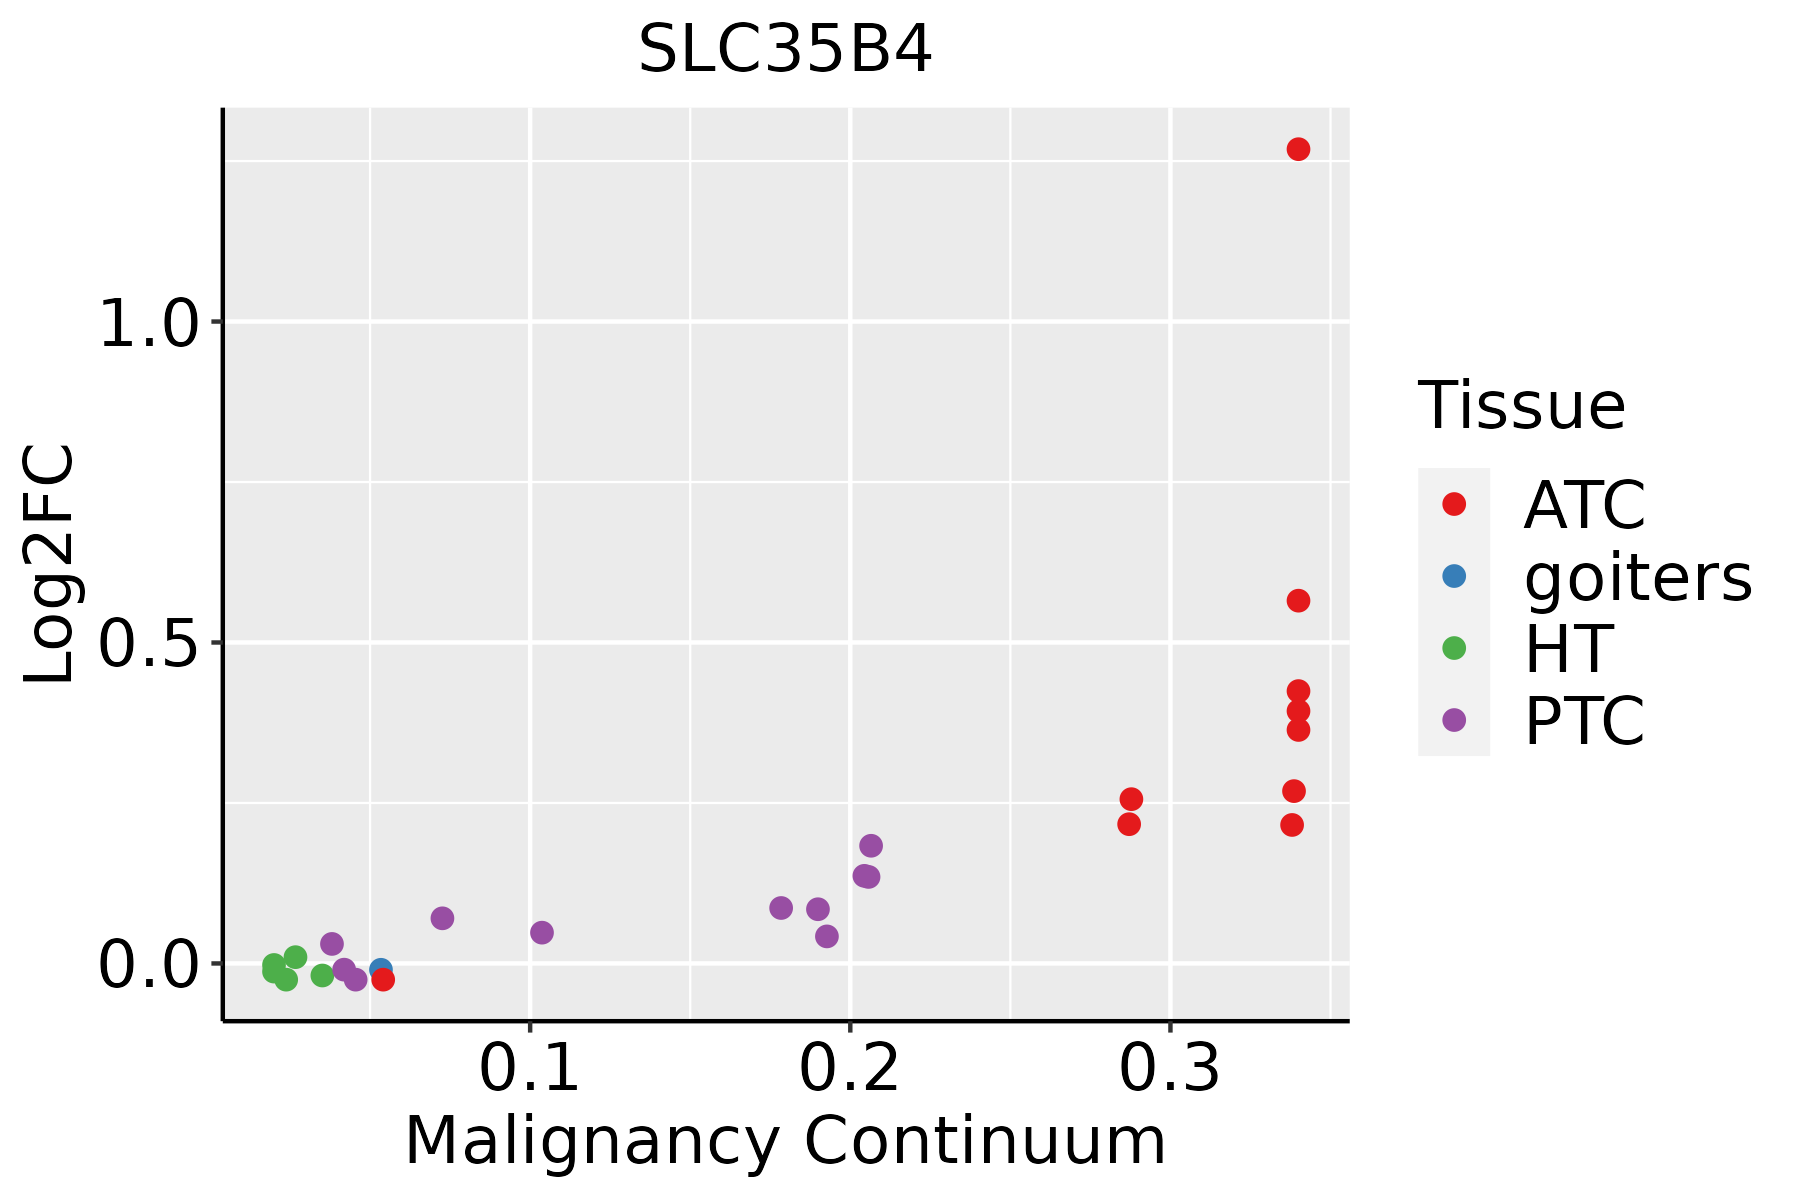 | ATC: Anaplastic thyroid cancer |
| HT: Hashimoto's thyroiditis | ||
| PTC: Papillary thyroid cancer |
| ∗log2FC in expression of this searched gene in stem-like cells from each diseased tissue sample relative to stem-like cells in normal samples in each tissue plotted against the malignancy continuum. Samples are colored based on if they are from different disease stage. |
Top |
Malignant transformation related pathway analysis |
| Find out the enriched GO biological processes and KEGG pathways involved in transition from healthy to precancer to cancer |
| Tissue | Disease Stage | Enriched GO biological Processes |
| Colorectum | AD |  |
| Colorectum | SER |  |
| Colorectum | MSS |  |
| Colorectum | MSI-H |  |
| Colorectum | FAP |  |
| ∗Top 15 enriched GO BP terms are showed in the bar plot of each disease state in each tissue. Each row represents a significant GO biological process which is colored according to the -log10(p.adjust). |
| Page: 1 2 3 4 5 6 7 8 9 |
| GO ID | Tissue | Disease Stage | Description | Gene Ratio | Bg Ratio | pvalue | p.adjust | Count |
| GO:001593111 | Liver | HCC | nucleobase-containing compound transport | 150/7958 | 222/18723 | 3.17e-14 | 2.03e-12 | 150 |
| GO:000599621 | Liver | HCC | monosaccharide metabolic process | 167/7958 | 257/18723 | 2.31e-13 | 1.25e-11 | 167 |
| GO:001931821 | Liver | HCC | hexose metabolic process | 155/7958 | 237/18723 | 7.63e-13 | 3.90e-11 | 155 |
| GO:000600621 | Liver | HCC | glucose metabolic process | 128/7958 | 196/18723 | 8.60e-11 | 3.06e-09 | 128 |
| GO:006201222 | Liver | HCC | regulation of small molecule metabolic process | 190/7958 | 334/18723 | 6.77e-08 | 1.40e-06 | 190 |
| GO:00463642 | Liver | HCC | monosaccharide biosynthetic process | 58/7958 | 82/18723 | 2.08e-07 | 3.75e-06 | 58 |
| GO:000610921 | Liver | HCC | regulation of carbohydrate metabolic process | 109/7958 | 178/18723 | 3.36e-07 | 5.78e-06 | 109 |
| GO:00193192 | Liver | HCC | hexose biosynthetic process | 54/7958 | 78/18723 | 1.61e-06 | 2.27e-05 | 54 |
| GO:00109062 | Liver | HCC | regulation of glucose metabolic process | 76/7958 | 119/18723 | 2.03e-06 | 2.79e-05 | 76 |
| GO:00060942 | Liver | HCC | gluconeogenesis | 52/7958 | 75/18723 | 2.34e-06 | 3.14e-05 | 52 |
| GO:00106752 | Liver | HCC | regulation of cellular carbohydrate metabolic process | 88/7958 | 146/18723 | 1.08e-05 | 1.24e-04 | 88 |
| GO:004426221 | Liver | HCC | cellular carbohydrate metabolic process | 153/7958 | 283/18723 | 5.27e-05 | 5.00e-04 | 153 |
| GO:00160512 | Liver | HCC | carbohydrate biosynthetic process | 113/7958 | 202/18723 | 7.64e-05 | 6.83e-04 | 113 |
| GO:1901264 | Liver | HCC | carbohydrate derivative transport | 48/7958 | 80/18723 | 1.19e-03 | 6.62e-03 | 48 |
| GO:00061111 | Liver | HCC | regulation of gluconeogenesis | 31/7958 | 48/18723 | 1.66e-03 | 8.71e-03 | 31 |
| GO:00432551 | Liver | HCC | regulation of carbohydrate biosynthetic process | 56/7958 | 97/18723 | 1.75e-03 | 9.11e-03 | 56 |
| GO:0008643 | Liver | HCC | carbohydrate transport | 80/7958 | 152/18723 | 7.34e-03 | 2.92e-02 | 80 |
| GO:0015931110 | Thyroid | PTC | nucleobase-containing compound transport | 120/5968 | 222/18723 | 5.45e-12 | 2.35e-10 | 120 |
| GO:001931810 | Thyroid | PTC | hexose metabolic process | 108/5968 | 237/18723 | 6.42e-06 | 7.65e-05 | 108 |
| GO:000599614 | Thyroid | PTC | monosaccharide metabolic process | 115/5968 | 257/18723 | 9.36e-06 | 1.05e-04 | 115 |
| Page: 1 2 |
| Pathway ID | Tissue | Disease Stage | Description | Gene Ratio | Bg Ratio | pvalue | p.adjust | qvalue | Count |
| Page: 1 |
Top |
Cell-cell communication analysis |
| Identification of potential cell-cell interactions between two cell types and their ligand-receptor pairs for different disease states |
| Ligand | Receptor | LRpair | Pathway | Tissue | Disease Stage |
| Page: 1 |
Top |
Single-cell gene regulatory network inference analysis |
| Find out the significant the regulons (TFs) and the target genes of each regulon across cell types for different disease states |
| TF | Cell Type | Tissue | Disease Stage | Target Gene | RSS | Regulon Activity |
| ∗The dot plots of a searched regulon are shown for all cell subpopulations in each disease state of each tissue based on the regulon specific score inferred using pySCENIC and by calculating the average expression. |
| Page: 1 |
Top |
Somatic mutation of malignant transformation related genes |
| Annotation of somatic variants for genes involved in malignant transformation |
| Hugo Symbol | Variant Class | Variant Classification | dbSNP RS | HGVSc | HGVSp | HGVSp Short | SWISSPROT | BIOTYPE | SIFT | PolyPhen | Tumor Sample Barcode | Tissue | Histology | Sex | Age | Stage | Therapy Types | Drugs | Outcome |
| SLC35B4 | SNV | Missense_Mutation | novel | c.450G>T | p.Glu150Asp | p.E150D | Q969S0 | protein_coding | tolerated(0.27) | benign(0.009) | TCGA-AN-A046-01 | Breast | breast invasive carcinoma | Female | >=65 | I/II | Unknown | Unknown | SD |
| SLC35B4 | SNV | Missense_Mutation | c.446N>A | p.Ser149Asn | p.S149N | Q969S0 | protein_coding | tolerated(0.36) | benign(0) | TCGA-AN-A0AM-01 | Breast | breast invasive carcinoma | Female | <65 | I/II | Unknown | Unknown | SD | |
| SLC35B4 | SNV | Missense_Mutation | c.740T>C | p.Ile247Thr | p.I247T | Q969S0 | protein_coding | tolerated(0.06) | benign(0.001) | TCGA-D8-A1XK-01 | Breast | breast invasive carcinoma | Female | <65 | I/II | Chemotherapy | doxorubicine+cyclophosphamide | SD | |
| SLC35B4 | SNV | Missense_Mutation | novel | c.520T>C | p.Ser174Pro | p.S174P | Q969S0 | protein_coding | deleterious(0) | probably_damaging(0.999) | TCGA-2W-A8YY-01 | Cervix | cervical & endocervical cancer | Female | <65 | I/II | Chemotherapy | cisplatin | CR |
| SLC35B4 | SNV | Missense_Mutation | rs762326247 | c.758N>A | p.Cys253Tyr | p.C253Y | Q969S0 | protein_coding | deleterious(0) | probably_damaging(1) | TCGA-A6-2672-01 | Colorectum | colon adenocarcinoma | Female | >=65 | III/IV | Unknown | Unknown | SD |
| SLC35B4 | SNV | Missense_Mutation | rs374056103 | c.697G>A | p.Gly233Arg | p.G233R | Q969S0 | protein_coding | deleterious(0.01) | possibly_damaging(0.5) | TCGA-AA-3984-01 | Colorectum | colon adenocarcinoma | Female | <65 | I/II | Unknown | Unknown | SD |
| SLC35B4 | SNV | Missense_Mutation | novel | c.735G>A | p.Met245Ile | p.M245I | Q969S0 | protein_coding | tolerated(0.48) | benign(0.003) | TCGA-A5-A0G2-01 | Endometrium | uterine corpus endometrioid carcinoma | Female | <65 | III/IV | Unknown | Unknown | SD |
| SLC35B4 | SNV | Missense_Mutation | rs759264873 | c.827G>A | p.Arg276His | p.R276H | Q969S0 | protein_coding | deleterious(0) | probably_damaging(1) | TCGA-AX-A05Z-01 | Endometrium | uterine corpus endometrioid carcinoma | Female | <65 | III/IV | Chemotherapy | adriamycin | SD |
| SLC35B4 | SNV | Missense_Mutation | novel | c.721T>C | p.Phe241Leu | p.F241L | Q969S0 | protein_coding | tolerated(1) | benign(0.001) | TCGA-AX-A063-01 | Endometrium | uterine corpus endometrioid carcinoma | Female | <65 | I/II | Unknown | Unknown | SD |
| SLC35B4 | SNV | Missense_Mutation | novel | c.494N>A | p.Gly165Glu | p.G165E | Q969S0 | protein_coding | deleterious(0.04) | benign(0.157) | TCGA-B5-A3FA-01 | Endometrium | uterine corpus endometrioid carcinoma | Female | >=65 | I/II | Unknown | Unknown | SD |
| Page: 1 2 3 |
Top |
Related drugs of malignant transformation related genes |
| Identification of chemicals and drugs interact with genes involved in malignant transfromation |
| (DGIdb 4.0) |
| Entrez ID | Symbol | Category | Interaction Types | Drug Claim Name | Drug Name | PMIDs |
| Page: 1 |

Copyright 2023-Present -The University of Texas Health Science Center at Houston |