
|
|||||
|
 | |
| |
| |
| |
| |
| |
|
Gene: SLC35B3 |
Gene summary for SLC35B3 |
| Gene information | Species | Human | Gene symbol | SLC35B3 | Gene ID | 51000 |
| Gene name | solute carrier family 35 member B3 | |
| Gene Alias | C6orf196 | |
| Cytomap | 6p24.3 | |
| Gene Type | protein-coding | GO ID | GO:0006082 | UniProtAcc | A0A024R008 |
Top |
Malignant transformation analysis |
| Identification of the aberrant gene expression in precancerous and cancerous lesions by comparing the gene expression of stem-like cells in diseased tissues with normal stem cells |
| Entrez ID | Symbol | Replicates | Species | Organ | Tissue | Adj P-value | Log2FC | Malignancy |
| 51000 | SLC35B3 | LZE4T | Human | Esophagus | ESCC | 6.86e-19 | 6.27e-01 | 0.0811 |
| 51000 | SLC35B3 | LZE5T | Human | Esophagus | ESCC | 4.66e-05 | 3.87e-01 | 0.0514 |
| 51000 | SLC35B3 | LZE7T | Human | Esophagus | ESCC | 7.37e-14 | 5.38e-01 | 0.0667 |
| 51000 | SLC35B3 | LZE8T | Human | Esophagus | ESCC | 3.54e-07 | 1.68e-01 | 0.067 |
| 51000 | SLC35B3 | LZE20T | Human | Esophagus | ESCC | 2.09e-08 | 2.38e-01 | 0.0662 |
| 51000 | SLC35B3 | LZE22D1 | Human | Esophagus | HGIN | 1.02e-02 | 1.09e-01 | 0.0595 |
| 51000 | SLC35B3 | LZE22T | Human | Esophagus | ESCC | 1.21e-02 | 3.87e-01 | 0.068 |
| 51000 | SLC35B3 | LZE24T | Human | Esophagus | ESCC | 4.27e-18 | 5.13e-01 | 0.0596 |
| 51000 | SLC35B3 | LZE21T | Human | Esophagus | ESCC | 1.73e-02 | 2.00e-01 | 0.0655 |
| 51000 | SLC35B3 | LZE6T | Human | Esophagus | ESCC | 7.99e-04 | 1.66e-01 | 0.0845 |
| 51000 | SLC35B3 | P2T-E | Human | Esophagus | ESCC | 4.96e-13 | 2.78e-01 | 0.1177 |
| 51000 | SLC35B3 | P4T-E | Human | Esophagus | ESCC | 2.17e-13 | 1.29e-01 | 0.1323 |
| 51000 | SLC35B3 | P5T-E | Human | Esophagus | ESCC | 1.02e-02 | 3.63e-02 | 0.1327 |
| 51000 | SLC35B3 | P8T-E | Human | Esophagus | ESCC | 8.39e-19 | 3.38e-01 | 0.0889 |
| 51000 | SLC35B3 | P9T-E | Human | Esophagus | ESCC | 4.07e-18 | 2.84e-01 | 0.1131 |
| 51000 | SLC35B3 | P10T-E | Human | Esophagus | ESCC | 4.10e-16 | 2.04e-01 | 0.116 |
| 51000 | SLC35B3 | P11T-E | Human | Esophagus | ESCC | 1.91e-13 | 4.36e-01 | 0.1426 |
| 51000 | SLC35B3 | P12T-E | Human | Esophagus | ESCC | 1.07e-07 | 1.57e-01 | 0.1122 |
| 51000 | SLC35B3 | P15T-E | Human | Esophagus | ESCC | 4.74e-19 | 2.04e-01 | 0.1149 |
| 51000 | SLC35B3 | P16T-E | Human | Esophagus | ESCC | 3.35e-05 | 1.52e-01 | 0.1153 |
| Page: 1 2 3 4 |
| Tissue | Expression Dynamics | Abbreviation |
| Esophagus | 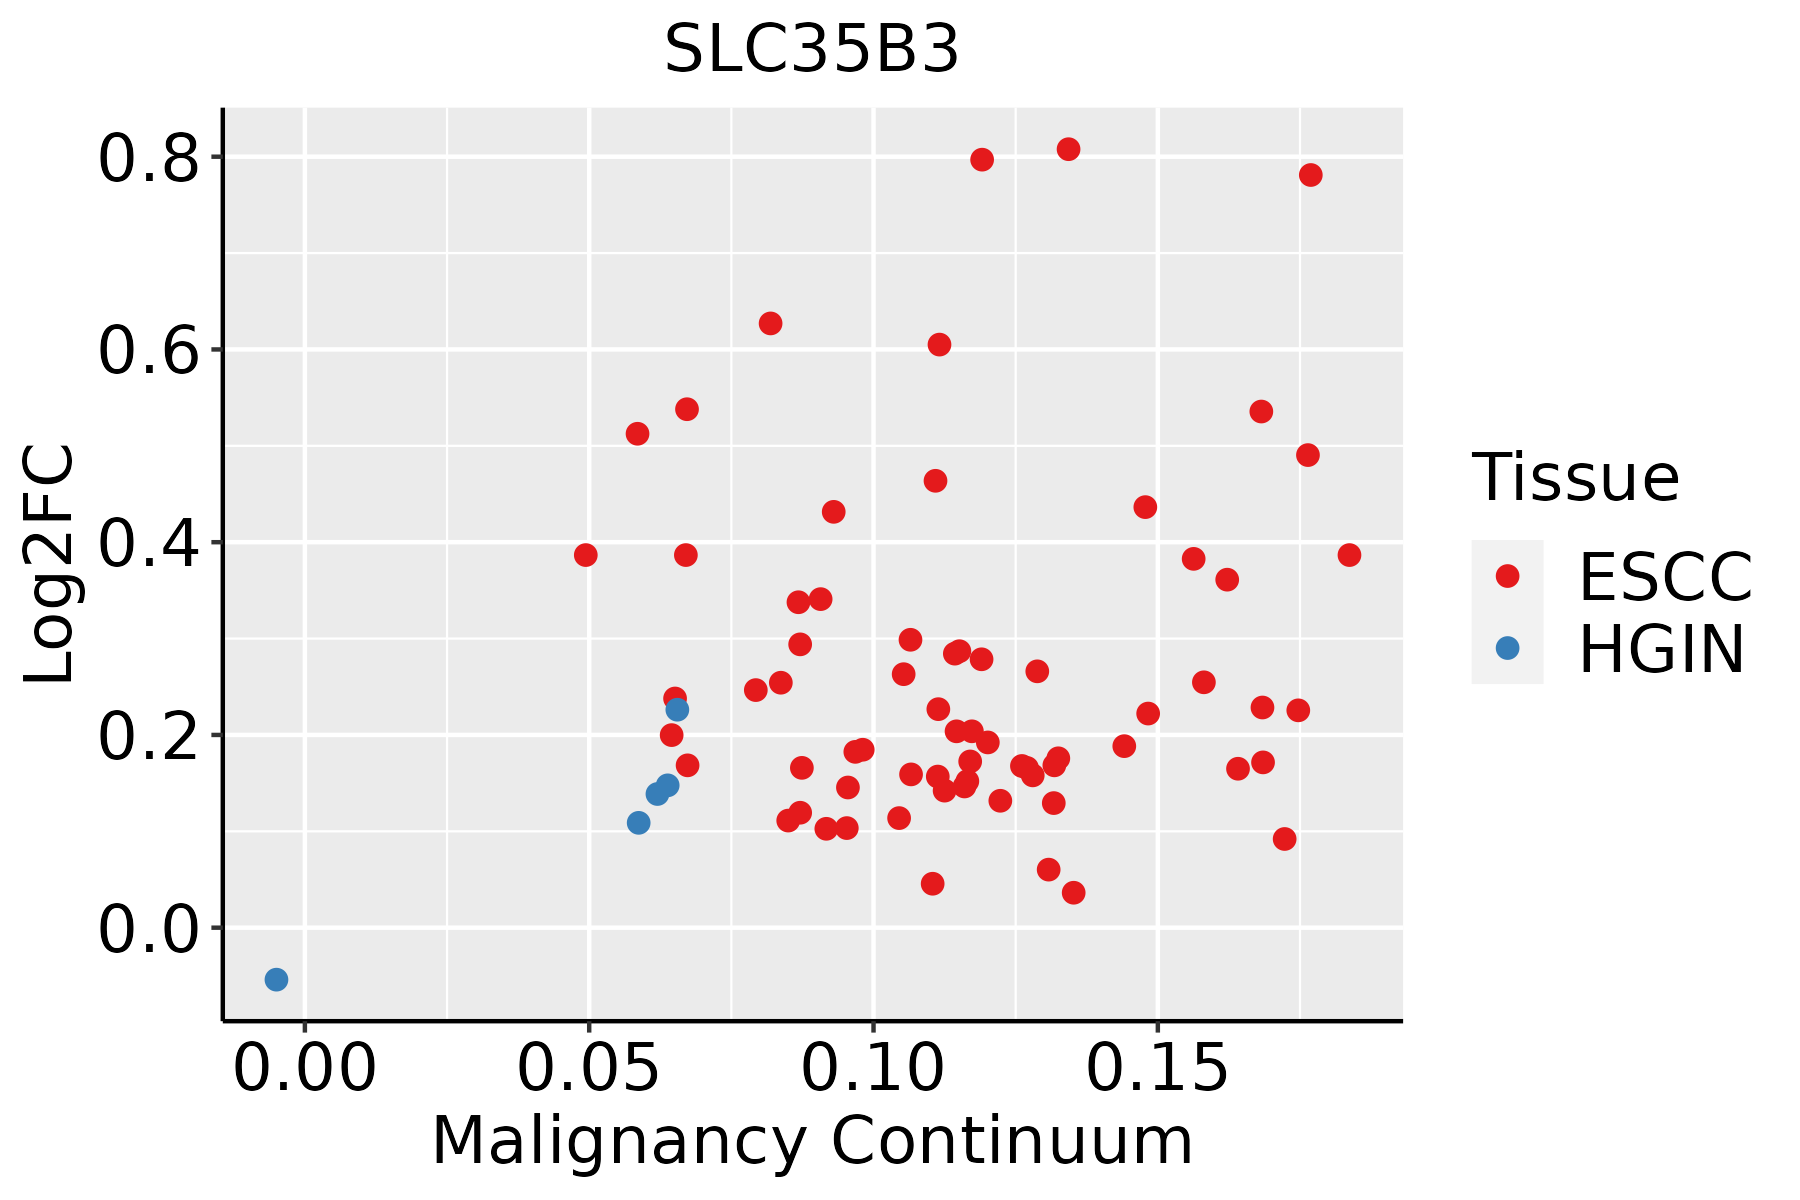 | ESCC: Esophageal squamous cell carcinoma |
| HGIN: High-grade intraepithelial neoplasias | ||
| LGIN: Low-grade intraepithelial neoplasias | ||
| Oral Cavity |  | EOLP: Erosive Oral lichen planus |
| LP: leukoplakia | ||
| NEOLP: Non-erosive oral lichen planus | ||
| OSCC: Oral squamous cell carcinoma |
| ∗log2FC in expression of this searched gene in stem-like cells from each diseased tissue sample relative to stem-like cells in normal samples in each tissue plotted against the malignancy continuum. Samples are colored based on if they are from different disease stage. |
Top |
Malignant transformation related pathway analysis |
| Find out the enriched GO biological processes and KEGG pathways involved in transition from healthy to precancer to cancer |
| Tissue | Disease Stage | Enriched GO biological Processes |
| Colorectum | AD |  |
| Colorectum | SER |  |
| Colorectum | MSS |  |
| Colorectum | MSI-H |  |
| Colorectum | FAP |  |
| ∗Top 15 enriched GO BP terms are showed in the bar plot of each disease state in each tissue. Each row represents a significant GO biological process which is colored according to the -log10(p.adjust). |
| Page: 1 2 3 4 5 6 7 8 9 |
| GO ID | Tissue | Disease Stage | Description | Gene Ratio | Bg Ratio | pvalue | p.adjust | Count |
| GO:001593116 | Esophagus | HGIN | nucleobase-containing compound transport | 57/2587 | 222/18723 | 1.76e-06 | 6.52e-05 | 57 |
| GO:000915219 | Esophagus | HGIN | purine ribonucleotide biosynthetic process | 43/2587 | 169/18723 | 3.94e-05 | 9.74e-04 | 43 |
| GO:004639019 | Esophagus | HGIN | ribose phosphate biosynthetic process | 46/2587 | 190/18723 | 8.06e-05 | 1.79e-03 | 46 |
| GO:007252216 | Esophagus | HGIN | purine-containing compound biosynthetic process | 47/2587 | 200/18723 | 1.46e-04 | 2.91e-03 | 47 |
| GO:000616416 | Esophagus | HGIN | purine nucleotide biosynthetic process | 45/2587 | 191/18723 | 1.87e-04 | 3.52e-03 | 45 |
| GO:000926019 | Esophagus | HGIN | ribonucleotide biosynthetic process | 43/2587 | 182/18723 | 2.41e-04 | 4.33e-03 | 43 |
| GO:000911720 | Esophagus | HGIN | nucleotide metabolic process | 92/2587 | 489/18723 | 1.11e-03 | 1.36e-02 | 92 |
| GO:00091659 | Esophagus | HGIN | nucleotide biosynthetic process | 53/2587 | 254/18723 | 1.24e-03 | 1.49e-02 | 53 |
| GO:000675320 | Esophagus | HGIN | nucleoside phosphate metabolic process | 93/2587 | 497/18723 | 1.25e-03 | 1.49e-02 | 93 |
| GO:19012939 | Esophagus | HGIN | nucleoside phosphate biosynthetic process | 53/2587 | 256/18723 | 1.49e-03 | 1.73e-02 | 53 |
| GO:000915026 | Esophagus | HGIN | purine ribonucleotide metabolic process | 71/2587 | 368/18723 | 2.00e-03 | 2.11e-02 | 71 |
| GO:000616325 | Esophagus | HGIN | purine nucleotide metabolic process | 75/2587 | 396/18723 | 2.53e-03 | 2.51e-02 | 75 |
| GO:001969320 | Esophagus | HGIN | ribose phosphate metabolic process | 75/2587 | 396/18723 | 2.53e-03 | 2.51e-02 | 75 |
| GO:007252125 | Esophagus | HGIN | purine-containing compound metabolic process | 78/2587 | 416/18723 | 2.78e-03 | 2.73e-02 | 78 |
| GO:000925920 | Esophagus | HGIN | ribonucleotide metabolic process | 71/2587 | 385/18723 | 6.25e-03 | 4.97e-02 | 71 |
| GO:001593117 | Esophagus | ESCC | nucleobase-containing compound transport | 162/8552 | 222/18723 | 9.87e-17 | 7.93e-15 | 162 |
| GO:0006753110 | Esophagus | ESCC | nucleoside phosphate metabolic process | 288/8552 | 497/18723 | 1.80e-08 | 3.50e-07 | 288 |
| GO:0019693111 | Esophagus | ESCC | ribose phosphate metabolic process | 234/8552 | 396/18723 | 4.24e-08 | 7.76e-07 | 234 |
| GO:0009117111 | Esophagus | ESCC | nucleotide metabolic process | 282/8552 | 489/18723 | 4.70e-08 | 8.50e-07 | 282 |
| GO:00067906 | Esophagus | ESCC | sulfur compound metabolic process | 201/8552 | 339/18723 | 2.64e-07 | 3.94e-06 | 201 |
| Page: 1 2 3 4 |
| Pathway ID | Tissue | Disease Stage | Description | Gene Ratio | Bg Ratio | pvalue | p.adjust | qvalue | Count |
| Page: 1 |
Top |
Cell-cell communication analysis |
| Identification of potential cell-cell interactions between two cell types and their ligand-receptor pairs for different disease states |
| Ligand | Receptor | LRpair | Pathway | Tissue | Disease Stage |
| Page: 1 |
Top |
Single-cell gene regulatory network inference analysis |
| Find out the significant the regulons (TFs) and the target genes of each regulon across cell types for different disease states |
| TF | Cell Type | Tissue | Disease Stage | Target Gene | RSS | Regulon Activity |
| ∗The dot plots of a searched regulon are shown for all cell subpopulations in each disease state of each tissue based on the regulon specific score inferred using pySCENIC and by calculating the average expression. |
| Page: 1 |
Top |
Somatic mutation of malignant transformation related genes |
| Annotation of somatic variants for genes involved in malignant transformation |
| Hugo Symbol | Variant Class | Variant Classification | dbSNP RS | HGVSc | HGVSp | HGVSp Short | SWISSPROT | BIOTYPE | SIFT | PolyPhen | Tumor Sample Barcode | Tissue | Histology | Sex | Age | Stage | Therapy Types | Drugs | Outcome |
| SLC35B3 | SNV | Missense_Mutation | c.794N>G | p.Tyr265Cys | p.Y265C | Q9H1N7 | protein_coding | deleterious(0) | probably_damaging(0.995) | TCGA-D8-A1XK-01 | Breast | breast invasive carcinoma | Female | <65 | I/II | Chemotherapy | doxorubicine+cyclophosphamide | SD | |
| SLC35B3 | SNV | Missense_Mutation | c.70G>A | p.Glu24Lys | p.E24K | Q9H1N7 | protein_coding | tolerated_low_confidence(0.83) | benign(0) | TCGA-E9-A1R4-01 | Breast | breast invasive carcinoma | Female | >=65 | I/II | Chemotherapy | 5-fluorouracil | SD | |
| SLC35B3 | deletion | Frame_Shift_Del | novel | c.62delN | p.Asn21IlefsTer11 | p.N21Ifs*11 | Q9H1N7 | protein_coding | TCGA-D8-A27V-01 | Breast | breast invasive carcinoma | Female | <65 | I/II | Hormone Therapy | tamoxiphen | SD | ||
| SLC35B3 | SNV | Missense_Mutation | rs769872030 | c.1187N>T | p.Thr396Met | p.T396M | Q9H1N7 | protein_coding | tolerated_low_confidence(0.1) | benign(0.323) | TCGA-C5-A7CO-01 | Cervix | cervical & endocervical cancer | Female | >=65 | I/II | Chemotherapy | cisplatin | SD |
| SLC35B3 | SNV | Missense_Mutation | c.608N>T | p.Ala203Val | p.A203V | Q9H1N7 | protein_coding | tolerated(0.17) | possibly_damaging(0.679) | TCGA-A6-3809-01 | Colorectum | colon adenocarcinoma | Female | >=65 | I/II | Unknown | Unknown | SD | |
| SLC35B3 | SNV | Missense_Mutation | rs374587821 | c.1022N>T | p.Ser341Leu | p.S341L | Q9H1N7 | protein_coding | deleterious(0) | probably_damaging(1) | TCGA-AA-A010-01 | Colorectum | colon adenocarcinoma | Female | <65 | I/II | Chemotherapy | folinic | CR |
| SLC35B3 | SNV | Missense_Mutation | c.53N>A | p.Thr18Asn | p.T18N | Q9H1N7 | protein_coding | tolerated_low_confidence(0.54) | benign(0) | TCGA-AG-4001-01 | Colorectum | rectum adenocarcinoma | Female | >=65 | I/II | Unknown | Unknown | SD | |
| SLC35B3 | SNV | Missense_Mutation | novel | c.1032N>A | p.Phe344Leu | p.F344L | Q9H1N7 | protein_coding | tolerated(0.49) | benign(0.109) | TCGA-AG-A002-01 | Colorectum | rectum adenocarcinoma | Male | <65 | I/II | Unknown | Unknown | SD |
| SLC35B3 | SNV | Missense_Mutation | c.493N>T | p.Gly165Cys | p.G165C | Q9H1N7 | protein_coding | deleterious(0) | probably_damaging(1) | TCGA-CI-6624-01 | Colorectum | rectum adenocarcinoma | Female | <65 | I/II | Unknown | Unknown | SD | |
| SLC35B3 | SNV | Missense_Mutation | novel | c.967N>A | p.Ala323Thr | p.A323T | Q9H1N7 | protein_coding | deleterious(0) | probably_damaging(0.999) | TCGA-EI-6507-01 | Colorectum | rectum adenocarcinoma | Male | <65 | I/II | Unknown | Unknown | SD |
| Page: 1 2 3 4 |
Top |
Related drugs of malignant transformation related genes |
| Identification of chemicals and drugs interact with genes involved in malignant transfromation |
| (DGIdb 4.0) |
| Entrez ID | Symbol | Category | Interaction Types | Drug Claim Name | Drug Name | PMIDs |
| Page: 1 |

Copyright 2023-Present -The University of Texas Health Science Center at Houston |