
|
|||||
|
 | |
| |
| |
| |
| |
| |
|
Gene: SLC35B1 |
Gene summary for SLC35B1 |
| Gene information | Species | Human | Gene symbol | SLC35B1 | Gene ID | 10237 |
| Gene name | solute carrier family 35 member B1 | |
| Gene Alias | AXER | |
| Cytomap | 17q21.33 | |
| Gene Type | protein-coding | GO ID | GO:0006810 | UniProtAcc | D3DTX1 |
Top |
Malignant transformation analysis |
| Identification of the aberrant gene expression in precancerous and cancerous lesions by comparing the gene expression of stem-like cells in diseased tissues with normal stem cells |
| Entrez ID | Symbol | Replicates | Species | Organ | Tissue | Adj P-value | Log2FC | Malignancy |
| 10237 | SLC35B1 | HTA11_2487_2000001011 | Human | Colorectum | SER | 8.95e-08 | 3.96e-01 | -0.1808 |
| 10237 | SLC35B1 | HTA11_347_2000001011 | Human | Colorectum | AD | 1.22e-13 | 3.42e-01 | -0.1954 |
| 10237 | SLC35B1 | HTA11_696_2000001011 | Human | Colorectum | AD | 6.56e-07 | 3.12e-01 | -0.1464 |
| 10237 | SLC35B1 | HTA11_1391_2000001011 | Human | Colorectum | AD | 4.05e-11 | 4.51e-01 | -0.059 |
| 10237 | SLC35B1 | HTA11_5212_2000001011 | Human | Colorectum | AD | 2.67e-02 | 1.85e-01 | -0.2061 |
| 10237 | SLC35B1 | HTA11_866_3004761011 | Human | Colorectum | AD | 2.73e-06 | 3.12e-01 | 0.096 |
| 10237 | SLC35B1 | HTA11_4255_2000001011 | Human | Colorectum | SER | 2.50e-02 | 2.35e-01 | 0.0446 |
| 10237 | SLC35B1 | HTA11_7663_2000001011 | Human | Colorectum | SER | 1.67e-03 | 4.26e-01 | 0.0131 |
| 10237 | SLC35B1 | HTA11_7696_3000711011 | Human | Colorectum | AD | 1.79e-05 | 2.02e-01 | 0.0674 |
| 10237 | SLC35B1 | HTA11_7469_2000001011 | Human | Colorectum | AD | 2.90e-08 | 5.64e-01 | -0.0124 |
| 10237 | SLC35B1 | HTA11_99999970781_79442 | Human | Colorectum | MSS | 4.95e-14 | 3.99e-01 | 0.294 |
| 10237 | SLC35B1 | HTA11_99999965062_69753 | Human | Colorectum | MSI-H | 2.32e-05 | 8.53e-01 | 0.3487 |
| 10237 | SLC35B1 | HTA11_99999965104_69814 | Human | Colorectum | MSS | 3.05e-07 | 2.66e-01 | 0.281 |
| 10237 | SLC35B1 | HTA11_99999971662_82457 | Human | Colorectum | MSS | 1.50e-24 | 6.24e-01 | 0.3859 |
| 10237 | SLC35B1 | HTA11_99999973899_84307 | Human | Colorectum | MSS | 2.87e-03 | 3.38e-01 | 0.2585 |
| 10237 | SLC35B1 | HTA11_99999974143_84620 | Human | Colorectum | MSS | 3.62e-07 | 2.95e-01 | 0.3005 |
| 10237 | SLC35B1 | LZE4T | Human | Esophagus | ESCC | 4.44e-06 | 2.57e-01 | 0.0811 |
| 10237 | SLC35B1 | LZE7T | Human | Esophagus | ESCC | 9.32e-10 | 6.78e-01 | 0.0667 |
| 10237 | SLC35B1 | LZE8T | Human | Esophagus | ESCC | 1.65e-07 | 1.75e-01 | 0.067 |
| 10237 | SLC35B1 | LZE20T | Human | Esophagus | ESCC | 1.41e-03 | 1.08e-01 | 0.0662 |
| Page: 1 2 3 4 5 6 7 8 |
| Tissue | Expression Dynamics | Abbreviation |
| Colorectum (GSE201348) |  | FAP: Familial adenomatous polyposis |
| CRC: Colorectal cancer | ||
| Colorectum (HTA11) |  | AD: Adenomas |
| SER: Sessile serrated lesions | ||
| MSI-H: Microsatellite-high colorectal cancer | ||
| MSS: Microsatellite stable colorectal cancer | ||
| Esophagus | 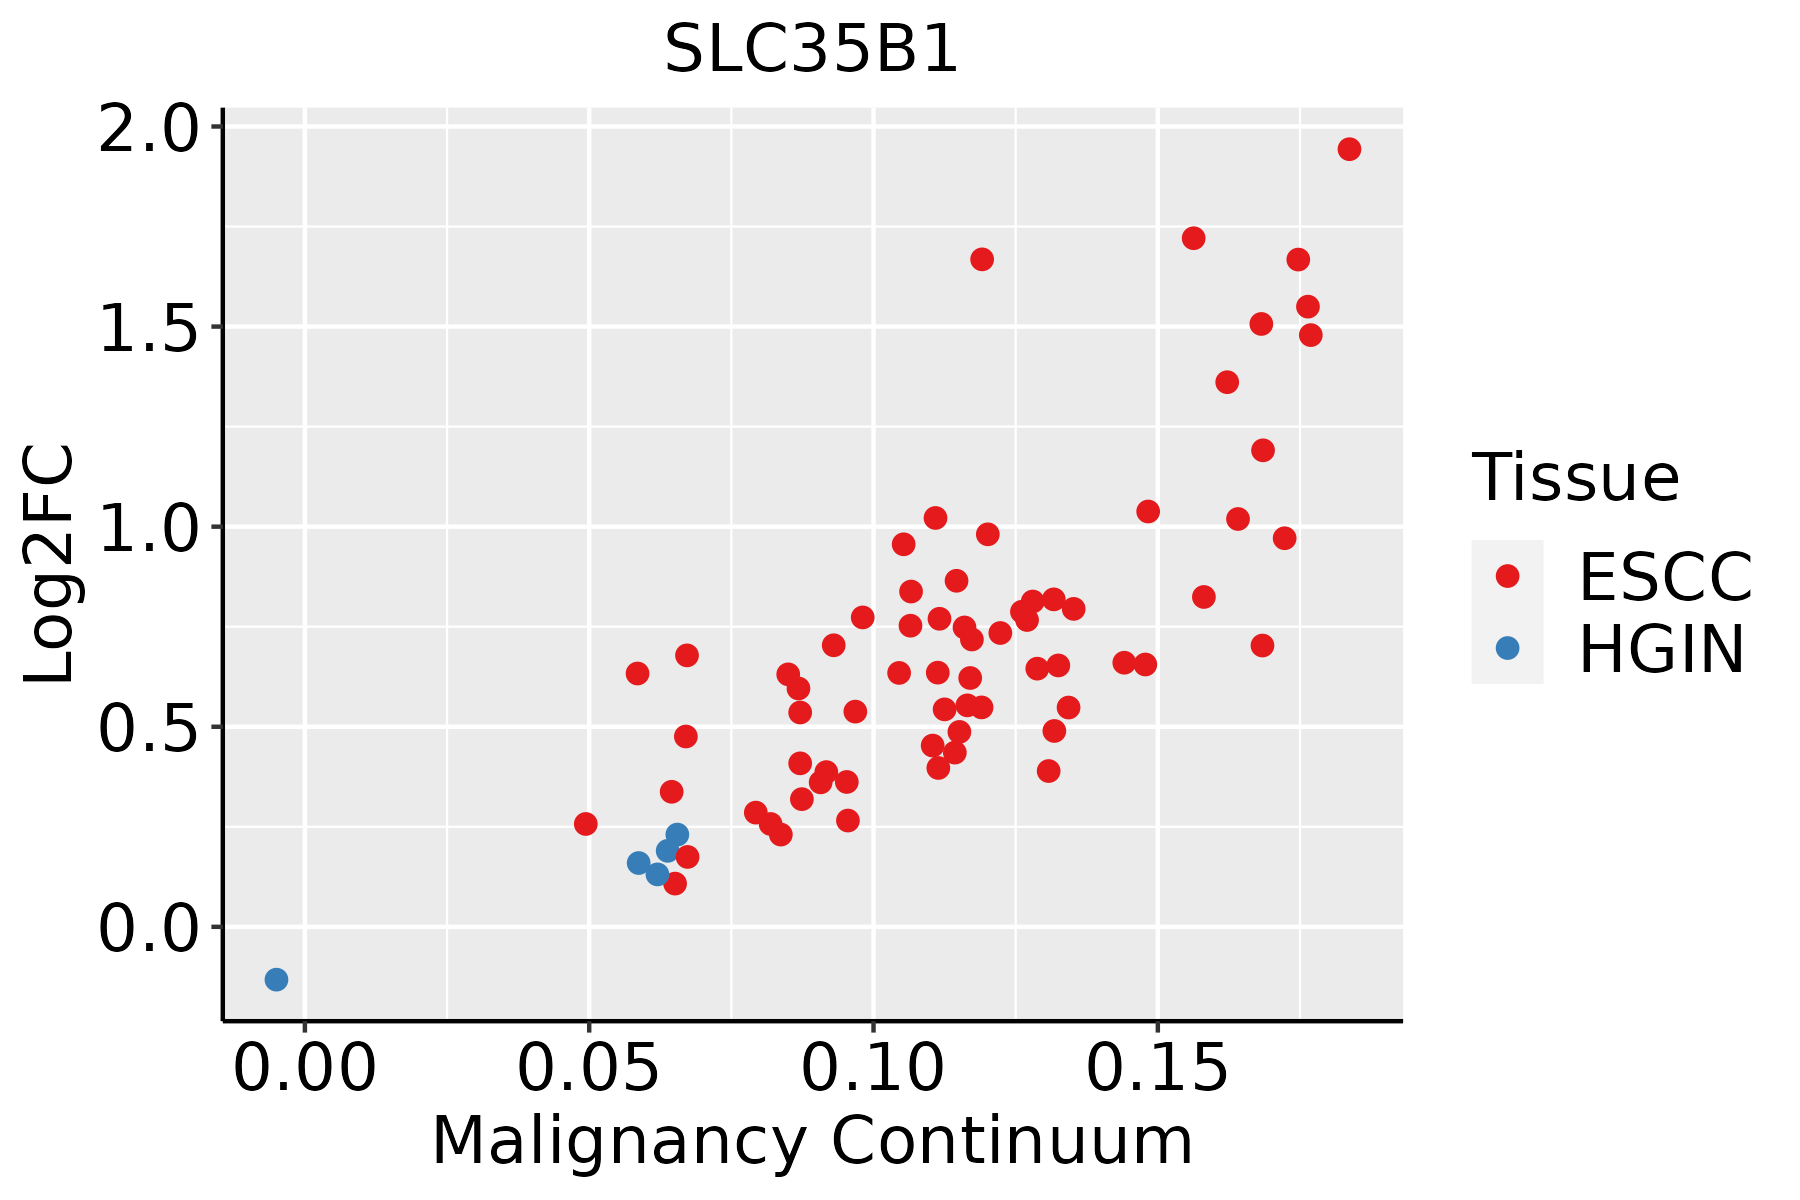 | ESCC: Esophageal squamous cell carcinoma |
| HGIN: High-grade intraepithelial neoplasias | ||
| LGIN: Low-grade intraepithelial neoplasias | ||
| Liver | 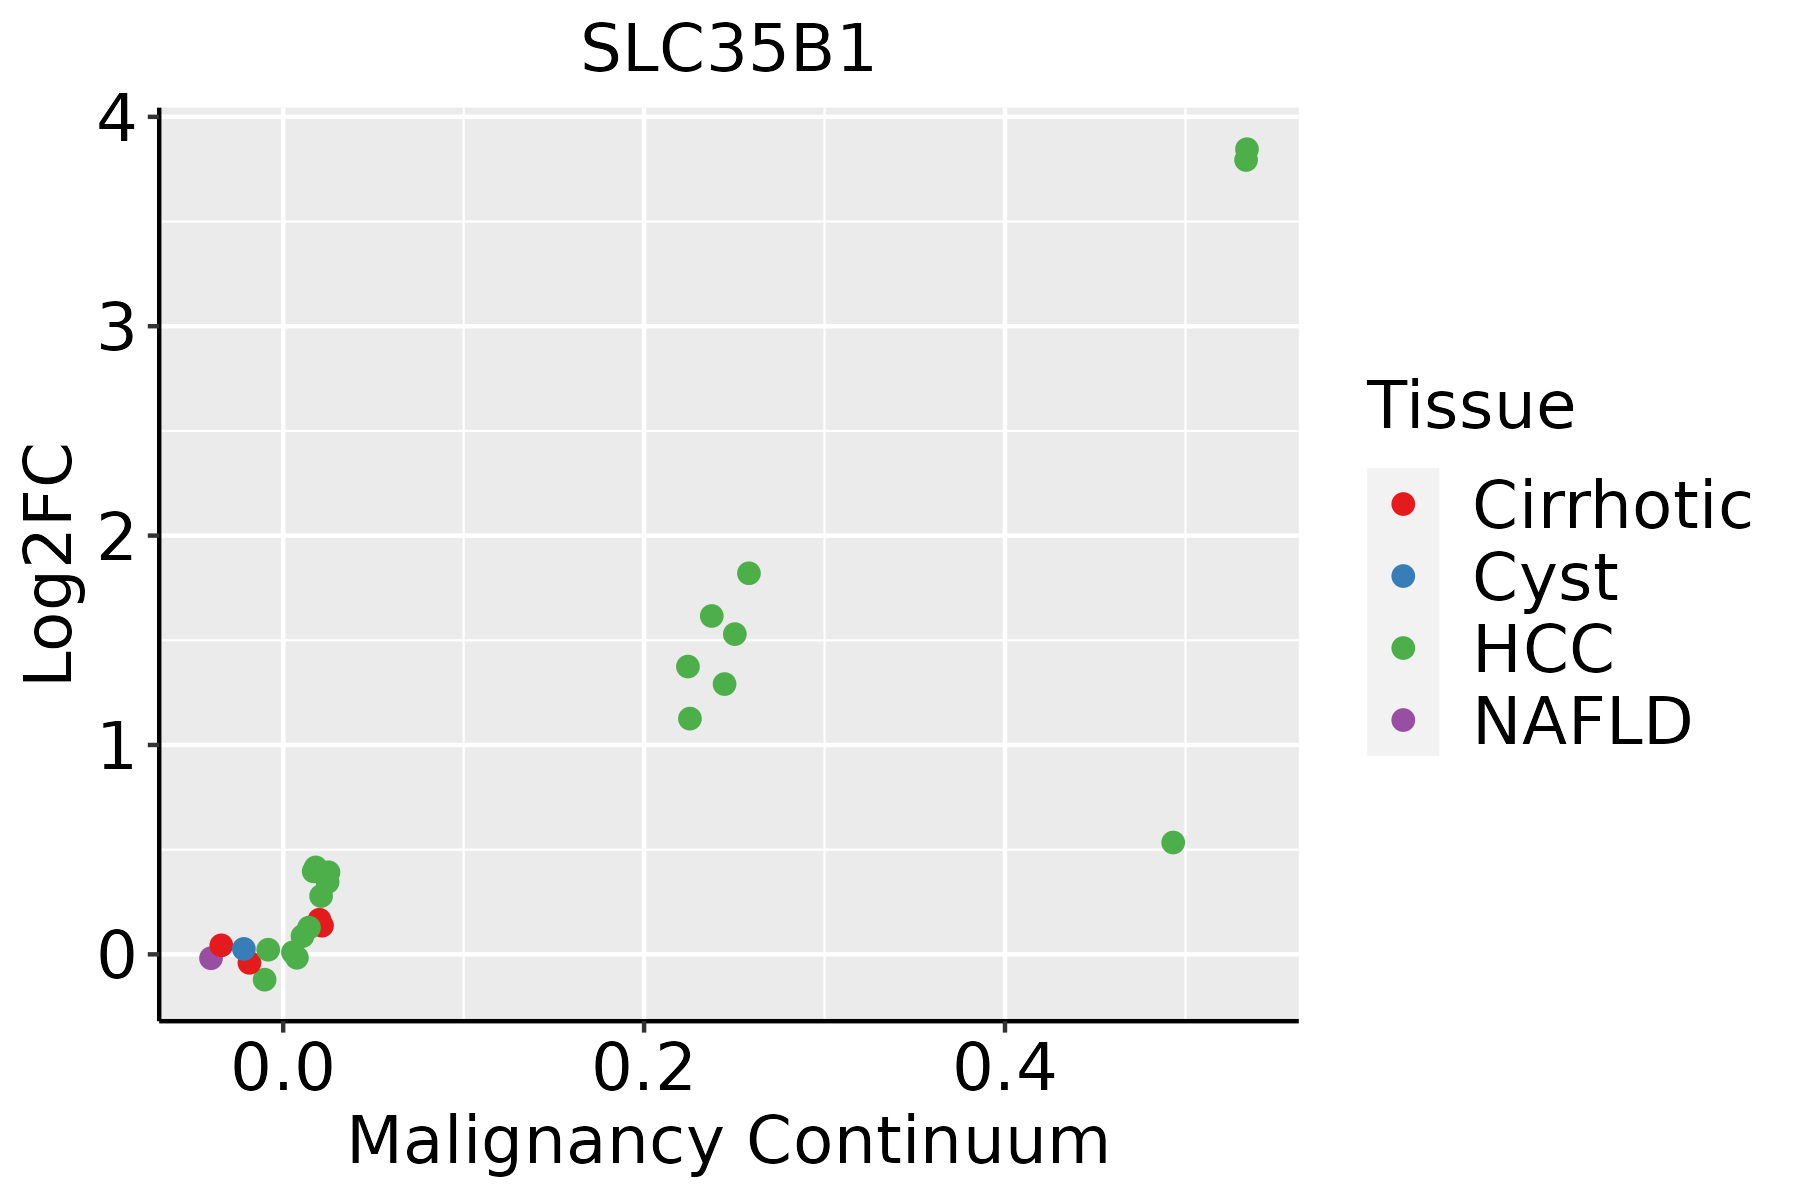 | HCC: Hepatocellular carcinoma |
| NAFLD: Non-alcoholic fatty liver disease | ||
| Oral Cavity |  | EOLP: Erosive Oral lichen planus |
| LP: leukoplakia | ||
| NEOLP: Non-erosive oral lichen planus | ||
| OSCC: Oral squamous cell carcinoma | ||
| Skin |  | AK: Actinic keratosis |
| cSCC: Cutaneous squamous cell carcinoma | ||
| SCCIS:squamous cell carcinoma in situ | ||
| Thyroid | 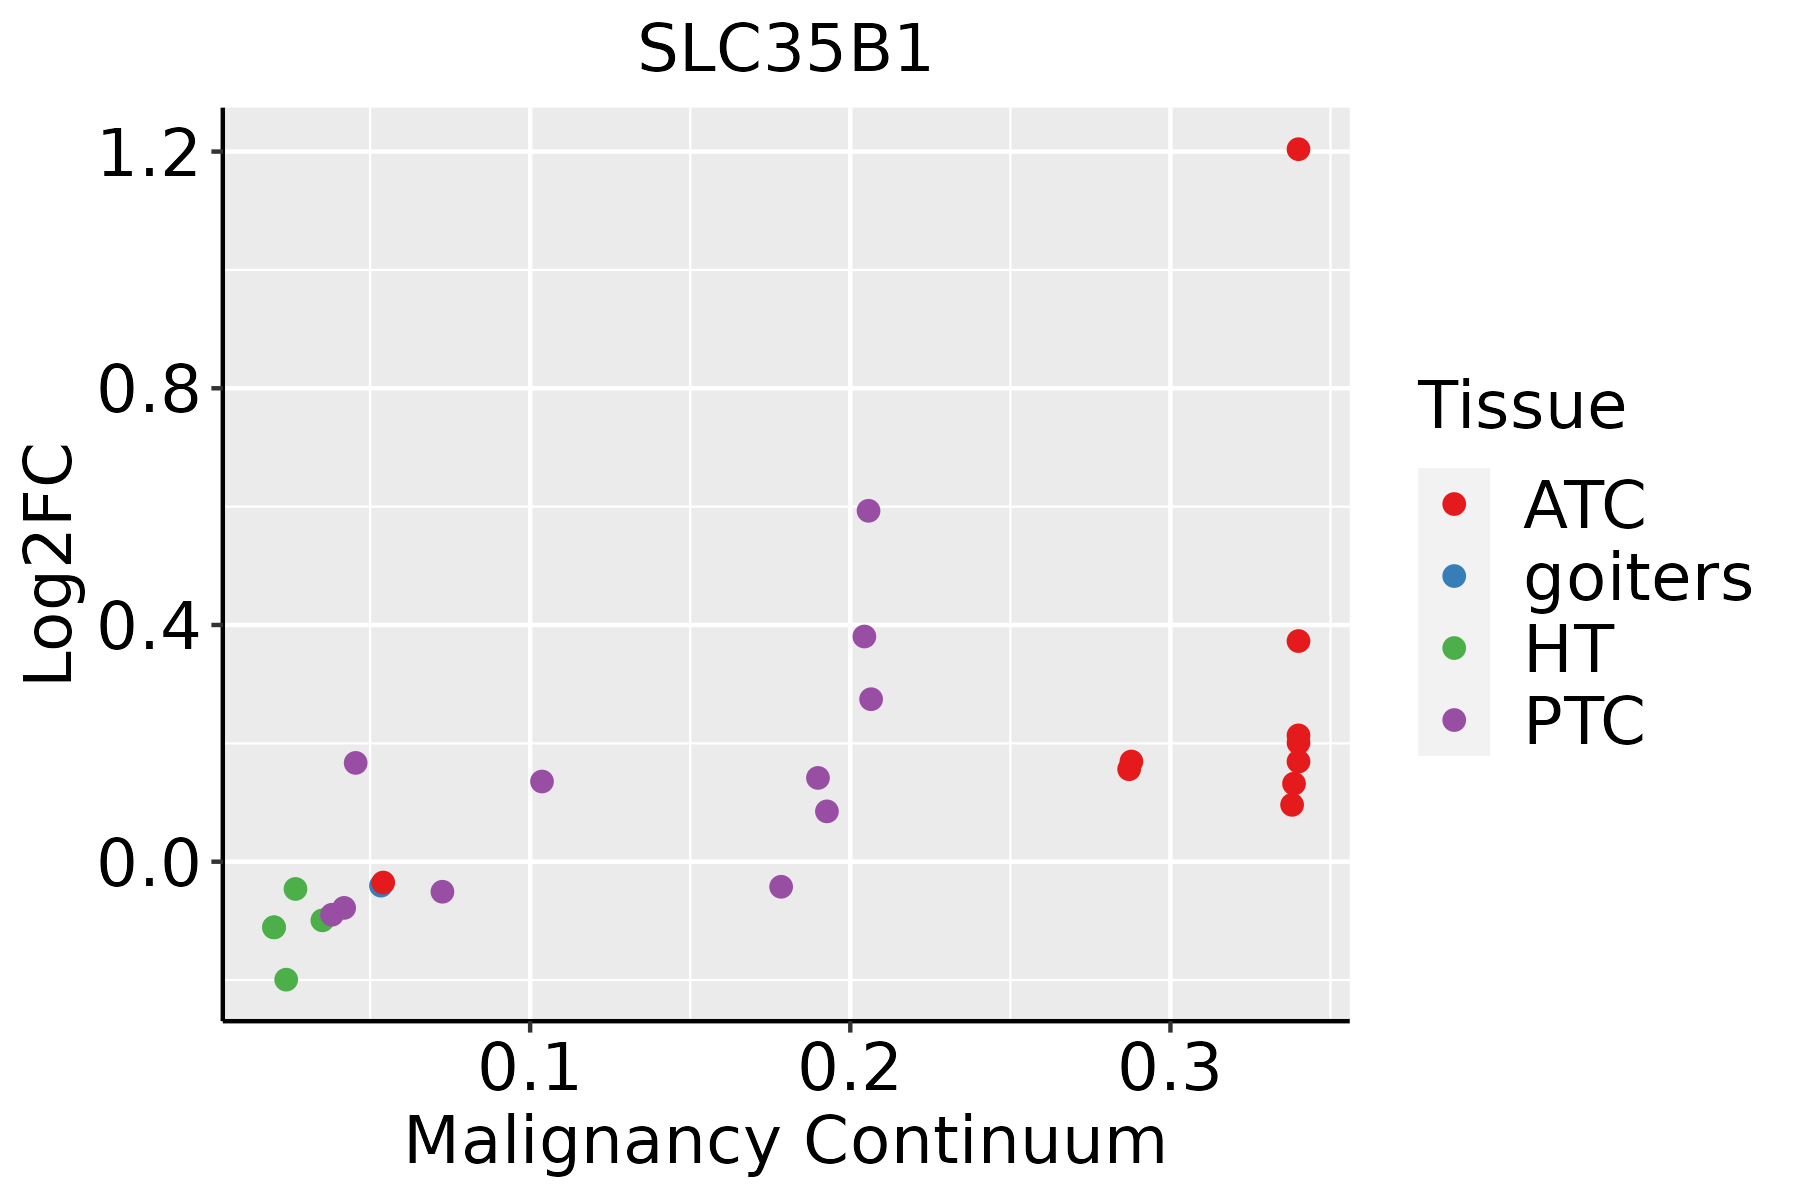 | ATC: Anaplastic thyroid cancer |
| HT: Hashimoto's thyroiditis | ||
| PTC: Papillary thyroid cancer |
| ∗log2FC in expression of this searched gene in stem-like cells from each diseased tissue sample relative to stem-like cells in normal samples in each tissue plotted against the malignancy continuum. Samples are colored based on if they are from different disease stage. |
Top |
Malignant transformation related pathway analysis |
| Find out the enriched GO biological processes and KEGG pathways involved in transition from healthy to precancer to cancer |
| Tissue | Disease Stage | Enriched GO biological Processes |
| Colorectum | AD |  |
| Colorectum | SER |  |
| Colorectum | MSS |  |
| Colorectum | MSI-H |  |
| Colorectum | FAP |  |
| ∗Top 15 enriched GO BP terms are showed in the bar plot of each disease state in each tissue. Each row represents a significant GO biological process which is colored according to the -log10(p.adjust). |
| Page: 1 2 3 4 5 6 7 8 9 |
| GO ID | Tissue | Disease Stage | Description | Gene Ratio | Bg Ratio | pvalue | p.adjust | Count |
| GO:0015931 | Colorectum | AD | nucleobase-containing compound transport | 73/3918 | 222/18723 | 2.02e-05 | 4.10e-04 | 73 |
| GO:00159311 | Colorectum | SER | nucleobase-containing compound transport | 54/2897 | 222/18723 | 3.65e-04 | 5.67e-03 | 54 |
| GO:00159312 | Colorectum | MSS | nucleobase-containing compound transport | 70/3467 | 222/18723 | 1.92e-06 | 6.01e-05 | 70 |
| GO:00159313 | Colorectum | MSI-H | nucleobase-containing compound transport | 30/1319 | 222/18723 | 4.45e-04 | 9.50e-03 | 30 |
| GO:001593117 | Esophagus | ESCC | nucleobase-containing compound transport | 162/8552 | 222/18723 | 9.87e-17 | 7.93e-15 | 162 |
| GO:00159316 | Liver | Cirrhotic | nucleobase-containing compound transport | 87/4634 | 222/18723 | 1.25e-06 | 2.52e-05 | 87 |
| GO:001593111 | Liver | HCC | nucleobase-containing compound transport | 150/7958 | 222/18723 | 3.17e-14 | 2.03e-12 | 150 |
| GO:1901264 | Liver | HCC | carbohydrate derivative transport | 48/7958 | 80/18723 | 1.19e-03 | 6.62e-03 | 48 |
| GO:0008643 | Liver | HCC | carbohydrate transport | 80/7958 | 152/18723 | 7.34e-03 | 2.92e-02 | 80 |
| GO:001593114 | Oral cavity | OSCC | nucleobase-containing compound transport | 150/7305 | 222/18723 | 4.86e-18 | 5.04e-16 | 150 |
| GO:19012642 | Oral cavity | OSCC | carbohydrate derivative transport | 44/7305 | 80/18723 | 2.67e-03 | 1.16e-02 | 44 |
| GO:001593115 | Oral cavity | LP | nucleobase-containing compound transport | 95/4623 | 222/18723 | 2.23e-09 | 9.98e-08 | 95 |
| GO:19012641 | Oral cavity | LP | carbohydrate derivative transport | 31/4623 | 80/18723 | 3.69e-03 | 2.44e-02 | 31 |
| GO:001593119 | Skin | cSCC | nucleobase-containing compound transport | 105/4864 | 222/18723 | 5.49e-12 | 2.89e-10 | 105 |
| GO:0015931110 | Thyroid | PTC | nucleobase-containing compound transport | 120/5968 | 222/18723 | 5.45e-12 | 2.35e-10 | 120 |
| GO:001593122 | Thyroid | ATC | nucleobase-containing compound transport | 122/6293 | 222/18723 | 4.30e-11 | 1.41e-09 | 122 |
| Page: 1 |
| Pathway ID | Tissue | Disease Stage | Description | Gene Ratio | Bg Ratio | pvalue | p.adjust | qvalue | Count |
| Page: 1 |
Top |
Cell-cell communication analysis |
| Identification of potential cell-cell interactions between two cell types and their ligand-receptor pairs for different disease states |
| Ligand | Receptor | LRpair | Pathway | Tissue | Disease Stage |
| Page: 1 |
Top |
Single-cell gene regulatory network inference analysis |
| Find out the significant the regulons (TFs) and the target genes of each regulon across cell types for different disease states |
| TF | Cell Type | Tissue | Disease Stage | Target Gene | RSS | Regulon Activity |
| ∗The dot plots of a searched regulon are shown for all cell subpopulations in each disease state of each tissue based on the regulon specific score inferred using pySCENIC and by calculating the average expression. |
| Page: 1 |
Top |
Somatic mutation of malignant transformation related genes |
| Annotation of somatic variants for genes involved in malignant transformation |
| Hugo Symbol | Variant Class | Variant Classification | dbSNP RS | HGVSc | HGVSp | HGVSp Short | SWISSPROT | BIOTYPE | SIFT | PolyPhen | Tumor Sample Barcode | Tissue | Histology | Sex | Age | Stage | Therapy Types | Drugs | Outcome |
| SLC35B1 | SNV | Missense_Mutation | c.934N>G | p.Thr312Ala | p.T312A | P78383 | protein_coding | deleterious(0) | possibly_damaging(0.773) | TCGA-BH-A0BJ-01 | Breast | breast invasive carcinoma | Female | <65 | I/II | Chemotherapy | doxorubicin | SD | |
| SLC35B1 | SNV | Missense_Mutation | rs144458039 | c.358C>T | p.Arg120Trp | p.R120W | P78383 | protein_coding | deleterious(0.01) | possibly_damaging(0.54) | TCGA-D8-A1XK-01 | Breast | breast invasive carcinoma | Female | <65 | I/II | Chemotherapy | doxorubicine+cyclophosphamide | SD |
| SLC35B1 | insertion | Nonsense_Mutation | novel | c.640_641insACACTGGGGTTAATGGTGGAGGCTGCTGATGGCTGAAGGTG | p.Leu214HisfsTer10 | p.L214Hfs*10 | P78383 | protein_coding | TCGA-AN-A049-01 | Breast | breast invasive carcinoma | Female | <65 | I/II | Unknown | Unknown | SD | ||
| SLC35B1 | insertion | Frame_Shift_Ins | novel | c.365_366insTGTCAAGGGAGGTTGTGGTGCTCCTTGTCCCCATATCT | p.Trp122CysfsTer58 | p.W122Cfs*58 | P78383 | protein_coding | TCGA-B6-A0IK-01 | Breast | breast invasive carcinoma | Female | <65 | III/IV | Unknown | Unknown | PD | ||
| SLC35B1 | SNV | Missense_Mutation | novel | c.576N>A | p.Met192Ile | p.M192I | P78383 | protein_coding | tolerated(0.07) | benign(0.036) | TCGA-C5-A8XJ-01 | Cervix | cervical & endocervical cancer | Female | >=65 | I/II | Chemotherapy | cisplatin | SD |
| SLC35B1 | SNV | Missense_Mutation | c.49C>T | p.Pro17Ser | p.P17S | P78383 | protein_coding | deleterious_low_confidence(0.04) | possibly_damaging(0.81) | TCGA-EK-A3GK-01 | Cervix | cervical & endocervical cancer | Female | <65 | I/II | Unknown | Unknown | SD | |
| SLC35B1 | SNV | Missense_Mutation | c.905N>A | p.Gly302Asp | p.G302D | P78383 | protein_coding | deleterious(0) | probably_damaging(0.954) | TCGA-A6-6781-01 | Colorectum | colon adenocarcinoma | Male | <65 | III/IV | Chemotherapy | oxaliplatin | SD | |
| SLC35B1 | SNV | Missense_Mutation | c.1076A>T | p.His359Leu | p.H359L | P78383 | protein_coding | deleterious(0) | benign(0.373) | TCGA-AA-3715-01 | Colorectum | colon adenocarcinoma | Male | >=65 | I/II | Unknown | Unknown | PD | |
| SLC35B1 | SNV | Missense_Mutation | c.949N>C | p.Thr317Pro | p.T317P | P78383 | protein_coding | deleterious(0) | possibly_damaging(0.527) | TCGA-AZ-4315-01 | Colorectum | colon adenocarcinoma | Male | <65 | I/II | Unknown | Unknown | SD | |
| SLC35B1 | SNV | Missense_Mutation | novel | c.215N>G | p.Ile72Arg | p.I72R | P78383 | protein_coding | deleterious(0) | possibly_damaging(0.897) | TCGA-CA-6717-01 | Colorectum | colon adenocarcinoma | Male | <65 | I/II | Chemotherapy | oxaliplatin | CR |
| Page: 1 2 3 4 5 |
Top |
Related drugs of malignant transformation related genes |
| Identification of chemicals and drugs interact with genes involved in malignant transfromation |
| (DGIdb 4.0) |
| Entrez ID | Symbol | Category | Interaction Types | Drug Claim Name | Drug Name | PMIDs |
| Page: 1 |

Copyright 2023-Present -The University of Texas Health Science Center at Houston |