
|
|||||
|
 | |
| |
| |
| |
| |
| |
|
Gene: SLC35A5 |
Gene summary for SLC35A5 |
| Gene information | Species | Human | Gene symbol | SLC35A5 | Gene ID | 55032 |
| Gene name | solute carrier family 35 member A5 | |
| Gene Alias | SLC35A5 | |
| Cytomap | 3q13.2 | |
| Gene Type | protein-coding | GO ID | GO:0006810 | UniProtAcc | Q9BS91 |
Top |
Malignant transformation analysis |
| Identification of the aberrant gene expression in precancerous and cancerous lesions by comparing the gene expression of stem-like cells in diseased tissues with normal stem cells |
| Entrez ID | Symbol | Replicates | Species | Organ | Tissue | Adj P-value | Log2FC | Malignancy |
| 55032 | SLC35A5 | LZE4T | Human | Esophagus | ESCC | 7.77e-03 | 1.32e-01 | 0.0811 |
| 55032 | SLC35A5 | LZE8T | Human | Esophagus | ESCC | 1.49e-02 | 1.15e-01 | 0.067 |
| 55032 | SLC35A5 | LZE20T | Human | Esophagus | ESCC | 3.26e-03 | 1.23e-01 | 0.0662 |
| 55032 | SLC35A5 | LZE24T | Human | Esophagus | ESCC | 4.42e-16 | 3.80e-01 | 0.0596 |
| 55032 | SLC35A5 | P1T-E | Human | Esophagus | ESCC | 1.47e-02 | 1.63e-01 | 0.0875 |
| 55032 | SLC35A5 | P2T-E | Human | Esophagus | ESCC | 1.65e-05 | 1.42e-01 | 0.1177 |
| 55032 | SLC35A5 | P4T-E | Human | Esophagus | ESCC | 5.33e-07 | 1.62e-01 | 0.1323 |
| 55032 | SLC35A5 | P5T-E | Human | Esophagus | ESCC | 1.93e-06 | 8.25e-02 | 0.1327 |
| 55032 | SLC35A5 | P8T-E | Human | Esophagus | ESCC | 4.87e-22 | 3.67e-01 | 0.0889 |
| 55032 | SLC35A5 | P9T-E | Human | Esophagus | ESCC | 2.87e-07 | 1.48e-01 | 0.1131 |
| 55032 | SLC35A5 | P10T-E | Human | Esophagus | ESCC | 3.45e-26 | 4.88e-01 | 0.116 |
| 55032 | SLC35A5 | P11T-E | Human | Esophagus | ESCC | 5.46e-05 | 2.67e-01 | 0.1426 |
| 55032 | SLC35A5 | P12T-E | Human | Esophagus | ESCC | 3.20e-07 | 1.32e-01 | 0.1122 |
| 55032 | SLC35A5 | P15T-E | Human | Esophagus | ESCC | 6.27e-06 | 1.34e-01 | 0.1149 |
| 55032 | SLC35A5 | P16T-E | Human | Esophagus | ESCC | 7.84e-30 | 4.70e-01 | 0.1153 |
| 55032 | SLC35A5 | P19T-E | Human | Esophagus | ESCC | 1.75e-02 | 3.35e-01 | 0.1662 |
| 55032 | SLC35A5 | P20T-E | Human | Esophagus | ESCC | 6.00e-07 | 1.91e-01 | 0.1124 |
| 55032 | SLC35A5 | P21T-E | Human | Esophagus | ESCC | 5.85e-06 | 2.01e-01 | 0.1617 |
| 55032 | SLC35A5 | P22T-E | Human | Esophagus | ESCC | 1.41e-08 | 1.77e-01 | 0.1236 |
| 55032 | SLC35A5 | P23T-E | Human | Esophagus | ESCC | 4.51e-10 | 2.83e-01 | 0.108 |
| Page: 1 2 3 4 |
| Tissue | Expression Dynamics | Abbreviation |
| Esophagus | 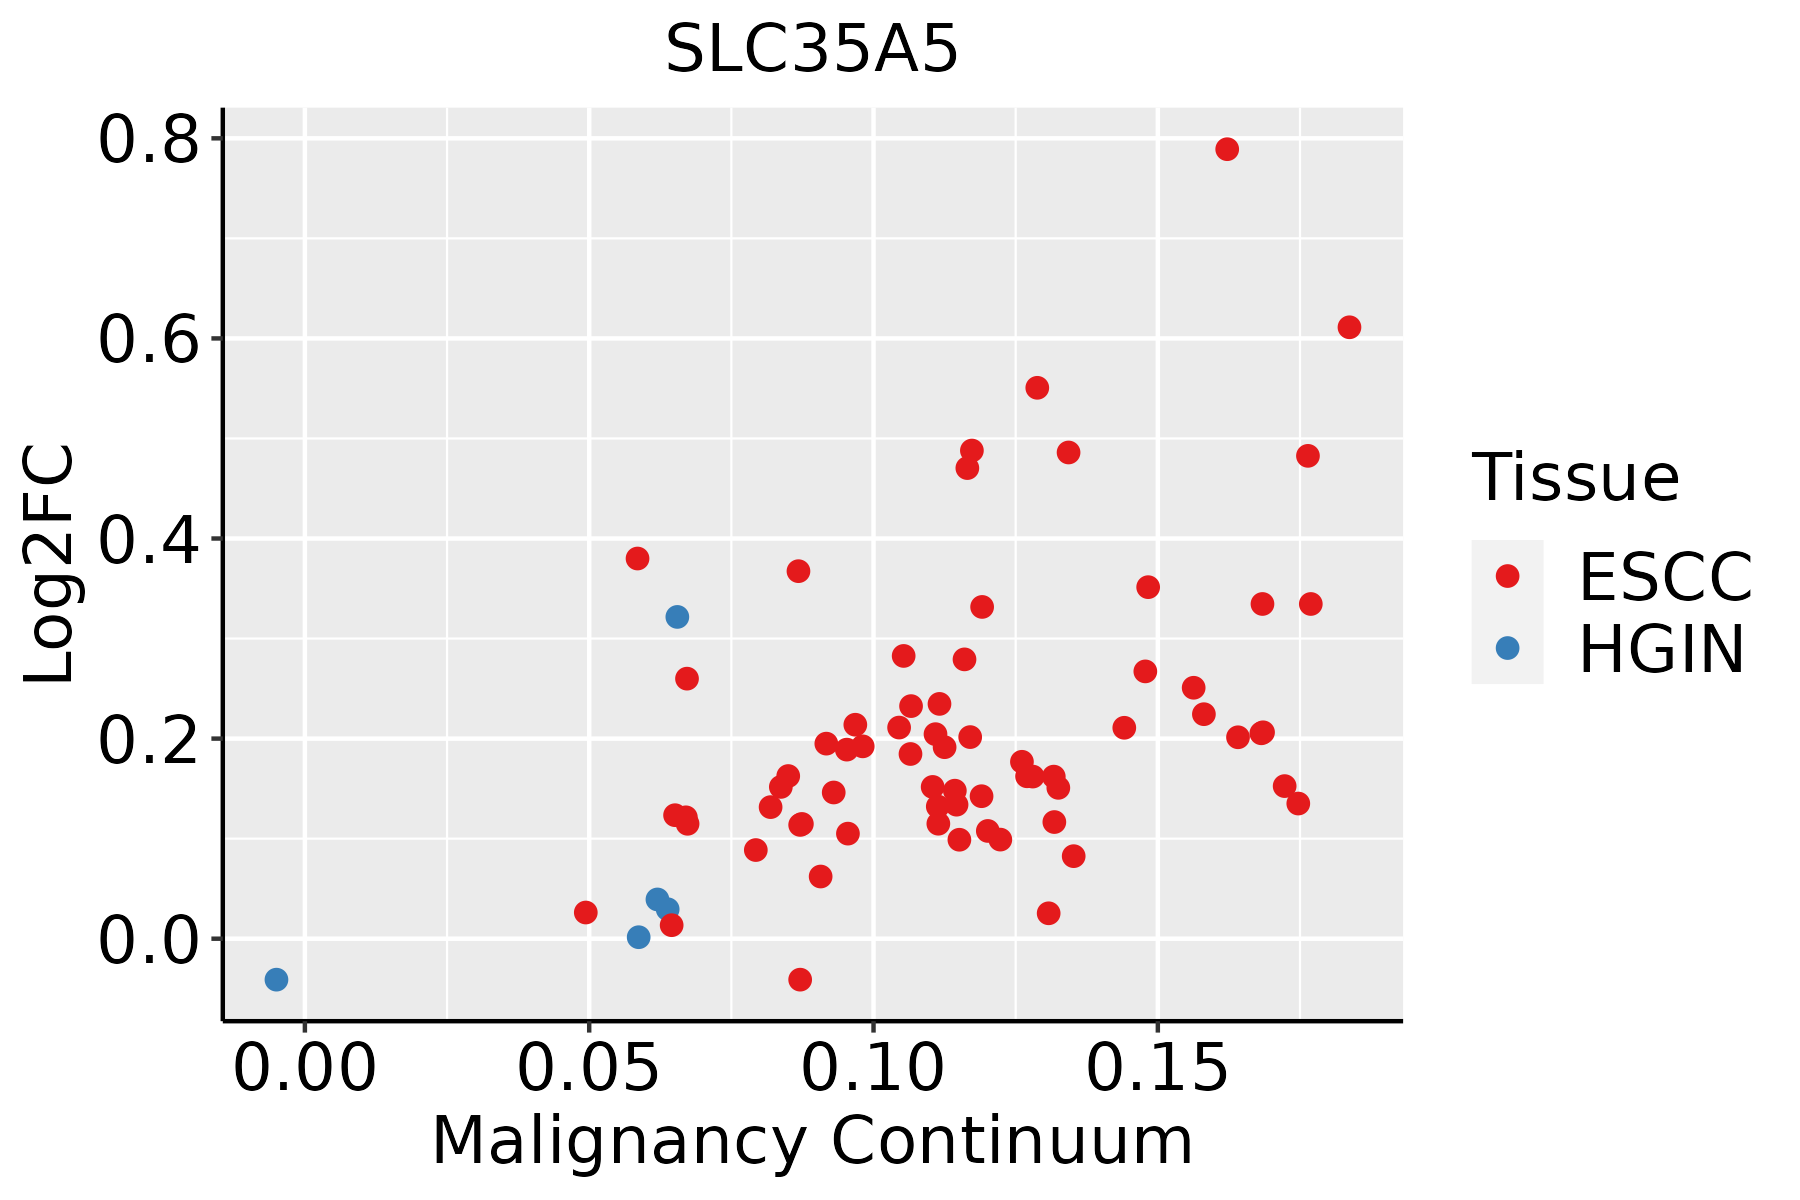 | ESCC: Esophageal squamous cell carcinoma |
| HGIN: High-grade intraepithelial neoplasias | ||
| LGIN: Low-grade intraepithelial neoplasias | ||
| Oral Cavity |  | EOLP: Erosive Oral lichen planus |
| LP: leukoplakia | ||
| NEOLP: Non-erosive oral lichen planus | ||
| OSCC: Oral squamous cell carcinoma |
| ∗log2FC in expression of this searched gene in stem-like cells from each diseased tissue sample relative to stem-like cells in normal samples in each tissue plotted against the malignancy continuum. Samples are colored based on if they are from different disease stage. |
Top |
Malignant transformation related pathway analysis |
| Find out the enriched GO biological processes and KEGG pathways involved in transition from healthy to precancer to cancer |
| Tissue | Disease Stage | Enriched GO biological Processes |
| Colorectum | AD |  |
| Colorectum | SER |  |
| Colorectum | MSS |  |
| Colorectum | MSI-H |  |
| Colorectum | FAP |  |
| ∗Top 15 enriched GO BP terms are showed in the bar plot of each disease state in each tissue. Each row represents a significant GO biological process which is colored according to the -log10(p.adjust). |
| Page: 1 2 3 4 5 6 7 8 9 |
| GO ID | Tissue | Disease Stage | Description | Gene Ratio | Bg Ratio | pvalue | p.adjust | Count |
| GO:001593117 | Esophagus | ESCC | nucleobase-containing compound transport | 162/8552 | 222/18723 | 9.87e-17 | 7.93e-15 | 162 |
| GO:001593114 | Oral cavity | OSCC | nucleobase-containing compound transport | 150/7305 | 222/18723 | 4.86e-18 | 5.04e-16 | 150 |
| GO:19012642 | Oral cavity | OSCC | carbohydrate derivative transport | 44/7305 | 80/18723 | 2.67e-03 | 1.16e-02 | 44 |
| Page: 1 |
| Pathway ID | Tissue | Disease Stage | Description | Gene Ratio | Bg Ratio | pvalue | p.adjust | qvalue | Count |
| Page: 1 |
Top |
Cell-cell communication analysis |
| Identification of potential cell-cell interactions between two cell types and their ligand-receptor pairs for different disease states |
| Ligand | Receptor | LRpair | Pathway | Tissue | Disease Stage |
| Page: 1 |
Top |
Single-cell gene regulatory network inference analysis |
| Find out the significant the regulons (TFs) and the target genes of each regulon across cell types for different disease states |
| TF | Cell Type | Tissue | Disease Stage | Target Gene | RSS | Regulon Activity |
| ∗The dot plots of a searched regulon are shown for all cell subpopulations in each disease state of each tissue based on the regulon specific score inferred using pySCENIC and by calculating the average expression. |
| Page: 1 |
Top |
Somatic mutation of malignant transformation related genes |
| Annotation of somatic variants for genes involved in malignant transformation |
| Hugo Symbol | Variant Class | Variant Classification | dbSNP RS | HGVSc | HGVSp | HGVSp Short | SWISSPROT | BIOTYPE | SIFT | PolyPhen | Tumor Sample Barcode | Tissue | Histology | Sex | Age | Stage | Therapy Types | Drugs | Outcome |
| SLC35A5 | SNV | Missense_Mutation | rs372446123 | c.1142C>T | p.Pro381Leu | p.P381L | Q9BS91 | protein_coding | tolerated(0.77) | benign(0) | TCGA-A8-A09M-01 | Breast | breast invasive carcinoma | Female | >=65 | III/IV | Chemotherapy | paclitaxel | CR |
| SLC35A5 | SNV | Missense_Mutation | c.1030N>G | p.Thr344Ala | p.T344A | Q9BS91 | protein_coding | tolerated(0.34) | benign(0.171) | TCGA-EW-A1PD-01 | Breast | breast invasive carcinoma | Male | <65 | I/II | Chemotherapy | docetaxel | SD | |
| SLC35A5 | SNV | Missense_Mutation | novel | c.1238A>G | p.Lys413Arg | p.K413R | Q9BS91 | protein_coding | deleterious_low_confidence(0.04) | benign(0.056) | TCGA-2W-A8YY-01 | Cervix | cervical & endocervical cancer | Female | <65 | I/II | Chemotherapy | cisplatin | CR |
| SLC35A5 | SNV | Missense_Mutation | novel | c.784G>A | p.Glu262Lys | p.E262K | Q9BS91 | protein_coding | deleterious(0.01) | benign(0.379) | TCGA-VS-A8QA-01 | Cervix | cervical & endocervical cancer | Female | <65 | I/II | Unknown | Unknown | SD |
| SLC35A5 | SNV | Missense_Mutation | c.244N>C | p.Asn82His | p.N82H | Q9BS91 | protein_coding | tolerated(0.13) | benign(0) | TCGA-AA-3510-01 | Colorectum | colon adenocarcinoma | Male | >=65 | I/II | Unknown | Unknown | SD | |
| SLC35A5 | SNV | Missense_Mutation | c.457T>C | p.Ser153Pro | p.S153P | Q9BS91 | protein_coding | deleterious(0.01) | probably_damaging(0.981) | TCGA-AY-A8YK-01 | Colorectum | colon adenocarcinoma | Male | <65 | I/II | Chemotherapy | 5-fu | CR | |
| SLC35A5 | SNV | Missense_Mutation | c.926N>G | p.Leu309Arg | p.L309R | Q9BS91 | protein_coding | deleterious(0) | probably_damaging(0.999) | TCGA-AZ-4682-01 | Colorectum | colon adenocarcinoma | Male | <65 | I/II | Chemotherapy | camptosar | PD | |
| SLC35A5 | SNV | Missense_Mutation | c.1048N>A | p.Val350Ile | p.V350I | Q9BS91 | protein_coding | tolerated(0.28) | benign(0.007) | TCGA-G4-6303-01 | Colorectum | colon adenocarcinoma | Female | <65 | III/IV | Chemotherapy | 5-fu | PD | |
| SLC35A5 | SNV | Missense_Mutation | novel | c.126T>G | p.Asn42Lys | p.N42K | Q9BS91 | protein_coding | tolerated(0.32) | probably_damaging(0.999) | TCGA-AG-3878-01 | Colorectum | rectum adenocarcinoma | Male | <65 | I/II | Unknown | Unknown | SD |
| SLC35A5 | SNV | Missense_Mutation | c.665N>T | p.Arg222Ile | p.R222I | Q9BS91 | protein_coding | tolerated(0.15) | benign(0.023) | TCGA-AG-A002-01 | Colorectum | rectum adenocarcinoma | Male | <65 | I/II | Unknown | Unknown | SD |
| Page: 1 2 3 4 5 |
Top |
Related drugs of malignant transformation related genes |
| Identification of chemicals and drugs interact with genes involved in malignant transfromation |
| (DGIdb 4.0) |
| Entrez ID | Symbol | Category | Interaction Types | Drug Claim Name | Drug Name | PMIDs |
| Page: 1 |

Copyright 2023-Present -The University of Texas Health Science Center at Houston |