
|
|||||
|
 | |
| |
| |
| |
| |
| |
|
Gene: SLC35A4 |
Gene summary for SLC35A4 |
| Gene information | Species | Human | Gene symbol | SLC35A4 | Gene ID | 113829 |
| Gene name | solute carrier family 35 member A4 | |
| Gene Alias | SLC35A4 | |
| Cytomap | 5q31.3 | |
| Gene Type | protein-coding | GO ID | GO:0006810 | UniProtAcc | Q96G79 |
Top |
Malignant transformation analysis |
| Identification of the aberrant gene expression in precancerous and cancerous lesions by comparing the gene expression of stem-like cells in diseased tissues with normal stem cells |
| Entrez ID | Symbol | Replicates | Species | Organ | Tissue | Adj P-value | Log2FC | Malignancy |
| 113829 | SLC35A4 | LZE8T | Human | Esophagus | ESCC | 3.86e-02 | 1.04e-01 | 0.067 |
| 113829 | SLC35A4 | LZE22T | Human | Esophagus | ESCC | 1.13e-06 | 3.82e-01 | 0.068 |
| 113829 | SLC35A4 | LZE24T | Human | Esophagus | ESCC | 2.19e-10 | 2.34e-01 | 0.0596 |
| 113829 | SLC35A4 | LZE6T | Human | Esophagus | ESCC | 3.73e-04 | 1.27e-01 | 0.0845 |
| 113829 | SLC35A4 | P2T-E | Human | Esophagus | ESCC | 7.74e-18 | 3.75e-01 | 0.1177 |
| 113829 | SLC35A4 | P4T-E | Human | Esophagus | ESCC | 5.02e-11 | 2.38e-01 | 0.1323 |
| 113829 | SLC35A4 | P5T-E | Human | Esophagus | ESCC | 5.25e-08 | 1.29e-01 | 0.1327 |
| 113829 | SLC35A4 | P8T-E | Human | Esophagus | ESCC | 2.33e-15 | 1.43e-01 | 0.0889 |
| 113829 | SLC35A4 | P9T-E | Human | Esophagus | ESCC | 2.85e-10 | 2.12e-01 | 0.1131 |
| 113829 | SLC35A4 | P10T-E | Human | Esophagus | ESCC | 2.03e-14 | 1.36e-01 | 0.116 |
| 113829 | SLC35A4 | P11T-E | Human | Esophagus | ESCC | 7.57e-21 | 6.29e-01 | 0.1426 |
| 113829 | SLC35A4 | P12T-E | Human | Esophagus | ESCC | 1.50e-23 | 4.15e-01 | 0.1122 |
| 113829 | SLC35A4 | P15T-E | Human | Esophagus | ESCC | 6.83e-11 | 1.50e-01 | 0.1149 |
| 113829 | SLC35A4 | P16T-E | Human | Esophagus | ESCC | 6.76e-21 | 1.46e-01 | 0.1153 |
| 113829 | SLC35A4 | P17T-E | Human | Esophagus | ESCC | 8.12e-09 | 4.27e-01 | 0.1278 |
| 113829 | SLC35A4 | P19T-E | Human | Esophagus | ESCC | 5.28e-09 | 7.91e-01 | 0.1662 |
| 113829 | SLC35A4 | P20T-E | Human | Esophagus | ESCC | 1.29e-22 | 4.44e-01 | 0.1124 |
| 113829 | SLC35A4 | P21T-E | Human | Esophagus | ESCC | 1.78e-29 | 5.56e-01 | 0.1617 |
| 113829 | SLC35A4 | P22T-E | Human | Esophagus | ESCC | 6.92e-18 | 2.13e-01 | 0.1236 |
| 113829 | SLC35A4 | P23T-E | Human | Esophagus | ESCC | 2.42e-20 | 4.18e-01 | 0.108 |
| Page: 1 2 3 4 5 6 |
| Tissue | Expression Dynamics | Abbreviation |
| Esophagus | 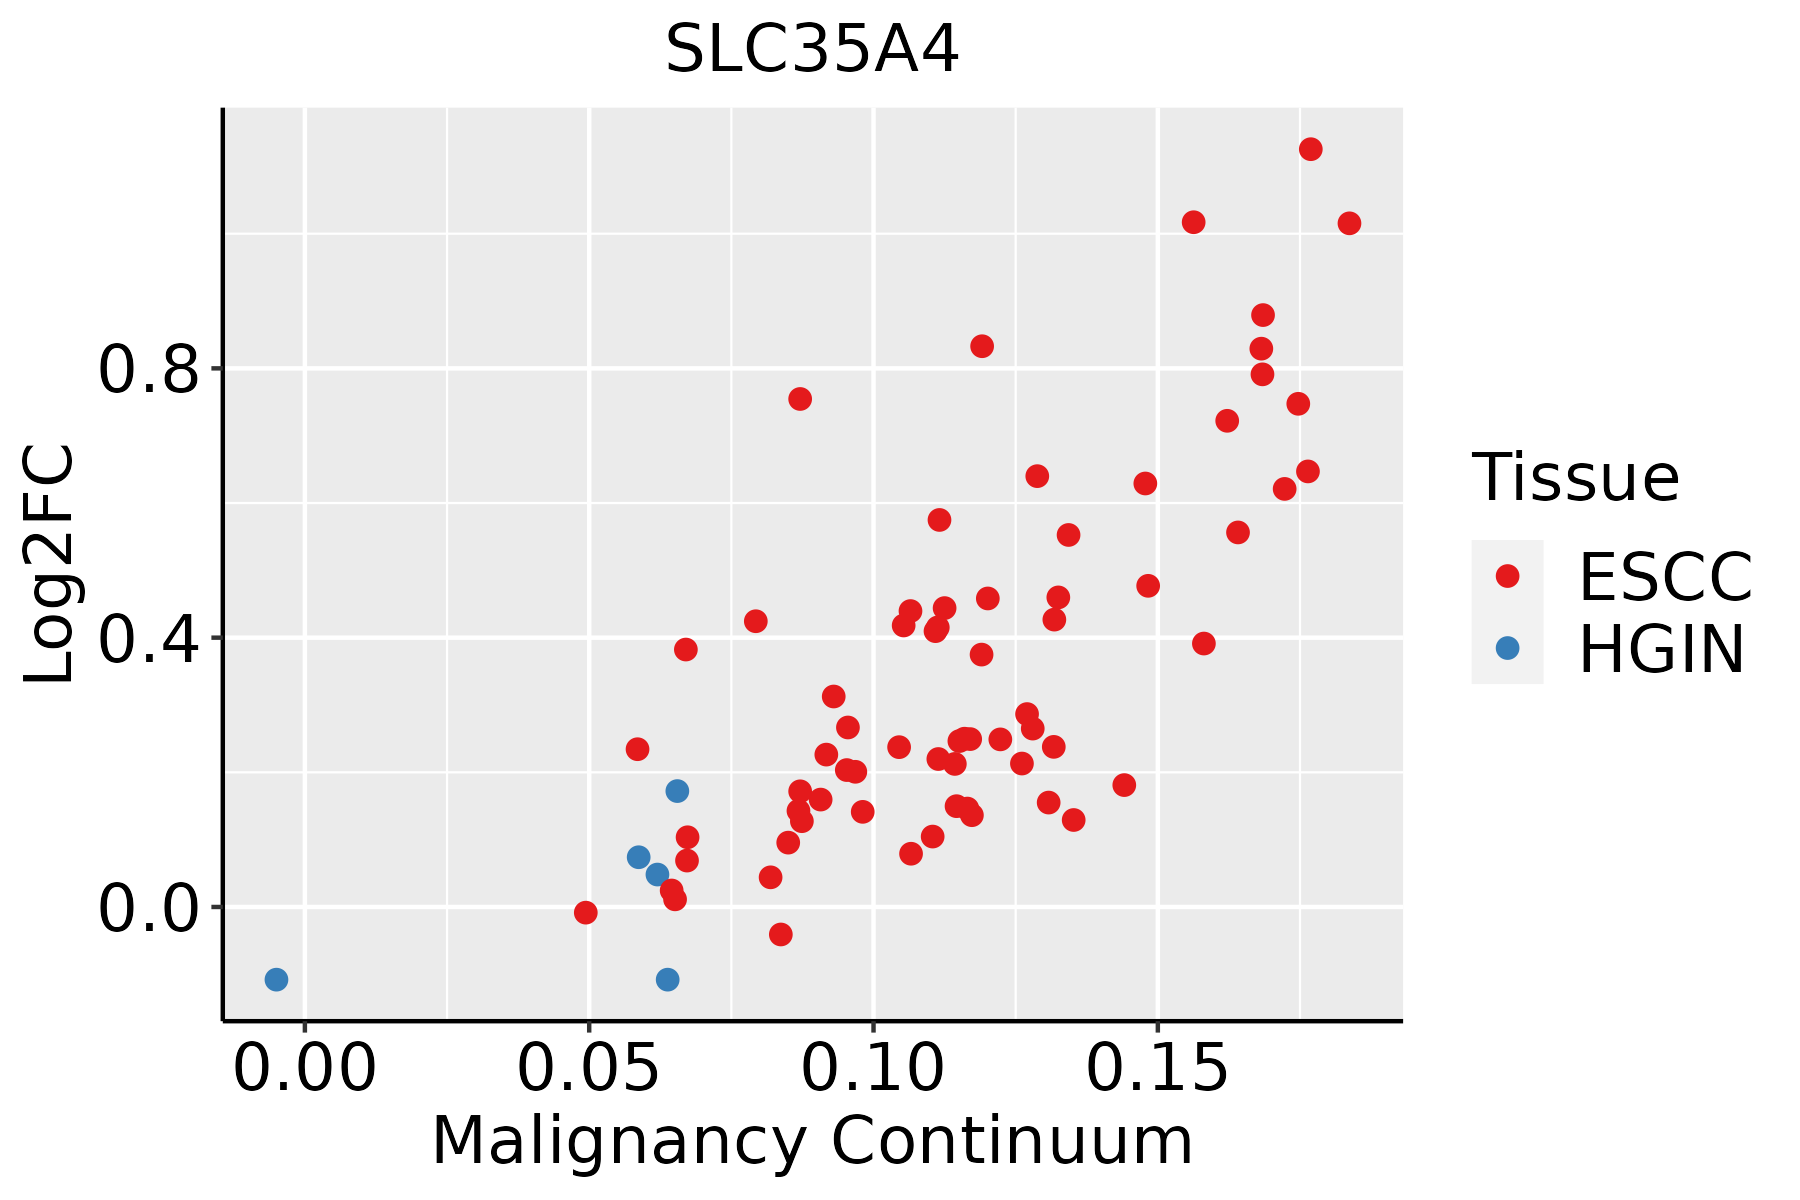 | ESCC: Esophageal squamous cell carcinoma |
| HGIN: High-grade intraepithelial neoplasias | ||
| LGIN: Low-grade intraepithelial neoplasias | ||
| Liver | 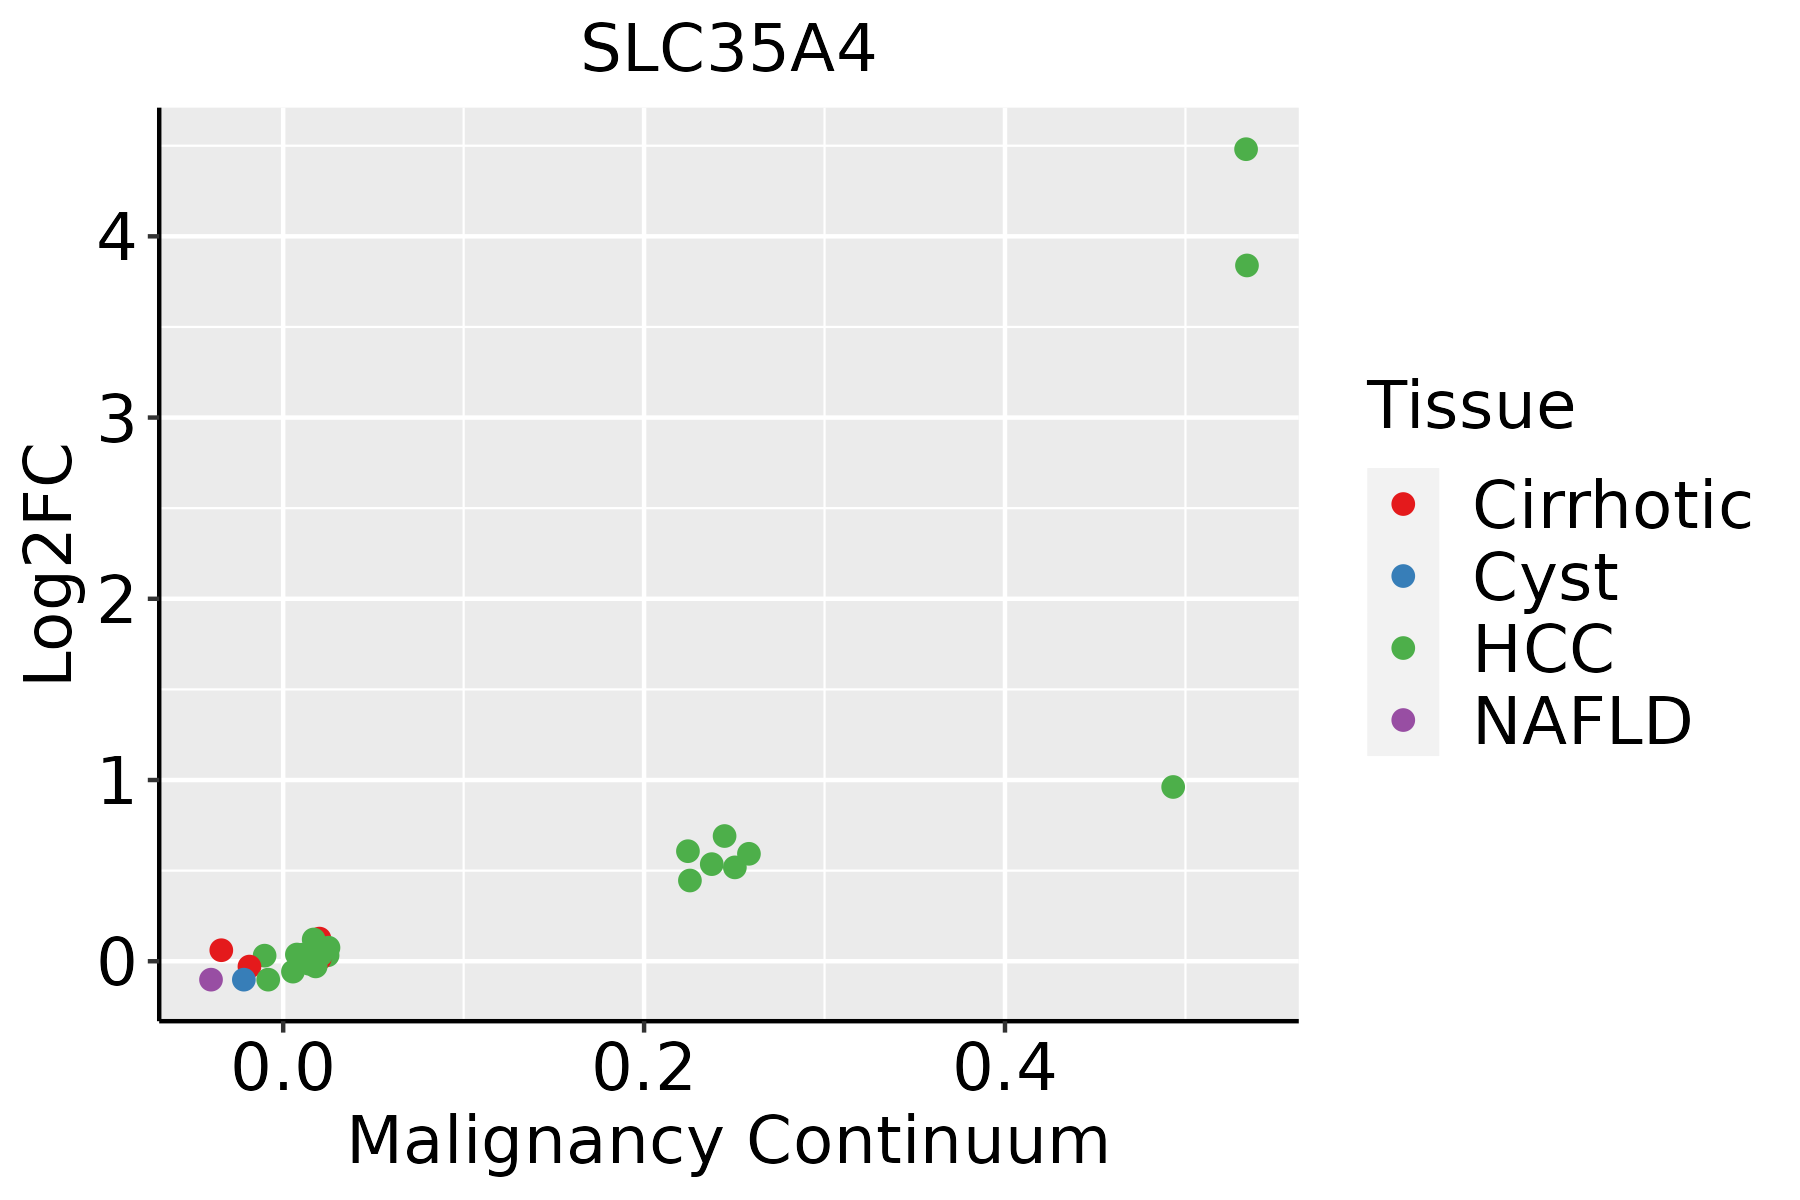 | HCC: Hepatocellular carcinoma |
| NAFLD: Non-alcoholic fatty liver disease | ||
| Oral Cavity | 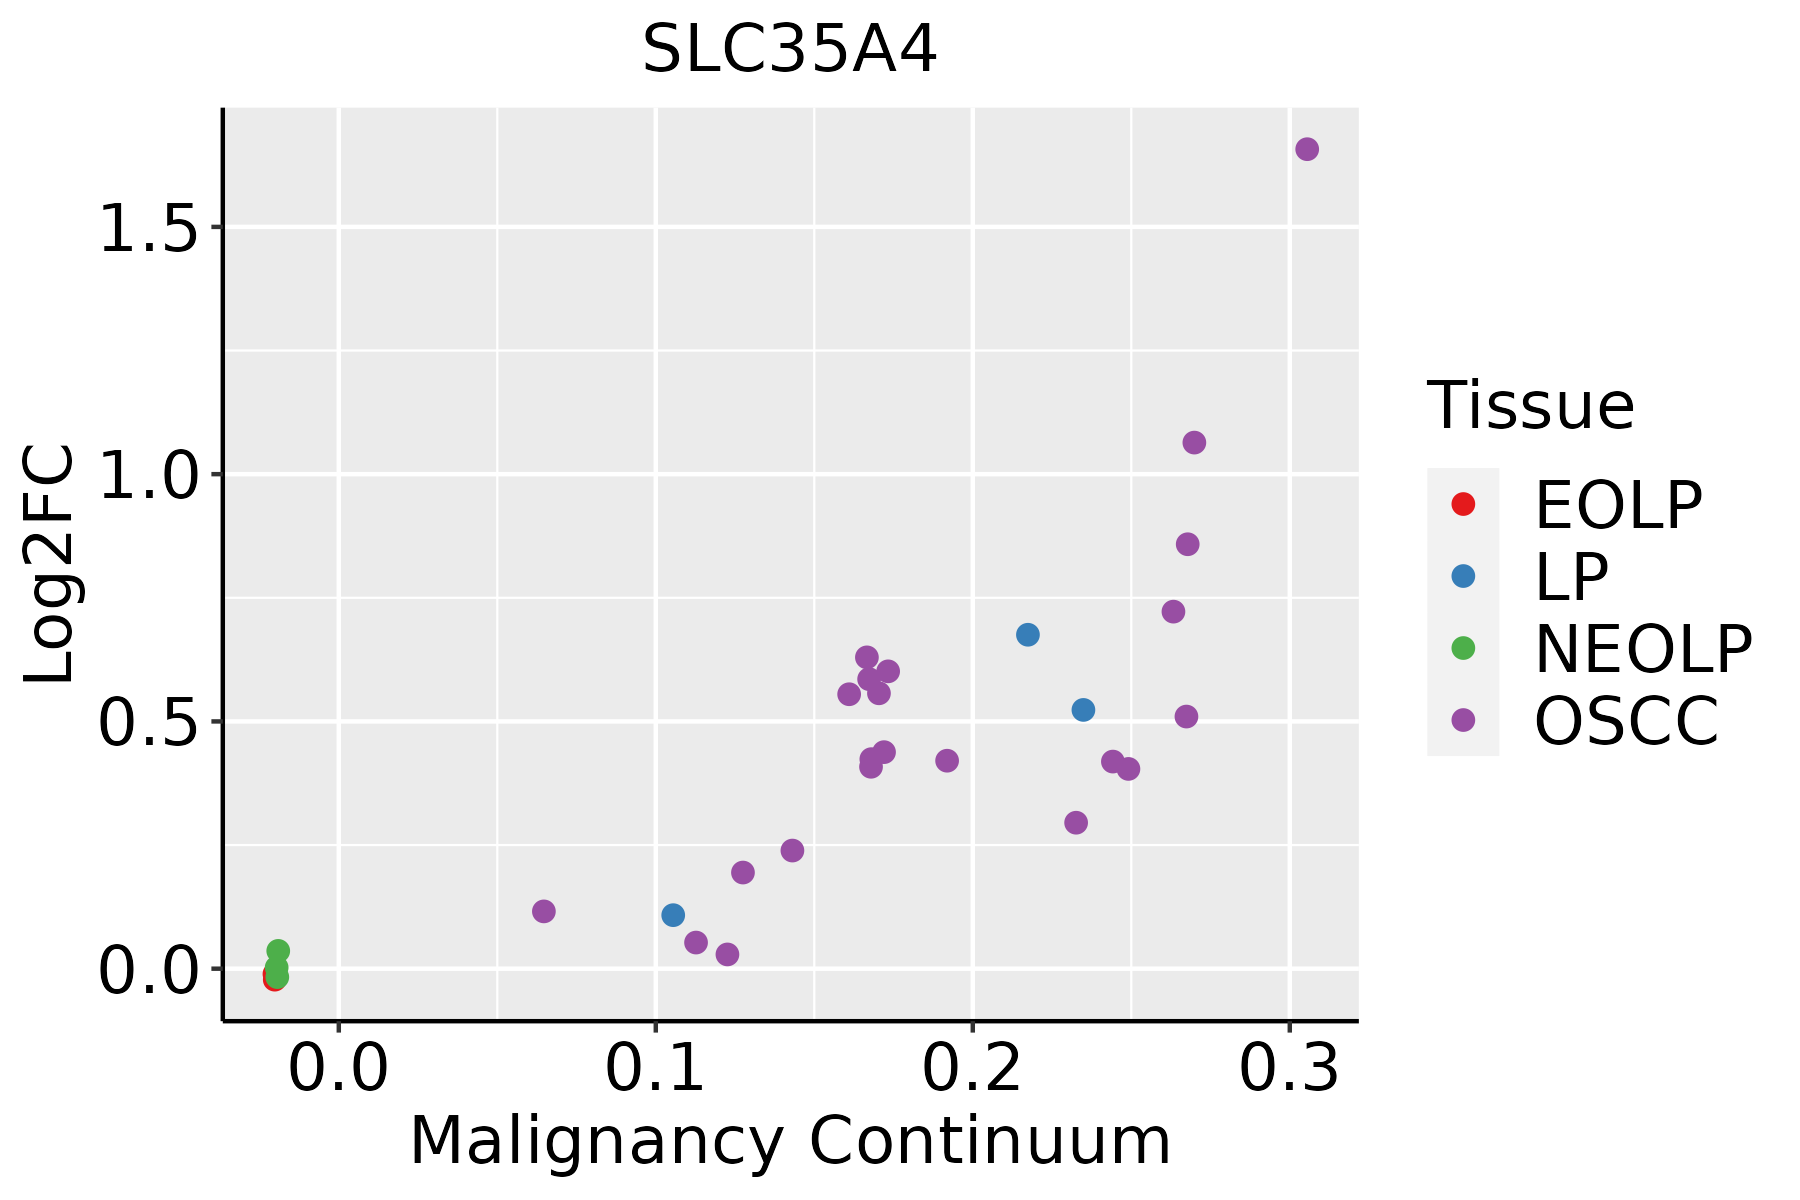 | EOLP: Erosive Oral lichen planus |
| LP: leukoplakia | ||
| NEOLP: Non-erosive oral lichen planus | ||
| OSCC: Oral squamous cell carcinoma | ||
| Skin | 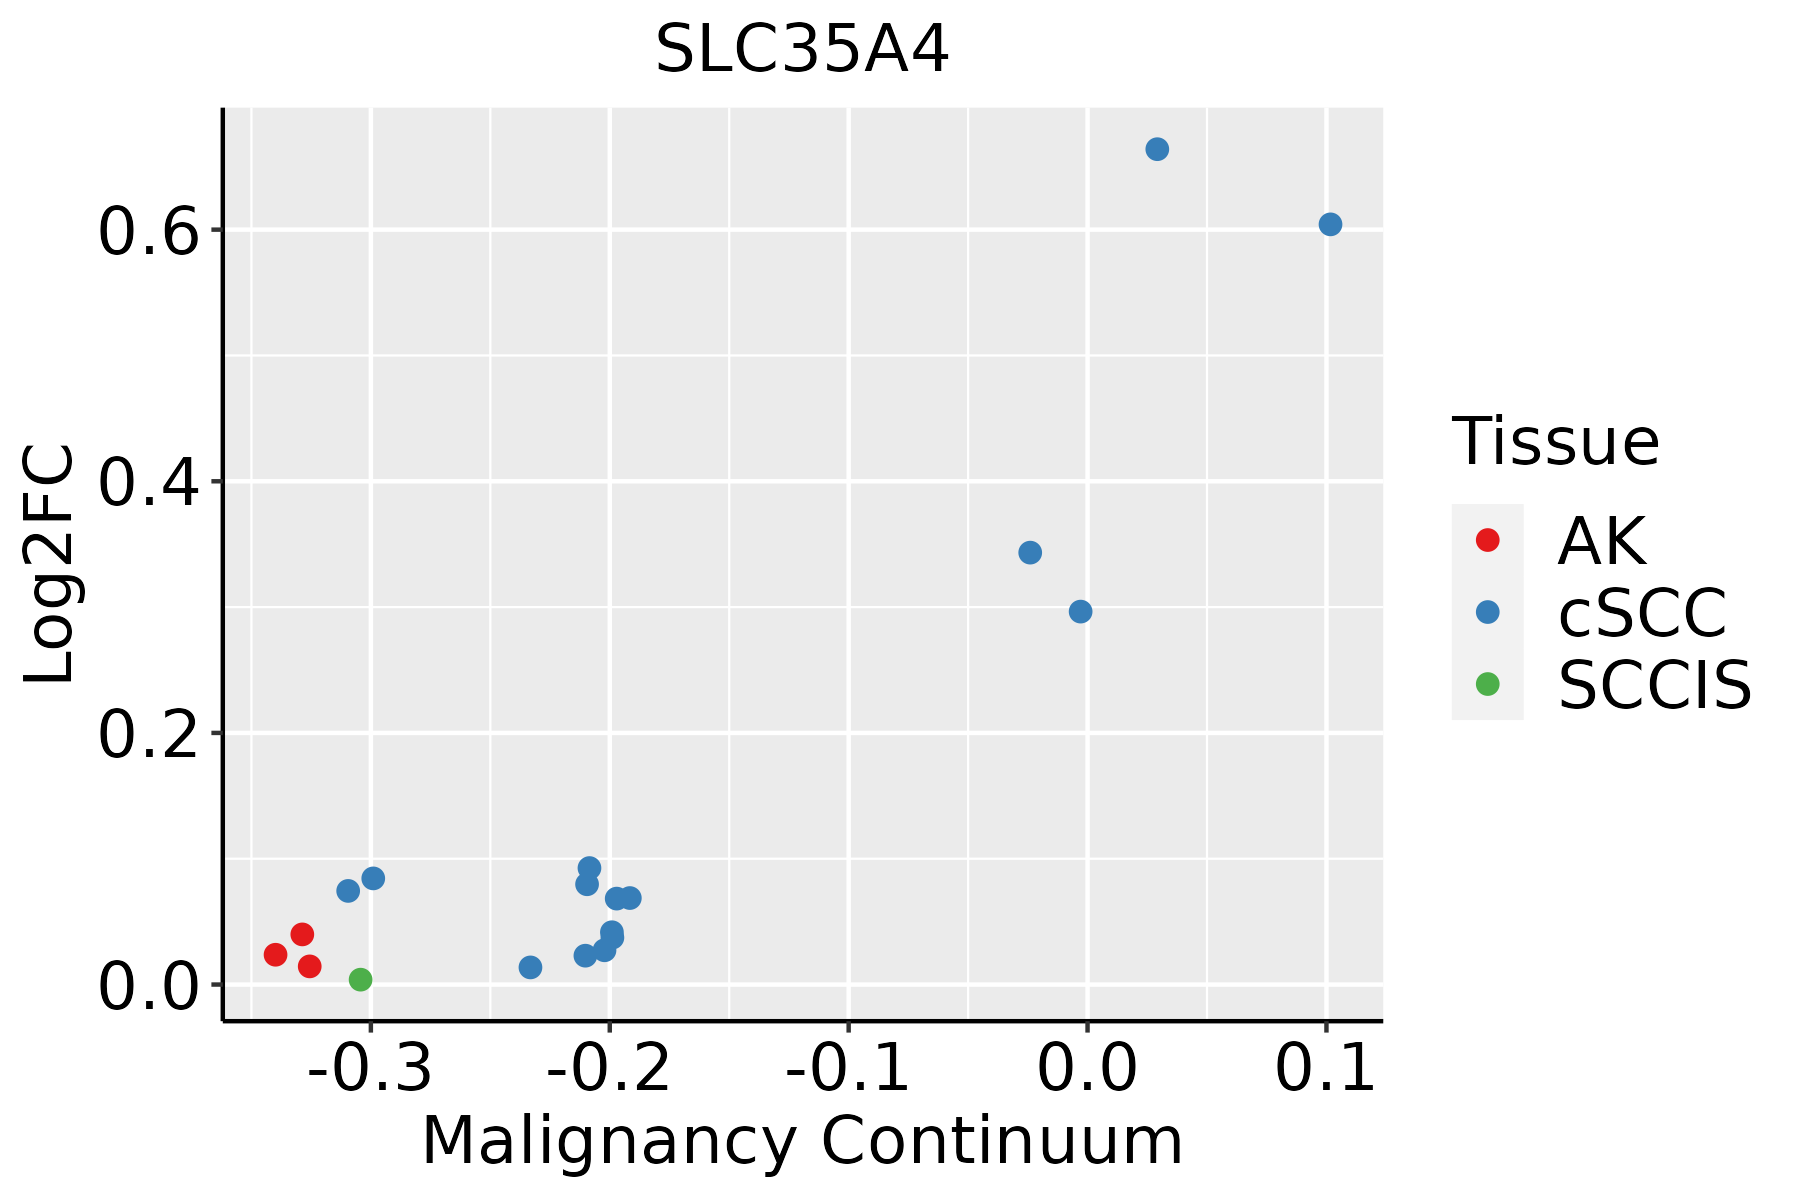 | AK: Actinic keratosis |
| cSCC: Cutaneous squamous cell carcinoma | ||
| SCCIS:squamous cell carcinoma in situ | ||
| Thyroid | 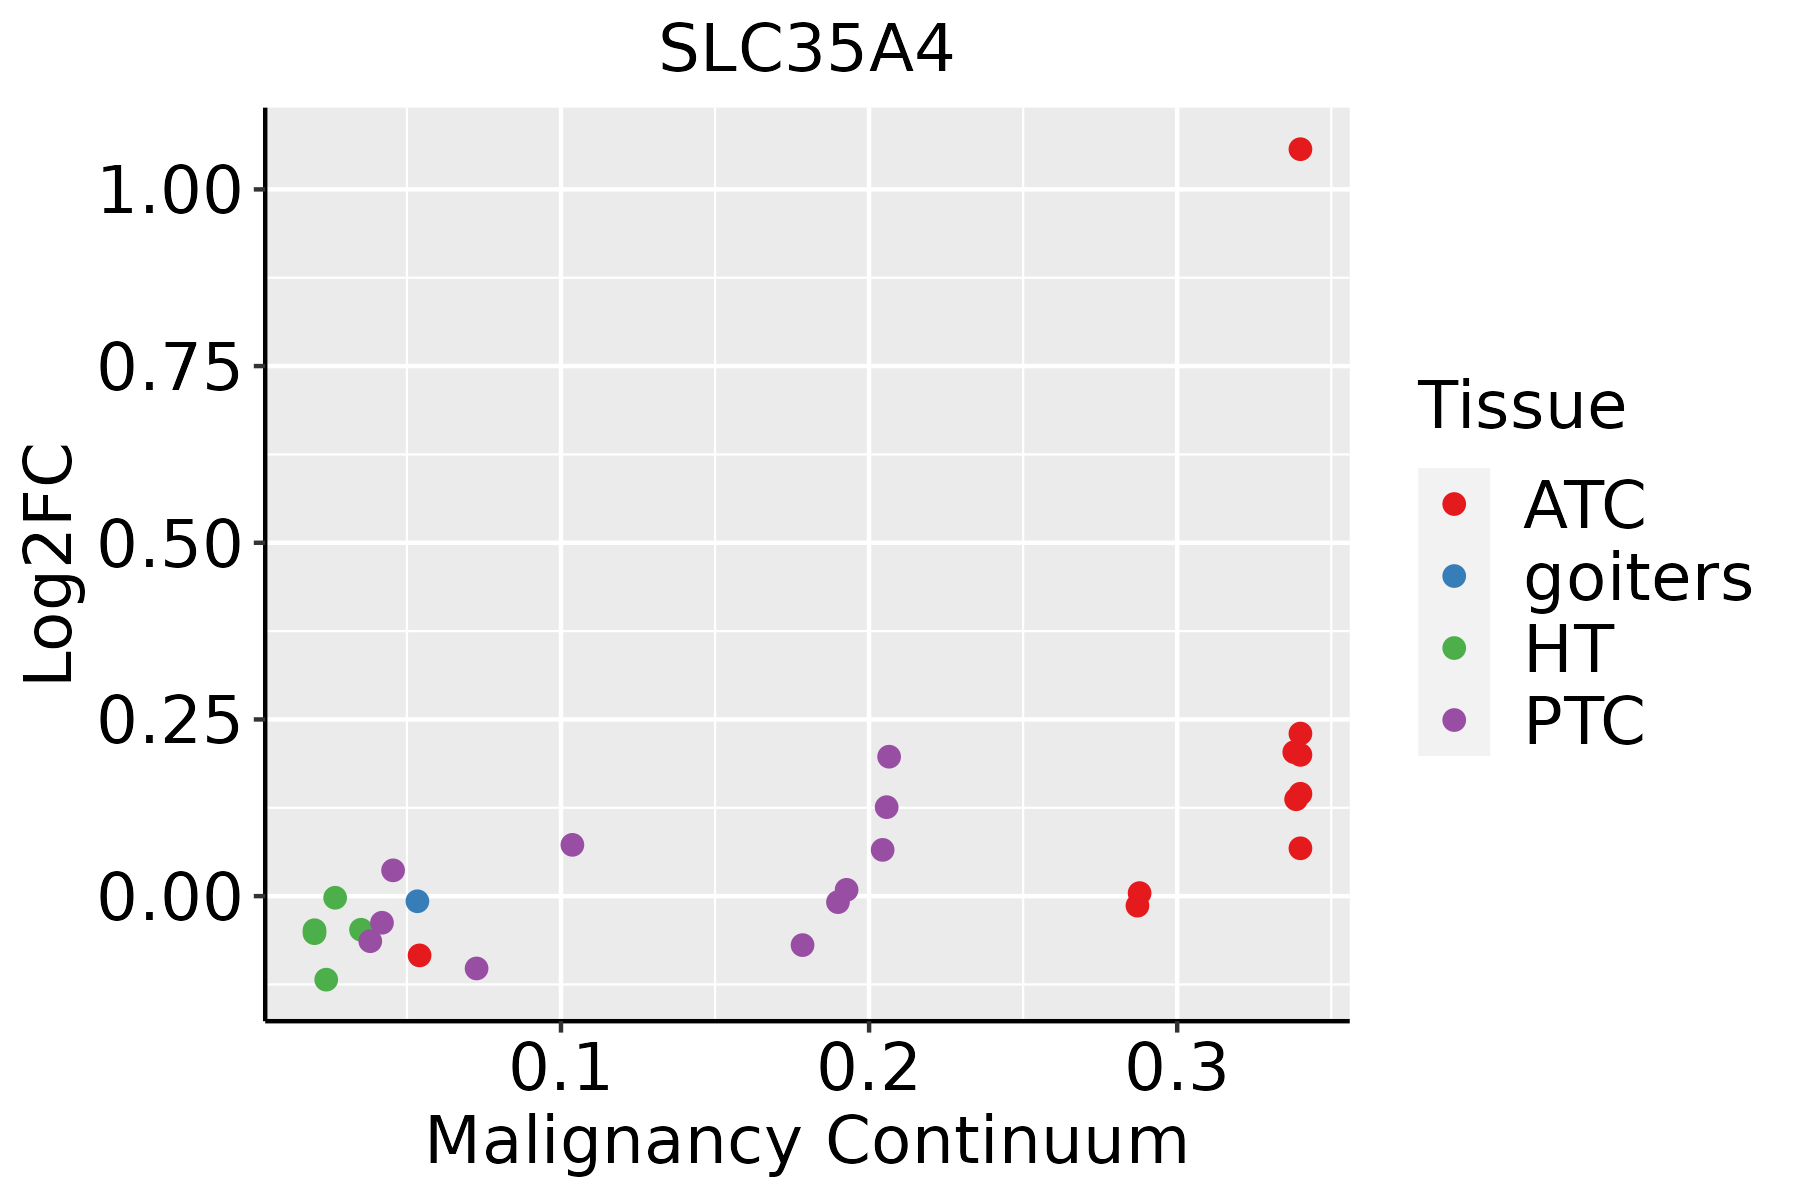 | ATC: Anaplastic thyroid cancer |
| HT: Hashimoto's thyroiditis | ||
| PTC: Papillary thyroid cancer |
| ∗log2FC in expression of this searched gene in stem-like cells from each diseased tissue sample relative to stem-like cells in normal samples in each tissue plotted against the malignancy continuum. Samples are colored based on if they are from different disease stage. |
Top |
Malignant transformation related pathway analysis |
| Find out the enriched GO biological processes and KEGG pathways involved in transition from healthy to precancer to cancer |
| Tissue | Disease Stage | Enriched GO biological Processes |
| Colorectum | AD |  |
| Colorectum | SER |  |
| Colorectum | MSS |  |
| Colorectum | MSI-H |  |
| Colorectum | FAP |  |
| ∗Top 15 enriched GO BP terms are showed in the bar plot of each disease state in each tissue. Each row represents a significant GO biological process which is colored according to the -log10(p.adjust). |
| Page: 1 2 3 4 5 6 7 8 9 |
| GO ID | Tissue | Disease Stage | Description | Gene Ratio | Bg Ratio | pvalue | p.adjust | Count |
| GO:001593117 | Esophagus | ESCC | nucleobase-containing compound transport | 162/8552 | 222/18723 | 9.87e-17 | 7.93e-15 | 162 |
| GO:00159316 | Liver | Cirrhotic | nucleobase-containing compound transport | 87/4634 | 222/18723 | 1.25e-06 | 2.52e-05 | 87 |
| GO:001593111 | Liver | HCC | nucleobase-containing compound transport | 150/7958 | 222/18723 | 3.17e-14 | 2.03e-12 | 150 |
| GO:1901264 | Liver | HCC | carbohydrate derivative transport | 48/7958 | 80/18723 | 1.19e-03 | 6.62e-03 | 48 |
| GO:0008643 | Liver | HCC | carbohydrate transport | 80/7958 | 152/18723 | 7.34e-03 | 2.92e-02 | 80 |
| GO:001593114 | Oral cavity | OSCC | nucleobase-containing compound transport | 150/7305 | 222/18723 | 4.86e-18 | 5.04e-16 | 150 |
| GO:19012642 | Oral cavity | OSCC | carbohydrate derivative transport | 44/7305 | 80/18723 | 2.67e-03 | 1.16e-02 | 44 |
| GO:001593119 | Skin | cSCC | nucleobase-containing compound transport | 105/4864 | 222/18723 | 5.49e-12 | 2.89e-10 | 105 |
| GO:0015931110 | Thyroid | PTC | nucleobase-containing compound transport | 120/5968 | 222/18723 | 5.45e-12 | 2.35e-10 | 120 |
| GO:001593122 | Thyroid | ATC | nucleobase-containing compound transport | 122/6293 | 222/18723 | 4.30e-11 | 1.41e-09 | 122 |
| Page: 1 |
| Pathway ID | Tissue | Disease Stage | Description | Gene Ratio | Bg Ratio | pvalue | p.adjust | qvalue | Count |
| Page: 1 |
Top |
Cell-cell communication analysis |
| Identification of potential cell-cell interactions between two cell types and their ligand-receptor pairs for different disease states |
| Ligand | Receptor | LRpair | Pathway | Tissue | Disease Stage |
| Page: 1 |
Top |
Single-cell gene regulatory network inference analysis |
| Find out the significant the regulons (TFs) and the target genes of each regulon across cell types for different disease states |
| TF | Cell Type | Tissue | Disease Stage | Target Gene | RSS | Regulon Activity |
| ∗The dot plots of a searched regulon are shown for all cell subpopulations in each disease state of each tissue based on the regulon specific score inferred using pySCENIC and by calculating the average expression. |
| Page: 1 |
Top |
Somatic mutation of malignant transformation related genes |
| Annotation of somatic variants for genes involved in malignant transformation |
| Hugo Symbol | Variant Class | Variant Classification | dbSNP RS | HGVSc | HGVSp | HGVSp Short | SWISSPROT | BIOTYPE | SIFT | PolyPhen | Tumor Sample Barcode | Tissue | Histology | Sex | Age | Stage | Therapy Types | Drugs | Outcome |
| SLC35A4 | SNV | Missense_Mutation | c.370G>C | p.Gly124Arg | p.G124R | Q96G79 | protein_coding | deleterious(0.03) | probably_damaging(0.94) | TCGA-B6-A0RS-01 | Breast | breast invasive carcinoma | Female | <65 | I/II | Unknown | Unknown | PD | |
| SLC35A4 | SNV | Missense_Mutation | rs748634741 | c.641G>A | p.Arg214Gln | p.R214Q | Q96G79 | protein_coding | tolerated(0.69) | benign(0.011) | TCGA-EA-A5FO-01 | Cervix | cervical & endocervical cancer | Female | <65 | I/II | Unknown | Unknown | SD |
| SLC35A4 | SNV | Missense_Mutation | c.4N>T | p.Ser2Cys | p.S2C | Q96G79 | protein_coding | deleterious_low_confidence(0.01) | benign(0.221) | TCGA-AA-A029-01 | Colorectum | colon adenocarcinoma | Male | >=65 | I/II | Unknown | Unknown | SD | |
| SLC35A4 | SNV | Missense_Mutation | c.374G>A | p.Ser125Asn | p.S125N | Q96G79 | protein_coding | deleterious(0.01) | probably_damaging(0.998) | TCGA-D5-5538-01 | Colorectum | colon adenocarcinoma | Female | <65 | III/IV | Chemotherapy | calcium | PD | |
| SLC35A4 | insertion | Frame_Shift_Ins | novel | c.59_60insATTG | p.Met22ProfsTer38 | p.M22Pfs*38 | Q96G79 | protein_coding | TCGA-AM-5820-01 | Colorectum | colon adenocarcinoma | Female | <65 | I/II | Unknown | Unknown | SD | ||
| SLC35A4 | SNV | Missense_Mutation | rs770449710 | c.557N>T | p.Pro186Leu | p.P186L | Q96G79 | protein_coding | tolerated(1) | benign(0.013) | TCGA-A5-A0G3-01 | Endometrium | uterine corpus endometrioid carcinoma | Female | <65 | III/IV | Chemotherapy | carboplatin | PD |
| SLC35A4 | SNV | Missense_Mutation | c.713N>T | p.Gly238Val | p.G238V | Q96G79 | protein_coding | tolerated(0.5) | benign(0.261) | TCGA-A5-A0VQ-01 | Endometrium | uterine corpus endometrioid carcinoma | Female | <65 | I/II | Chemotherapy | carboplatin | SD | |
| SLC35A4 | SNV | Missense_Mutation | rs775619051 | c.971G>A | p.Arg324His | p.R324H | Q96G79 | protein_coding | tolerated_low_confidence(0.46) | benign(0) | TCGA-A5-A1OF-01 | Endometrium | uterine corpus endometrioid carcinoma | Female | <65 | I/II | Unknown | Unknown | SD |
| SLC35A4 | SNV | Missense_Mutation | rs201059756 | c.962N>G | p.Tyr321Cys | p.Y321C | Q96G79 | protein_coding | deleterious(0.01) | probably_damaging(0.997) | TCGA-AX-A06H-01 | Endometrium | uterine corpus endometrioid carcinoma | Female | <65 | III/IV | Chemotherapy | paclitaxel | SD |
| SLC35A4 | SNV | Missense_Mutation | novel | c.485A>G | p.Gln162Arg | p.Q162R | Q96G79 | protein_coding | tolerated(0.53) | benign(0.031) | TCGA-B5-A3FA-01 | Endometrium | uterine corpus endometrioid carcinoma | Female | >=65 | I/II | Unknown | Unknown | SD |
| Page: 1 2 3 4 |
Top |
Related drugs of malignant transformation related genes |
| Identification of chemicals and drugs interact with genes involved in malignant transfromation |
| (DGIdb 4.0) |
| Entrez ID | Symbol | Category | Interaction Types | Drug Claim Name | Drug Name | PMIDs |
| Page: 1 |

Copyright 2023-Present -The University of Texas Health Science Center at Houston |