
|
|||||
|
 | |
| |
| |
| |
| |
| |
|
Gene: SLC35A3 |
Gene summary for SLC35A3 |
| Gene information | Species | Human | Gene symbol | SLC35A3 | Gene ID | 23443 |
| Gene name | solute carrier family 35 member A3 | |
| Gene Alias | AMRS | |
| Cytomap | 1p21.2 | |
| Gene Type | protein-coding | GO ID | GO:0006040 | UniProtAcc | Q9Y2D2 |
Top |
Malignant transformation analysis |
| Identification of the aberrant gene expression in precancerous and cancerous lesions by comparing the gene expression of stem-like cells in diseased tissues with normal stem cells |
| Entrez ID | Symbol | Replicates | Species | Organ | Tissue | Adj P-value | Log2FC | Malignancy |
| 23443 | SLC35A3 | HTA11_3410_2000001011 | Human | Colorectum | AD | 5.59e-25 | 4.39e-01 | 0.0155 |
| 23443 | SLC35A3 | HTA11_2487_2000001011 | Human | Colorectum | SER | 3.57e-45 | 1.07e+00 | -0.1808 |
| 23443 | SLC35A3 | HTA11_2951_2000001011 | Human | Colorectum | AD | 3.22e-05 | 3.34e-01 | 0.0216 |
| 23443 | SLC35A3 | HTA11_1938_2000001011 | Human | Colorectum | AD | 3.38e-55 | 1.31e+00 | -0.0811 |
| 23443 | SLC35A3 | HTA11_78_2000001011 | Human | Colorectum | AD | 1.42e-52 | 1.22e+00 | -0.1088 |
| 23443 | SLC35A3 | HTA11_347_2000001011 | Human | Colorectum | AD | 4.33e-114 | 1.90e+00 | -0.1954 |
| 23443 | SLC35A3 | HTA11_411_2000001011 | Human | Colorectum | SER | 3.87e-32 | 1.95e+00 | -0.2602 |
| 23443 | SLC35A3 | HTA11_2112_2000001011 | Human | Colorectum | SER | 1.67e-23 | 1.42e+00 | -0.2196 |
| 23443 | SLC35A3 | HTA11_3361_2000001011 | Human | Colorectum | AD | 2.32e-29 | 7.71e-01 | -0.1207 |
| 23443 | SLC35A3 | HTA11_83_2000001011 | Human | Colorectum | SER | 9.48e-25 | 7.88e-01 | -0.1526 |
| 23443 | SLC35A3 | HTA11_696_2000001011 | Human | Colorectum | AD | 7.32e-62 | 1.13e+00 | -0.1464 |
| 23443 | SLC35A3 | HTA11_866_2000001011 | Human | Colorectum | AD | 1.36e-60 | 9.83e-01 | -0.1001 |
| 23443 | SLC35A3 | HTA11_1391_2000001011 | Human | Colorectum | AD | 4.26e-50 | 1.06e+00 | -0.059 |
| 23443 | SLC35A3 | HTA11_2992_2000001011 | Human | Colorectum | SER | 1.02e-19 | 9.55e-01 | -0.1706 |
| 23443 | SLC35A3 | HTA11_5212_2000001011 | Human | Colorectum | AD | 1.35e-23 | 1.10e+00 | -0.2061 |
| 23443 | SLC35A3 | HTA11_5216_2000001011 | Human | Colorectum | SER | 1.84e-10 | 6.94e-01 | -0.1462 |
| 23443 | SLC35A3 | HTA11_546_2000001011 | Human | Colorectum | AD | 4.93e-28 | 8.59e-01 | -0.0842 |
| 23443 | SLC35A3 | HTA11_9341_2000001011 | Human | Colorectum | SER | 1.20e-07 | 5.04e-01 | -0.00410000000000005 |
| 23443 | SLC35A3 | HTA11_7862_2000001011 | Human | Colorectum | AD | 1.43e-25 | 8.54e-01 | -0.0179 |
| 23443 | SLC35A3 | HTA11_866_3004761011 | Human | Colorectum | AD | 6.44e-22 | 4.62e-01 | 0.096 |
| Page: 1 2 3 4 5 6 7 |
| Tissue | Expression Dynamics | Abbreviation |
| Colorectum (GSE201348) |  | FAP: Familial adenomatous polyposis |
| CRC: Colorectal cancer | ||
| Colorectum (HTA11) |  | AD: Adenomas |
| SER: Sessile serrated lesions | ||
| MSI-H: Microsatellite-high colorectal cancer | ||
| MSS: Microsatellite stable colorectal cancer | ||
| Esophagus | 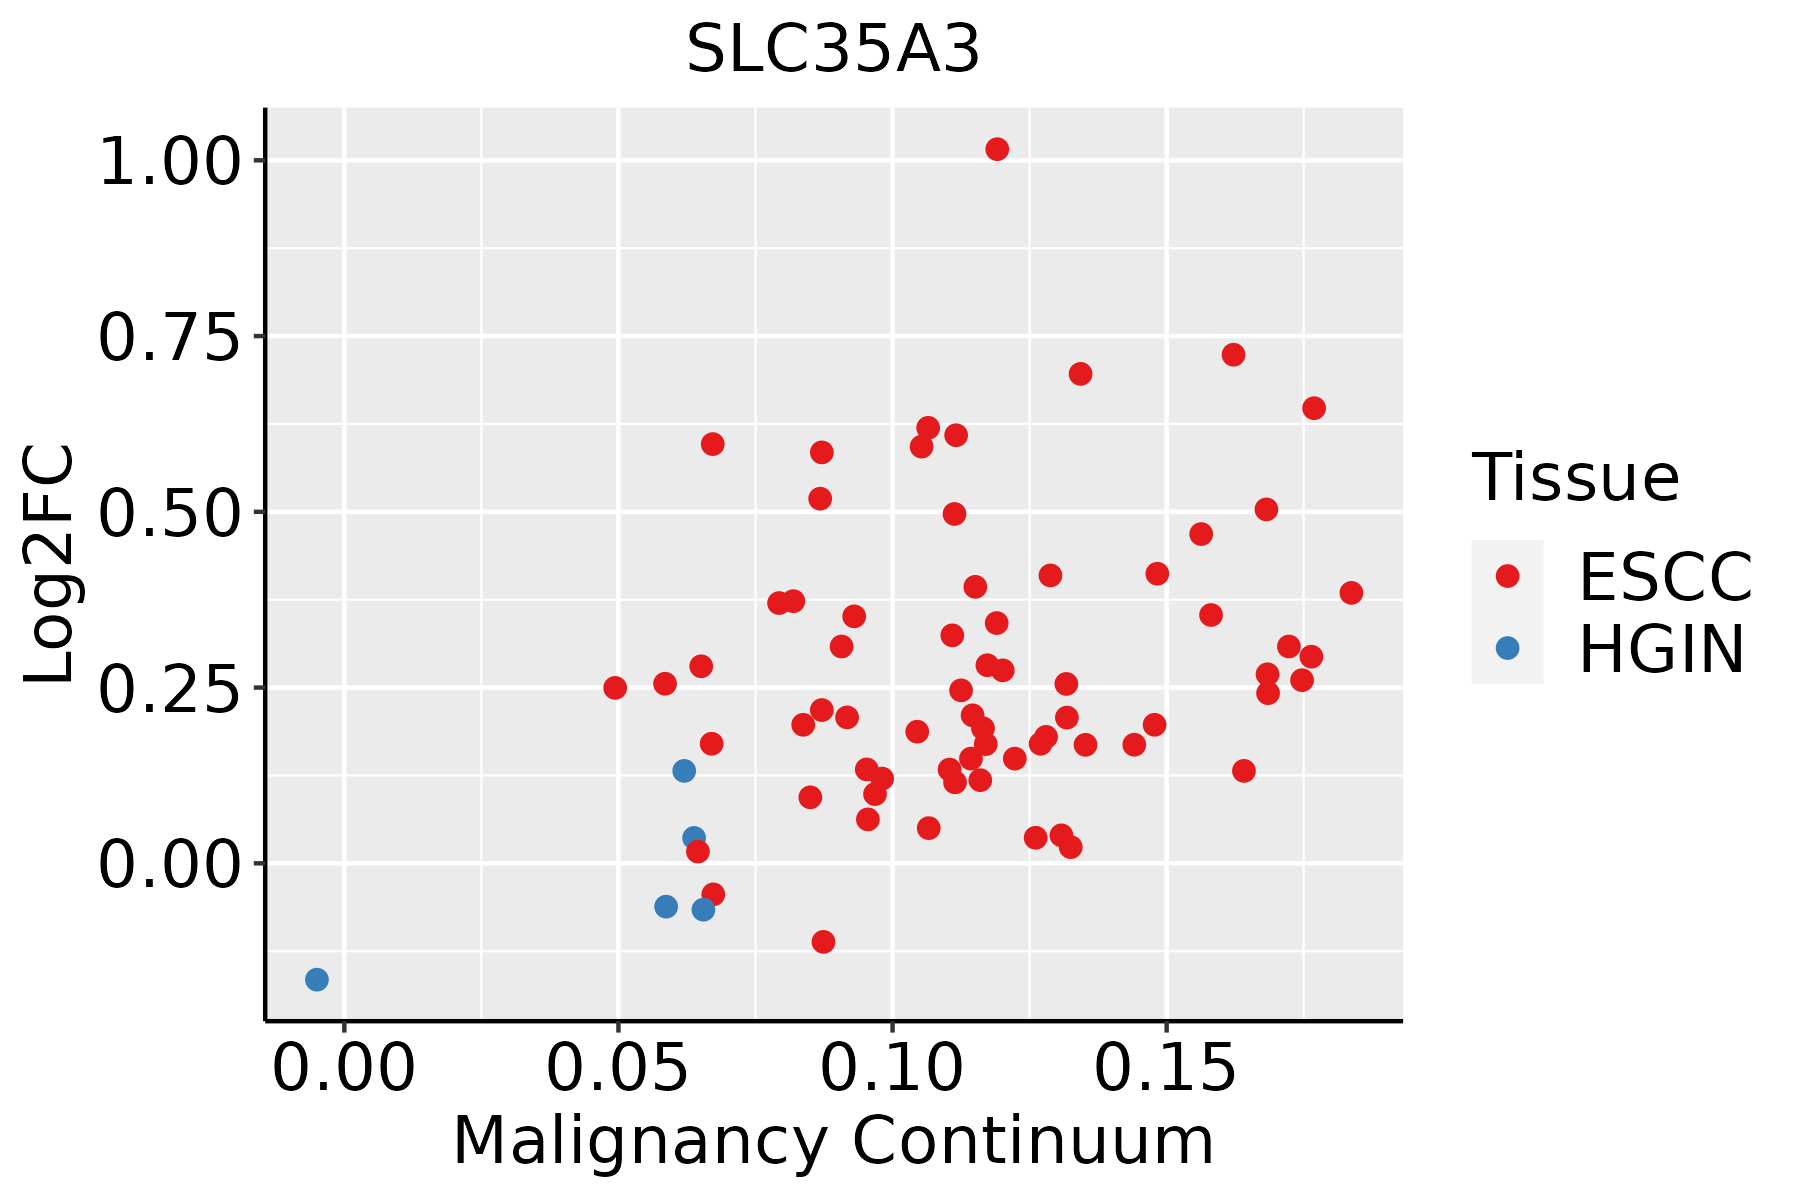 | ESCC: Esophageal squamous cell carcinoma |
| HGIN: High-grade intraepithelial neoplasias | ||
| LGIN: Low-grade intraepithelial neoplasias | ||
| Liver |  | HCC: Hepatocellular carcinoma |
| NAFLD: Non-alcoholic fatty liver disease | ||
| Oral Cavity | 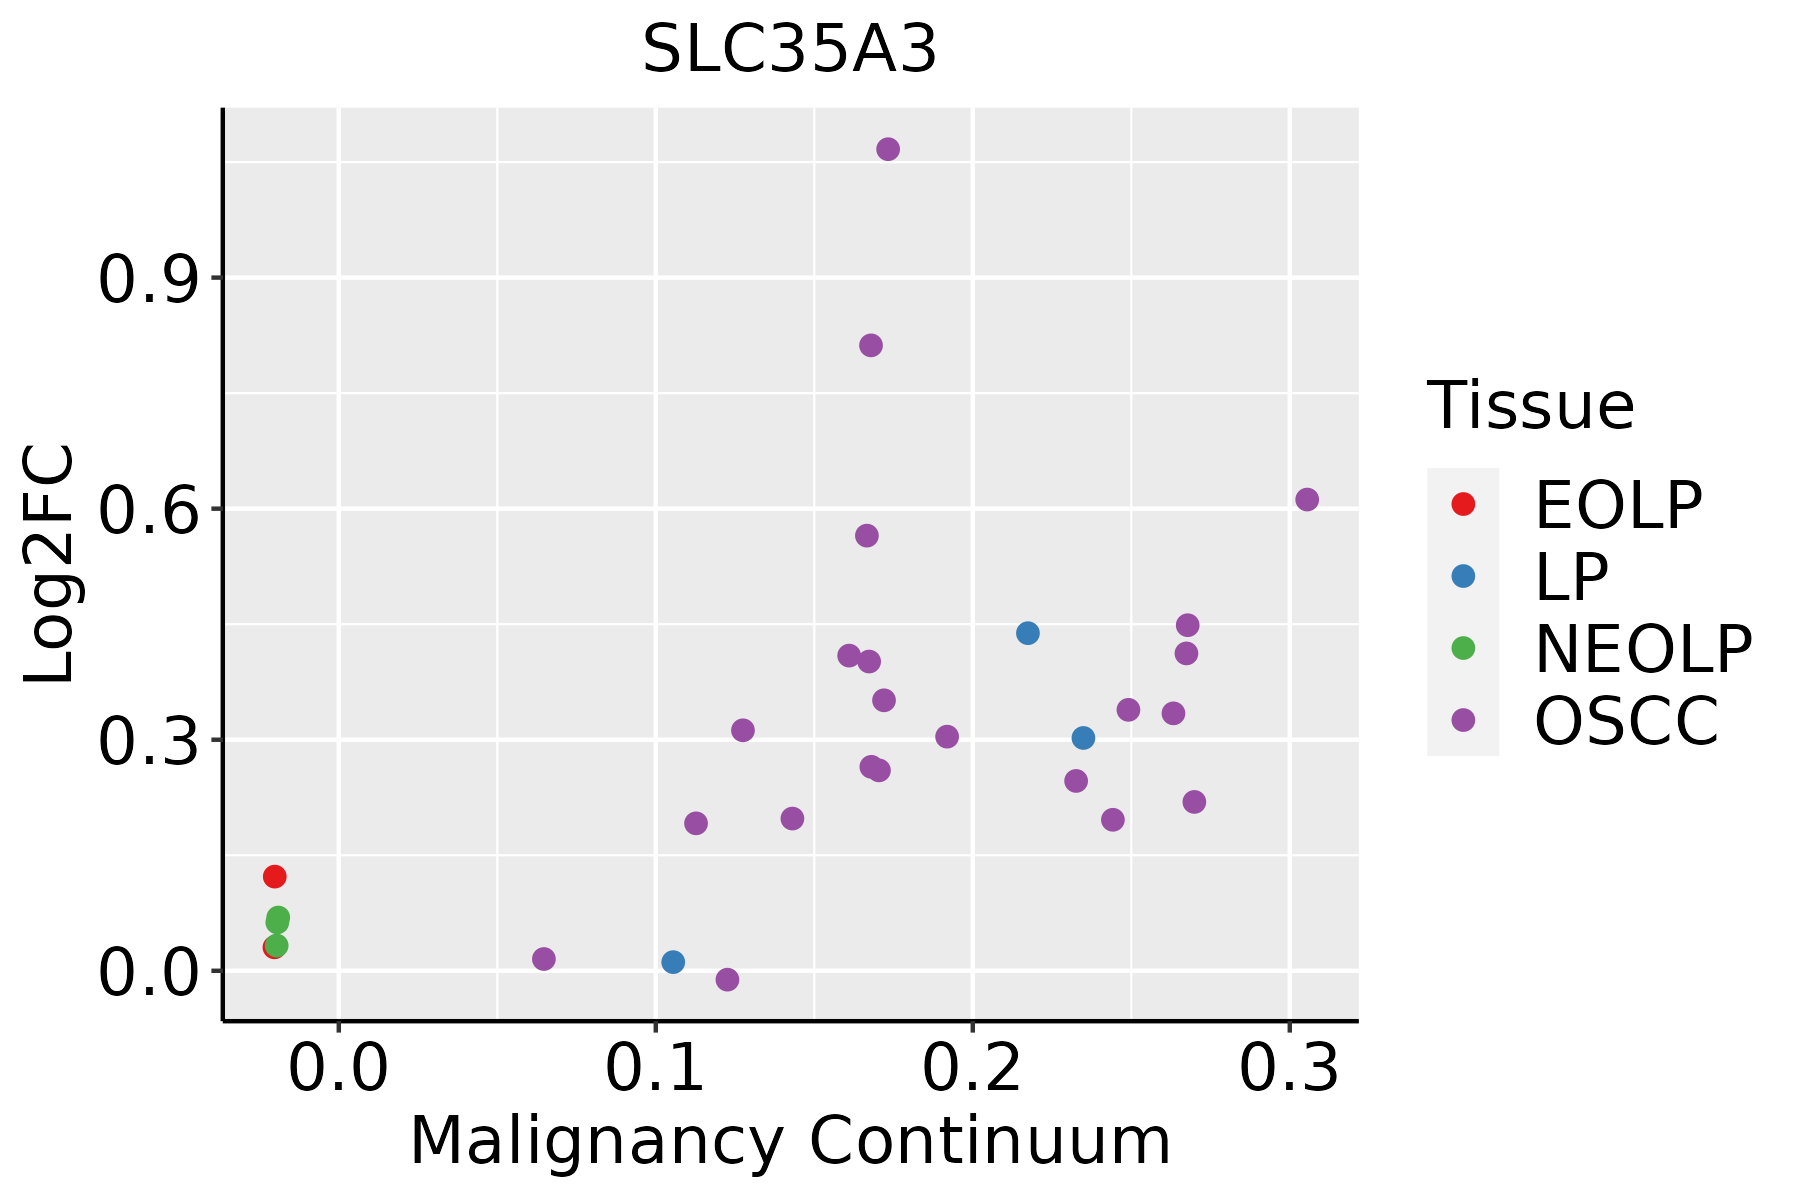 | EOLP: Erosive Oral lichen planus |
| LP: leukoplakia | ||
| NEOLP: Non-erosive oral lichen planus | ||
| OSCC: Oral squamous cell carcinoma | ||
| Prostate | 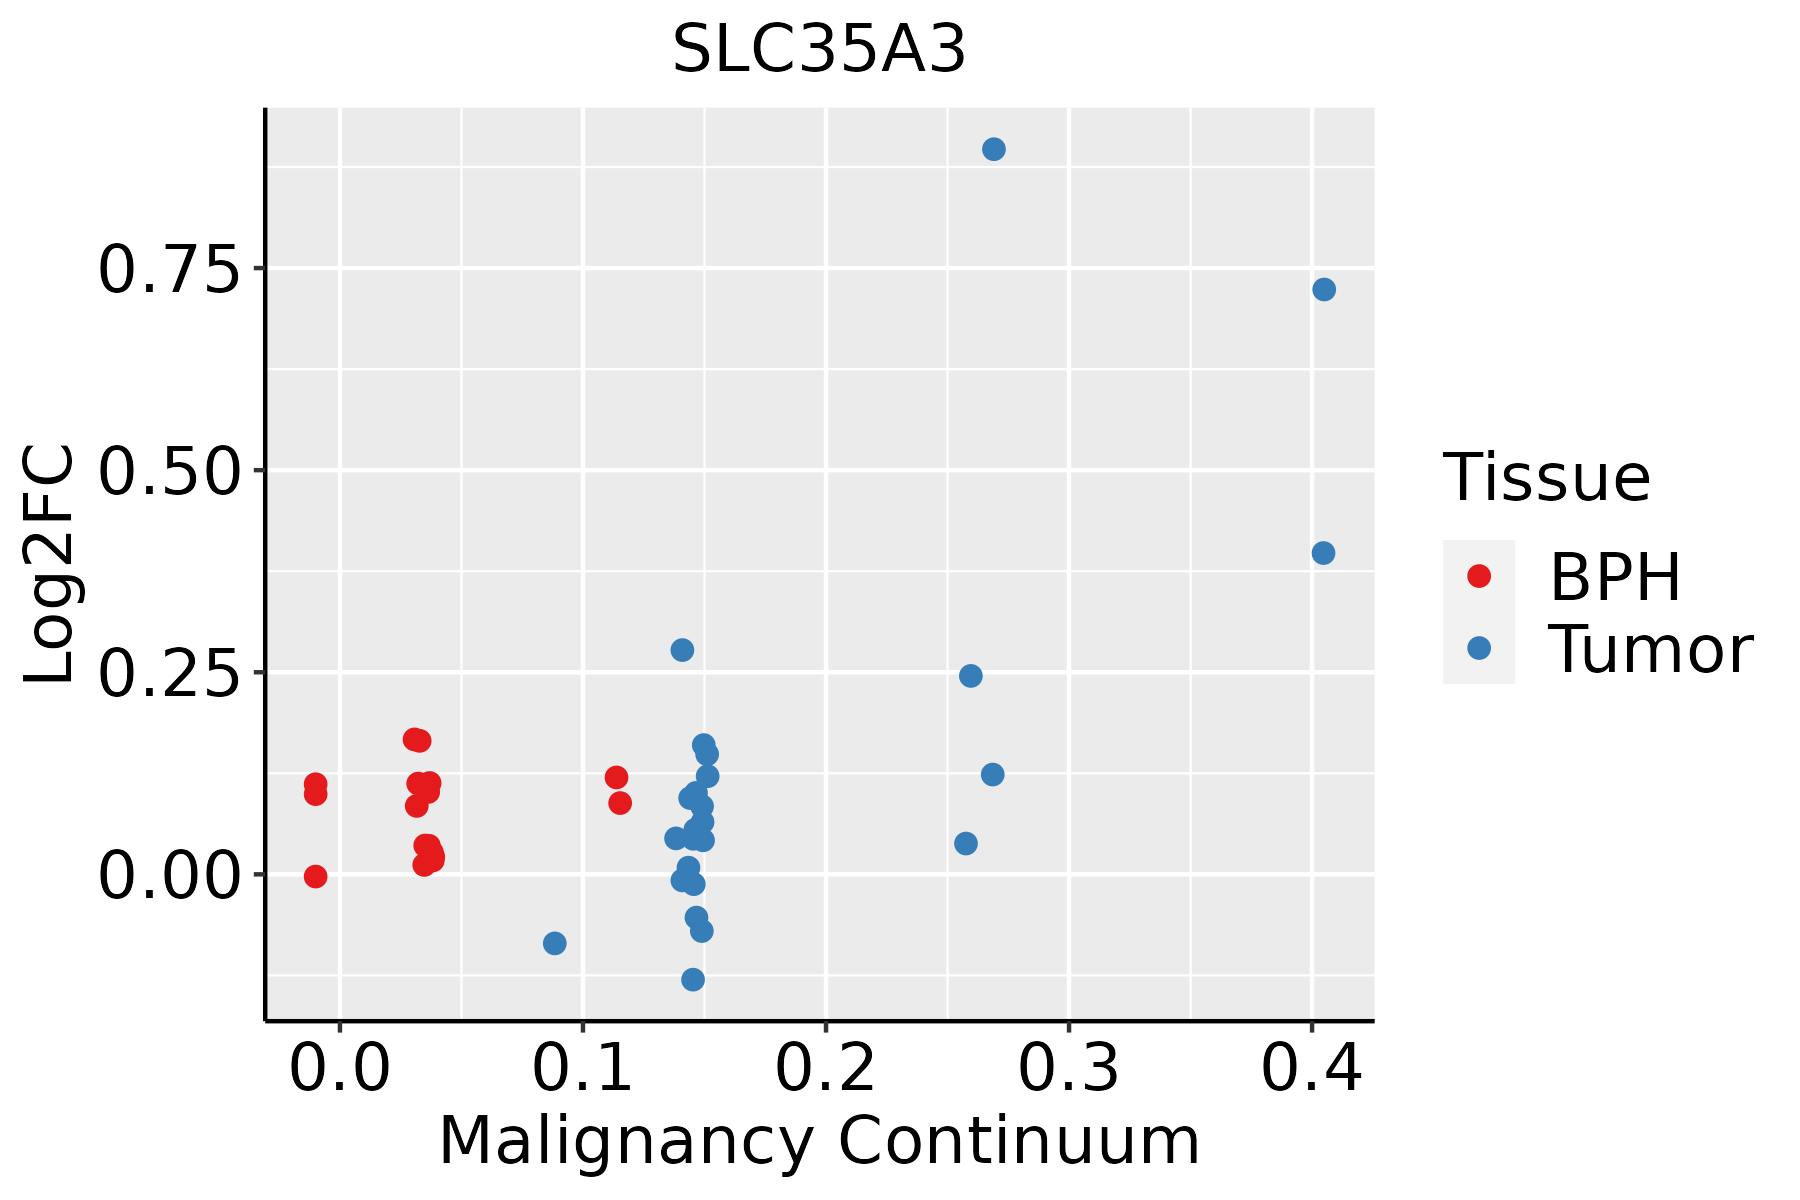 | BPH: Benign Prostatic Hyperplasia |
| Skin | 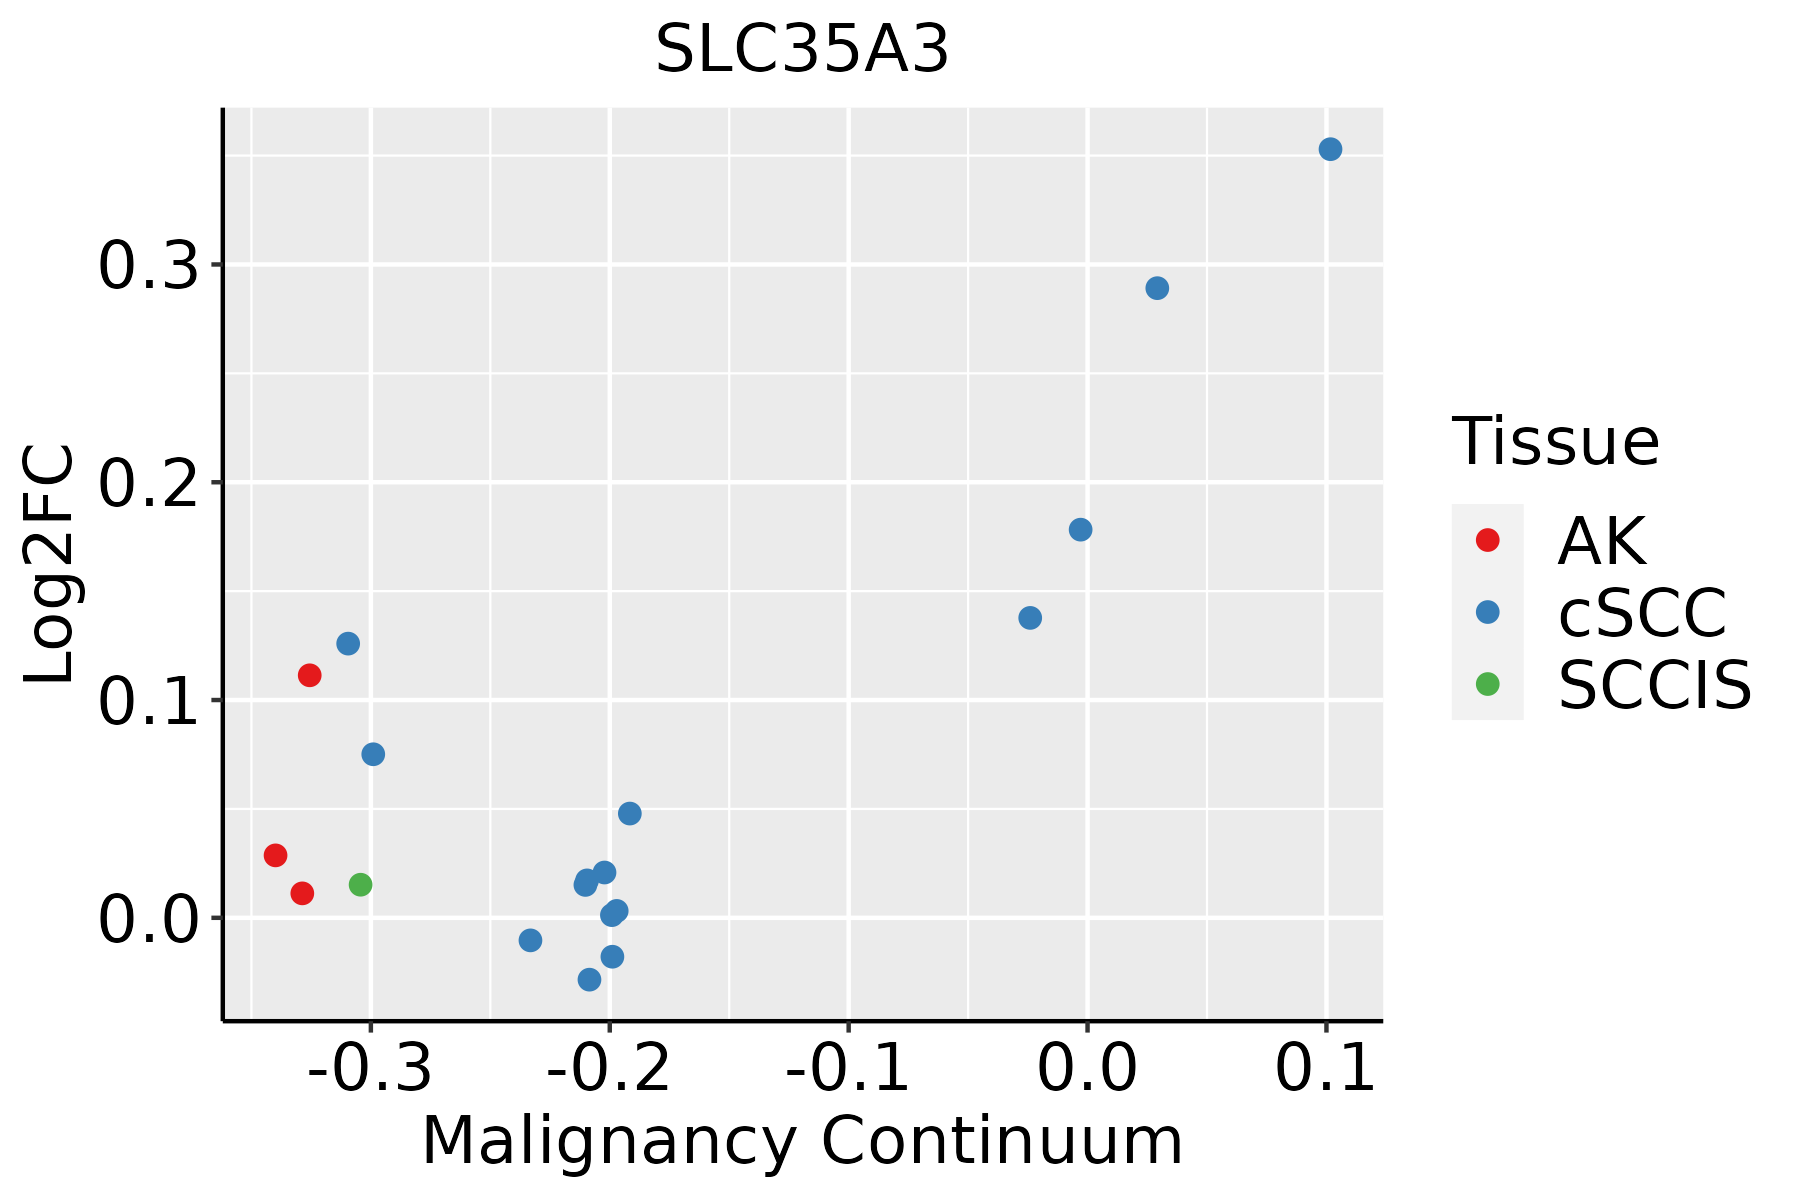 | AK: Actinic keratosis |
| cSCC: Cutaneous squamous cell carcinoma | ||
| SCCIS:squamous cell carcinoma in situ | ||
| Thyroid |  | ATC: Anaplastic thyroid cancer |
| HT: Hashimoto's thyroiditis | ||
| PTC: Papillary thyroid cancer |
| ∗log2FC in expression of this searched gene in stem-like cells from each diseased tissue sample relative to stem-like cells in normal samples in each tissue plotted against the malignancy continuum. Samples are colored based on if they are from different disease stage. |
Top |
Malignant transformation related pathway analysis |
| Find out the enriched GO biological processes and KEGG pathways involved in transition from healthy to precancer to cancer |
| Tissue | Disease Stage | Enriched GO biological Processes |
| Colorectum | AD |  |
| Colorectum | SER |  |
| Colorectum | MSS |  |
| Colorectum | MSI-H |  |
| Colorectum | FAP |  |
| ∗Top 15 enriched GO BP terms are showed in the bar plot of each disease state in each tissue. Each row represents a significant GO biological process which is colored according to the -log10(p.adjust). |
| Page: 1 2 3 4 5 6 7 8 9 |
| GO ID | Tissue | Disease Stage | Description | Gene Ratio | Bg Ratio | pvalue | p.adjust | Count |
| GO:0015931 | Colorectum | AD | nucleobase-containing compound transport | 73/3918 | 222/18723 | 2.02e-05 | 4.10e-04 | 73 |
| GO:0009225 | Colorectum | AD | nucleotide-sugar metabolic process | 16/3918 | 36/18723 | 1.27e-03 | 1.12e-02 | 16 |
| GO:00159311 | Colorectum | SER | nucleobase-containing compound transport | 54/2897 | 222/18723 | 3.65e-04 | 5.67e-03 | 54 |
| GO:00092251 | Colorectum | SER | nucleotide-sugar metabolic process | 12/2897 | 36/18723 | 6.11e-03 | 4.42e-02 | 12 |
| GO:00159312 | Colorectum | MSS | nucleobase-containing compound transport | 70/3467 | 222/18723 | 1.92e-06 | 6.01e-05 | 70 |
| GO:00092252 | Colorectum | MSS | nucleotide-sugar metabolic process | 14/3467 | 36/18723 | 3.40e-03 | 2.56e-02 | 14 |
| GO:00159313 | Colorectum | MSI-H | nucleobase-containing compound transport | 30/1319 | 222/18723 | 4.45e-04 | 9.50e-03 | 30 |
| GO:001593117 | Esophagus | ESCC | nucleobase-containing compound transport | 162/8552 | 222/18723 | 9.87e-17 | 7.93e-15 | 162 |
| GO:00092256 | Esophagus | ESCC | nucleotide-sugar metabolic process | 29/8552 | 36/18723 | 1.91e-05 | 1.67e-04 | 29 |
| GO:00159316 | Liver | Cirrhotic | nucleobase-containing compound transport | 87/4634 | 222/18723 | 1.25e-06 | 2.52e-05 | 87 |
| GO:001593111 | Liver | HCC | nucleobase-containing compound transport | 150/7958 | 222/18723 | 3.17e-14 | 2.03e-12 | 150 |
| GO:00092254 | Liver | HCC | nucleotide-sugar metabolic process | 25/7958 | 36/18723 | 9.87e-04 | 5.71e-03 | 25 |
| GO:1901264 | Liver | HCC | carbohydrate derivative transport | 48/7958 | 80/18723 | 1.19e-03 | 6.62e-03 | 48 |
| GO:0008643 | Liver | HCC | carbohydrate transport | 80/7958 | 152/18723 | 7.34e-03 | 2.92e-02 | 80 |
| GO:001593114 | Oral cavity | OSCC | nucleobase-containing compound transport | 150/7305 | 222/18723 | 4.86e-18 | 5.04e-16 | 150 |
| GO:00092255 | Oral cavity | OSCC | nucleotide-sugar metabolic process | 26/7305 | 36/18723 | 5.44e-05 | 4.51e-04 | 26 |
| GO:19012642 | Oral cavity | OSCC | carbohydrate derivative transport | 44/7305 | 80/18723 | 2.67e-03 | 1.16e-02 | 44 |
| GO:0006040 | Oral cavity | OSCC | amino sugar metabolic process | 24/7305 | 42/18723 | 1.30e-02 | 4.34e-02 | 24 |
| GO:0006047 | Oral cavity | OSCC | UDP-N-acetylglucosamine metabolic process | 10/7305 | 14/18723 | 1.44e-02 | 4.69e-02 | 10 |
| GO:001593121 | Oral cavity | EOLP | nucleobase-containing compound transport | 58/2218 | 222/18723 | 3.44e-09 | 2.10e-07 | 58 |
| Page: 1 2 |
| Pathway ID | Tissue | Disease Stage | Description | Gene Ratio | Bg Ratio | pvalue | p.adjust | qvalue | Count |
| Page: 1 |
Top |
Cell-cell communication analysis |
| Identification of potential cell-cell interactions between two cell types and their ligand-receptor pairs for different disease states |
| Ligand | Receptor | LRpair | Pathway | Tissue | Disease Stage |
| Page: 1 |
Top |
Single-cell gene regulatory network inference analysis |
| Find out the significant the regulons (TFs) and the target genes of each regulon across cell types for different disease states |
| TF | Cell Type | Tissue | Disease Stage | Target Gene | RSS | Regulon Activity |
| ∗The dot plots of a searched regulon are shown for all cell subpopulations in each disease state of each tissue based on the regulon specific score inferred using pySCENIC and by calculating the average expression. |
| Page: 1 |
Top |
Somatic mutation of malignant transformation related genes |
| Annotation of somatic variants for genes involved in malignant transformation |
| Hugo Symbol | Variant Class | Variant Classification | dbSNP RS | HGVSc | HGVSp | HGVSp Short | SWISSPROT | BIOTYPE | SIFT | PolyPhen | Tumor Sample Barcode | Tissue | Histology | Sex | Age | Stage | Therapy Types | Drugs | Outcome |
| SLC35A3 | SNV | Missense_Mutation | novel | c.257N>C | p.Val86Ala | p.V86A | Q9Y2D2 | protein_coding | deleterious(0) | possibly_damaging(0.781) | TCGA-AA-3877-01 | Colorectum | colon adenocarcinoma | Female | >=65 | I/II | Unknown | Unknown | SD |
| SLC35A3 | SNV | Missense_Mutation | novel | c.856A>G | p.Thr286Ala | p.T286A | Q9Y2D2 | protein_coding | deleterious(0.02) | benign(0.444) | TCGA-AA-A00N-01 | Colorectum | colon adenocarcinoma | Male | >=65 | I/II | Unknown | Unknown | PD |
| SLC35A3 | SNV | Missense_Mutation | c.371T>C | p.Met124Thr | p.M124T | Q9Y2D2 | protein_coding | tolerated(0.18) | benign(0.012) | TCGA-AA-A022-01 | Colorectum | colon adenocarcinoma | Female | >=65 | I/II | Unknown | Unknown | SD | |
| SLC35A3 | SNV | Missense_Mutation | c.747N>C | p.Arg249Ser | p.R249S | Q9Y2D2 | protein_coding | deleterious(0) | possibly_damaging(0.84) | TCGA-AZ-6598-01 | Colorectum | colon adenocarcinoma | Female | >=65 | I/II | Unknown | Unknown | SD | |
| SLC35A3 | SNV | Missense_Mutation | c.476A>T | p.Tyr159Phe | p.Y159F | Q9Y2D2 | protein_coding | deleterious(0) | probably_damaging(0.997) | TCGA-AZ-6607-01 | Colorectum | colon adenocarcinoma | Male | >=65 | III/IV | Unknown | Unknown | PD | |
| SLC35A3 | SNV | Missense_Mutation | c.463T>A | p.Tyr155Asn | p.Y155N | Q9Y2D2 | protein_coding | deleterious(0) | probably_damaging(0.994) | TCGA-WS-AB45-01 | Colorectum | colon adenocarcinoma | Female | <65 | I/II | Unknown | Unknown | SD | |
| SLC35A3 | SNV | Missense_Mutation | novel | c.889N>T | p.Gly297Cys | p.G297C | Q9Y2D2 | protein_coding | deleterious(0) | probably_damaging(0.999) | TCGA-A5-A0G1-01 | Endometrium | uterine corpus endometrioid carcinoma | Female | >=65 | I/II | Unknown | Unknown | SD |
| SLC35A3 | SNV | Missense_Mutation | novel | c.257N>C | p.Val86Ala | p.V86A | Q9Y2D2 | protein_coding | deleterious(0) | possibly_damaging(0.781) | TCGA-AP-A05O-01 | Endometrium | uterine corpus endometrioid carcinoma | Female | >=65 | I/II | Chemotherapy | carboplatin | PD |
| SLC35A3 | SNV | Missense_Mutation | novel | c.191T>C | p.Leu64Pro | p.L64P | Q9Y2D2 | protein_coding | deleterious(0) | probably_damaging(0.999) | TCGA-AX-A1CE-01 | Endometrium | uterine corpus endometrioid carcinoma | Female | <65 | I/II | Unspecific | Paclitaxel | SD |
| SLC35A3 | SNV | Missense_Mutation | c.338G>A | p.Arg113Gln | p.R113Q | Q9Y2D2 | protein_coding | tolerated(0.65) | benign(0.015) | TCGA-AX-A1CE-01 | Endometrium | uterine corpus endometrioid carcinoma | Female | <65 | I/II | Unspecific | Paclitaxel | SD |
| Page: 1 2 3 4 |
Top |
Related drugs of malignant transformation related genes |
| Identification of chemicals and drugs interact with genes involved in malignant transfromation |
| (DGIdb 4.0) |
| Entrez ID | Symbol | Category | Interaction Types | Drug Claim Name | Drug Name | PMIDs |
| Page: 1 |

Copyright 2023-Present -The University of Texas Health Science Center at Houston |