
|
|||||
|
 | |
| |
| |
| |
| |
| |
|
Gene: SLC35A2 |
Gene summary for SLC35A2 |
| Gene information | Species | Human | Gene symbol | SLC35A2 | Gene ID | 7355 |
| Gene name | solute carrier family 35 member A2 | |
| Gene Alias | CDG2M | |
| Cytomap | Xp11.23 | |
| Gene Type | protein-coding | GO ID | GO:0005975 | UniProtAcc | P78381 |
Top |
Malignant transformation analysis |
| Identification of the aberrant gene expression in precancerous and cancerous lesions by comparing the gene expression of stem-like cells in diseased tissues with normal stem cells |
| Entrez ID | Symbol | Replicates | Species | Organ | Tissue | Adj P-value | Log2FC | Malignancy |
| 7355 | SLC35A2 | HTA11_1938_2000001011 | Human | Colorectum | AD | 8.25e-05 | 2.49e-01 | -0.0811 |
| 7355 | SLC35A2 | HTA11_78_2000001011 | Human | Colorectum | AD | 2.34e-03 | 1.56e-01 | -0.1088 |
| 7355 | SLC35A2 | HTA11_347_2000001011 | Human | Colorectum | AD | 4.49e-08 | 3.01e-01 | -0.1954 |
| 7355 | SLC35A2 | HTA11_83_2000001011 | Human | Colorectum | SER | 2.84e-02 | 1.49e-01 | -0.1526 |
| 7355 | SLC35A2 | HTA11_696_2000001011 | Human | Colorectum | AD | 4.95e-07 | 2.85e-01 | -0.1464 |
| 7355 | SLC35A2 | HTA11_1391_2000001011 | Human | Colorectum | AD | 2.73e-06 | 3.33e-01 | -0.059 |
| 7355 | SLC35A2 | HTA11_5212_2000001011 | Human | Colorectum | AD | 9.84e-04 | 3.15e-01 | -0.2061 |
| 7355 | SLC35A2 | HTA11_866_3004761011 | Human | Colorectum | AD | 7.75e-03 | 1.78e-01 | 0.096 |
| 7355 | SLC35A2 | HTA11_6801_2000001011 | Human | Colorectum | SER | 6.68e-06 | 5.20e-01 | 0.0171 |
| 7355 | SLC35A2 | HTA11_10711_2000001011 | Human | Colorectum | AD | 9.22e-05 | 1.84e-01 | 0.0338 |
| 7355 | SLC35A2 | HTA11_7696_3000711011 | Human | Colorectum | AD | 9.16e-05 | 2.03e-01 | 0.0674 |
| 7355 | SLC35A2 | HTA11_7469_2000001011 | Human | Colorectum | AD | 6.84e-04 | 5.39e-01 | -0.0124 |
| 7355 | SLC35A2 | HTA11_99999970781_79442 | Human | Colorectum | MSS | 2.20e-09 | 2.91e-01 | 0.294 |
| 7355 | SLC35A2 | HTA11_99999965104_69814 | Human | Colorectum | MSS | 3.96e-07 | 3.71e-01 | 0.281 |
| 7355 | SLC35A2 | HTA11_99999971662_82457 | Human | Colorectum | MSS | 1.35e-09 | 3.83e-01 | 0.3859 |
| 7355 | SLC35A2 | HTA11_99999974143_84620 | Human | Colorectum | MSS | 2.90e-08 | 2.87e-01 | 0.3005 |
| 7355 | SLC35A2 | LZE4T | Human | Esophagus | ESCC | 6.21e-06 | 1.83e-01 | 0.0811 |
| 7355 | SLC35A2 | LZE7T | Human | Esophagus | ESCC | 1.16e-07 | 2.59e-01 | 0.0667 |
| 7355 | SLC35A2 | LZE20T | Human | Esophagus | ESCC | 8.42e-07 | 2.22e-01 | 0.0662 |
| 7355 | SLC35A2 | LZE24T | Human | Esophagus | ESCC | 2.94e-10 | 2.64e-01 | 0.0596 |
| Page: 1 2 3 4 5 6 7 |
| Tissue | Expression Dynamics | Abbreviation |
| Colorectum (GSE201348) |  | FAP: Familial adenomatous polyposis |
| CRC: Colorectal cancer | ||
| Colorectum (HTA11) |  | AD: Adenomas |
| SER: Sessile serrated lesions | ||
| MSI-H: Microsatellite-high colorectal cancer | ||
| MSS: Microsatellite stable colorectal cancer | ||
| Esophagus | 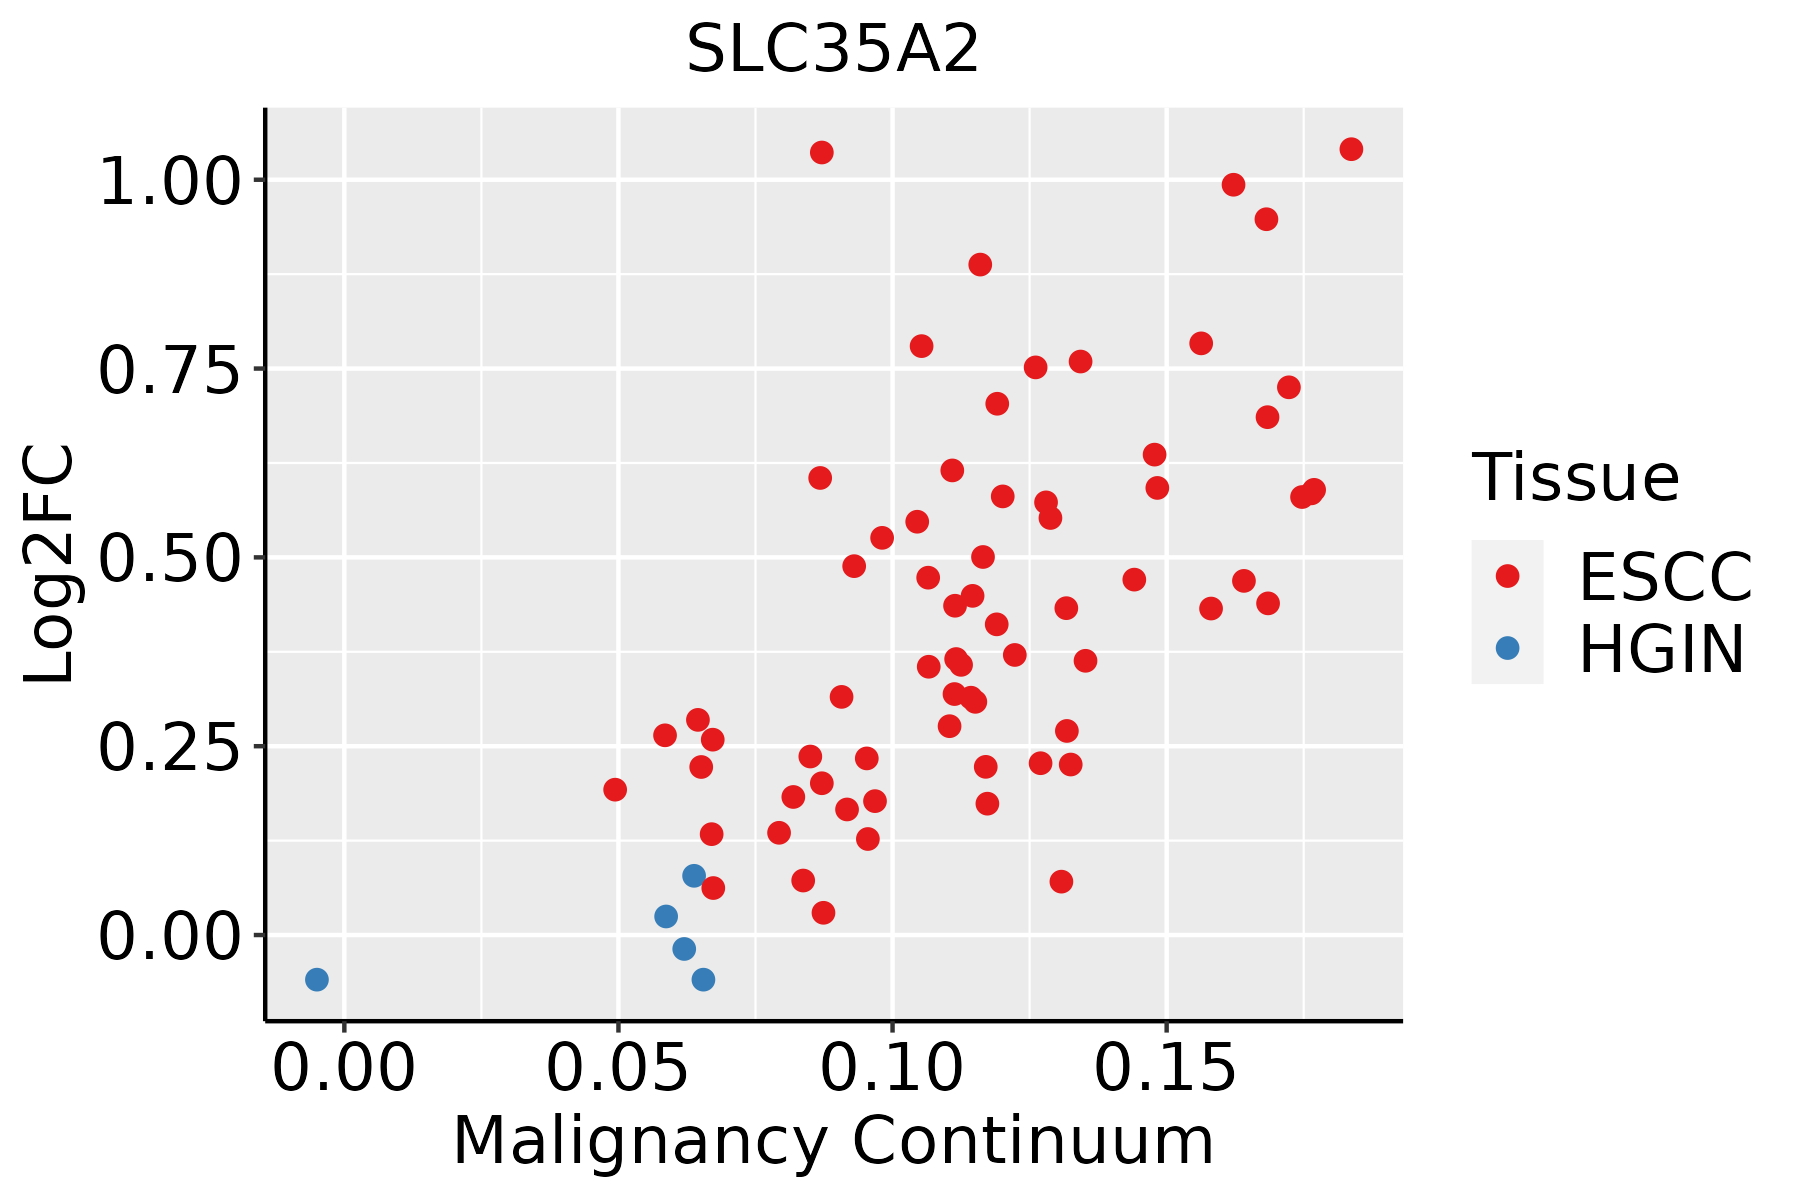 | ESCC: Esophageal squamous cell carcinoma |
| HGIN: High-grade intraepithelial neoplasias | ||
| LGIN: Low-grade intraepithelial neoplasias | ||
| Liver |  | HCC: Hepatocellular carcinoma |
| NAFLD: Non-alcoholic fatty liver disease | ||
| Oral Cavity |  | EOLP: Erosive Oral lichen planus |
| LP: leukoplakia | ||
| NEOLP: Non-erosive oral lichen planus | ||
| OSCC: Oral squamous cell carcinoma | ||
| Skin |  | AK: Actinic keratosis |
| cSCC: Cutaneous squamous cell carcinoma | ||
| SCCIS:squamous cell carcinoma in situ | ||
| Thyroid | 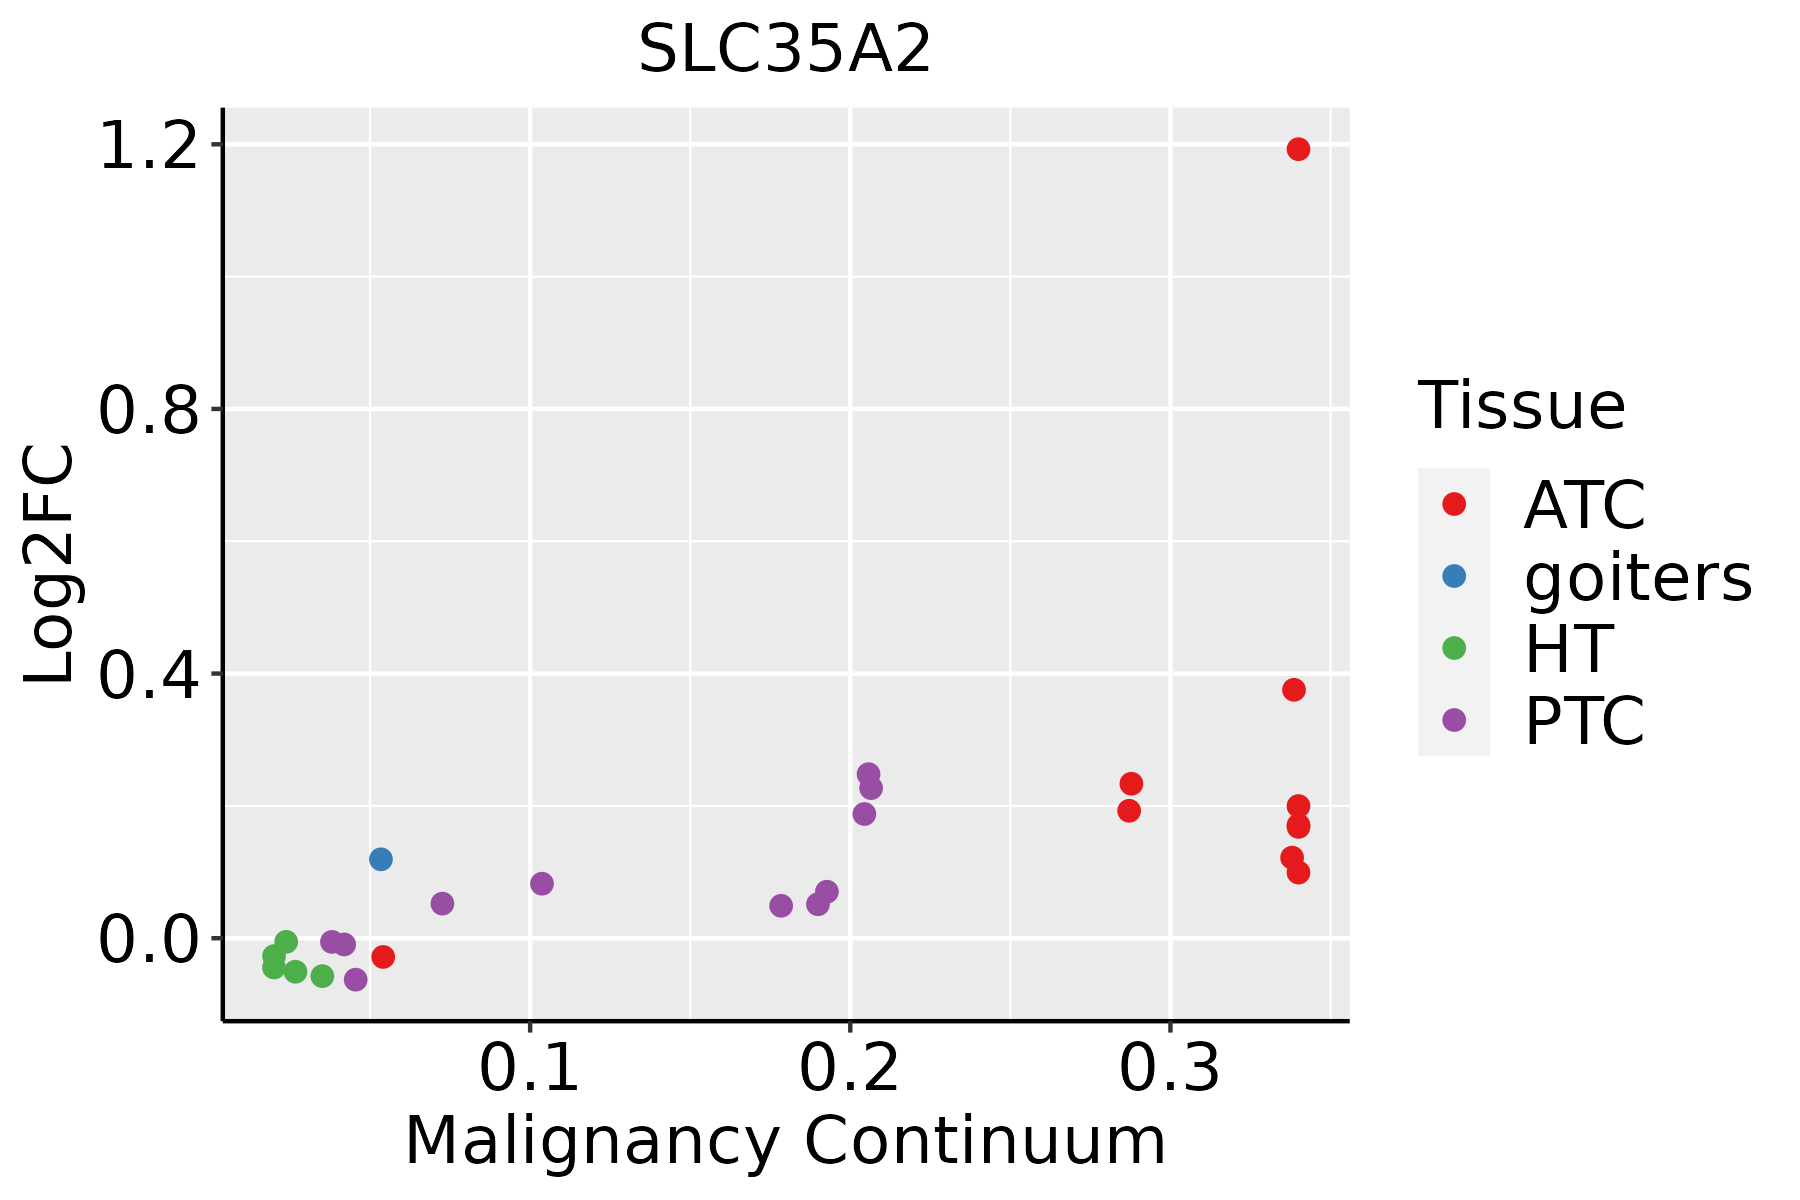 | ATC: Anaplastic thyroid cancer |
| HT: Hashimoto's thyroiditis | ||
| PTC: Papillary thyroid cancer |
| ∗log2FC in expression of this searched gene in stem-like cells from each diseased tissue sample relative to stem-like cells in normal samples in each tissue plotted against the malignancy continuum. Samples are colored based on if they are from different disease stage. |
Top |
Malignant transformation related pathway analysis |
| Find out the enriched GO biological processes and KEGG pathways involved in transition from healthy to precancer to cancer |
| Tissue | Disease Stage | Enriched GO biological Processes |
| Colorectum | AD |  |
| Colorectum | SER |  |
| Colorectum | MSS |  |
| Colorectum | MSI-H |  |
| Colorectum | FAP |  |
| ∗Top 15 enriched GO BP terms are showed in the bar plot of each disease state in each tissue. Each row represents a significant GO biological process which is colored according to the -log10(p.adjust). |
| Page: 1 2 3 4 5 6 7 8 9 |
| GO ID | Tissue | Disease Stage | Description | Gene Ratio | Bg Ratio | pvalue | p.adjust | Count |
| GO:0019318 | Colorectum | AD | hexose metabolic process | 77/3918 | 237/18723 | 1.96e-05 | 4.01e-04 | 77 |
| GO:0015931 | Colorectum | AD | nucleobase-containing compound transport | 73/3918 | 222/18723 | 2.02e-05 | 4.10e-04 | 73 |
| GO:0005996 | Colorectum | AD | monosaccharide metabolic process | 80/3918 | 257/18723 | 7.31e-05 | 1.17e-03 | 80 |
| GO:0006012 | Colorectum | AD | galactose metabolic process | 6/3918 | 10/18723 | 8.03e-03 | 4.73e-02 | 6 |
| GO:00159311 | Colorectum | SER | nucleobase-containing compound transport | 54/2897 | 222/18723 | 3.65e-04 | 5.67e-03 | 54 |
| GO:00193181 | Colorectum | SER | hexose metabolic process | 56/2897 | 237/18723 | 6.19e-04 | 8.42e-03 | 56 |
| GO:00059961 | Colorectum | SER | monosaccharide metabolic process | 59/2897 | 257/18723 | 9.65e-04 | 1.15e-02 | 59 |
| GO:00159312 | Colorectum | MSS | nucleobase-containing compound transport | 70/3467 | 222/18723 | 1.92e-06 | 6.01e-05 | 70 |
| GO:00193182 | Colorectum | MSS | hexose metabolic process | 63/3467 | 237/18723 | 1.32e-03 | 1.25e-02 | 63 |
| GO:00059962 | Colorectum | MSS | monosaccharide metabolic process | 66/3467 | 257/18723 | 2.61e-03 | 2.06e-02 | 66 |
| GO:00060121 | Colorectum | MSS | galactose metabolic process | 6/3467 | 10/18723 | 4.25e-03 | 3.04e-02 | 6 |
| GO:001593117 | Esophagus | ESCC | nucleobase-containing compound transport | 162/8552 | 222/18723 | 9.87e-17 | 7.93e-15 | 162 |
| GO:00059969 | Esophagus | ESCC | monosaccharide metabolic process | 159/8552 | 257/18723 | 1.11e-07 | 1.81e-06 | 159 |
| GO:00193189 | Esophagus | ESCC | hexose metabolic process | 147/8552 | 237/18723 | 2.63e-07 | 3.94e-06 | 147 |
| GO:000599612 | Liver | Cirrhotic | monosaccharide metabolic process | 104/4634 | 257/18723 | 1.74e-08 | 6.32e-07 | 104 |
| GO:001931812 | Liver | Cirrhotic | hexose metabolic process | 97/4634 | 237/18723 | 2.67e-08 | 9.16e-07 | 97 |
| GO:00159316 | Liver | Cirrhotic | nucleobase-containing compound transport | 87/4634 | 222/18723 | 1.25e-06 | 2.52e-05 | 87 |
| GO:00060123 | Liver | Cirrhotic | galactose metabolic process | 8/4634 | 10/18723 | 3.84e-04 | 3.19e-03 | 8 |
| GO:001593111 | Liver | HCC | nucleobase-containing compound transport | 150/7958 | 222/18723 | 3.17e-14 | 2.03e-12 | 150 |
| GO:000599621 | Liver | HCC | monosaccharide metabolic process | 167/7958 | 257/18723 | 2.31e-13 | 1.25e-11 | 167 |
| Page: 1 2 |
| Pathway ID | Tissue | Disease Stage | Description | Gene Ratio | Bg Ratio | pvalue | p.adjust | qvalue | Count |
| Page: 1 |
Top |
Cell-cell communication analysis |
| Identification of potential cell-cell interactions between two cell types and their ligand-receptor pairs for different disease states |
| Ligand | Receptor | LRpair | Pathway | Tissue | Disease Stage |
| Page: 1 |
Top |
Single-cell gene regulatory network inference analysis |
| Find out the significant the regulons (TFs) and the target genes of each regulon across cell types for different disease states |
| TF | Cell Type | Tissue | Disease Stage | Target Gene | RSS | Regulon Activity |
| ∗The dot plots of a searched regulon are shown for all cell subpopulations in each disease state of each tissue based on the regulon specific score inferred using pySCENIC and by calculating the average expression. |
| Page: 1 |
Top |
Somatic mutation of malignant transformation related genes |
| Annotation of somatic variants for genes involved in malignant transformation |
| Hugo Symbol | Variant Class | Variant Classification | dbSNP RS | HGVSc | HGVSp | HGVSp Short | SWISSPROT | BIOTYPE | SIFT | PolyPhen | Tumor Sample Barcode | Tissue | Histology | Sex | Age | Stage | Therapy Types | Drugs | Outcome |
| SLC35A2 | SNV | Missense_Mutation | novel | c.745N>A | p.Glu249Lys | p.E249K | P78381 | protein_coding | deleterious(0.02) | probably_damaging(1) | TCGA-5L-AAT1-01 | Breast | breast invasive carcinoma | Female | <65 | III/IV | Hormone Therapy | letrozol | SD |
| SLC35A2 | SNV | Missense_Mutation | rs782068680 | c.899N>T | p.Trp300Leu | p.W300L | P78381 | protein_coding | deleterious(0.01) | benign(0.225) | TCGA-E2-A15I-01 | Breast | breast invasive carcinoma | Female | <65 | I/II | Hormone Therapy | tamoxiphen | SD |
| SLC35A2 | SNV | Missense_Mutation | novel | c.466N>A | p.Leu156Ile | p.L156I | P78381 | protein_coding | deleterious(0) | probably_damaging(1) | TCGA-2W-A8YY-01 | Cervix | cervical & endocervical cancer | Female | <65 | I/II | Chemotherapy | cisplatin | CR |
| SLC35A2 | SNV | Missense_Mutation | novel | c.257N>A | p.Arg86His | p.R86H | P78381 | protein_coding | deleterious(0) | probably_damaging(0.995) | TCGA-EA-A3HS-01 | Cervix | cervical & endocervical cancer | Female | <65 | I/II | Unknown | Unknown | SD |
| SLC35A2 | SNV | Missense_Mutation | novel | c.528N>T | p.Lys176Asn | p.K176N | P78381 | protein_coding | deleterious(0) | probably_damaging(1) | TCGA-VS-A8QH-01 | Cervix | cervical & endocervical cancer | Female | >=65 | I/II | Chemotherapy | gemcitabine | PD |
| SLC35A2 | SNV | Missense_Mutation | c.248N>A | p.Arg83His | p.R83H | P78381 | protein_coding | deleterious(0.01) | possibly_damaging(0.857) | TCGA-CK-4951-01 | Colorectum | colon adenocarcinoma | Female | >=65 | I/II | Unknown | Unknown | PD | |
| SLC35A2 | SNV | Missense_Mutation | novel | c.1258G>A | p.Val420Met | p.V420M | P78381 | protein_coding | deleterious_low_confidence(0.03) | possibly_damaging(0.641) | TCGA-G4-6297-01 | Colorectum | colon adenocarcinoma | Female | <65 | III/IV | Chemotherapy | fluorouracil | PD |
| SLC35A2 | SNV | Missense_Mutation | rs376547003 | c.1147G>A | p.Ala383Thr | p.A383T | P78381 | protein_coding | tolerated_low_confidence(0.34) | benign(0) | TCGA-G4-6302-01 | Colorectum | colon adenocarcinoma | Female | >=65 | I/II | Unknown | Unknown | SD |
| SLC35A2 | SNV | Missense_Mutation | c.542C>T | p.Ala181Val | p.A181V | P78381 | protein_coding | deleterious(0) | probably_damaging(1) | TCGA-AF-A56N-01 | Colorectum | rectum adenocarcinoma | Female | <65 | I/II | Chemotherapy | xeloda | CR | |
| SLC35A2 | SNV | Missense_Mutation | novel | c.1063G>A | p.Gly355Ser | p.G355S | P78381 | protein_coding | deleterious(0) | probably_damaging(1) | TCGA-A5-A0G1-01 | Endometrium | uterine corpus endometrioid carcinoma | Female | >=65 | I/II | Unknown | Unknown | SD |
| Page: 1 2 3 4 5 |
Top |
Related drugs of malignant transformation related genes |
| Identification of chemicals and drugs interact with genes involved in malignant transfromation |
| (DGIdb 4.0) |
| Entrez ID | Symbol | Category | Interaction Types | Drug Claim Name | Drug Name | PMIDs |
| Page: 1 |

Copyright 2023-Present -The University of Texas Health Science Center at Houston |