| Tissue | Expression Dynamics | Abbreviation |
| Cervix | 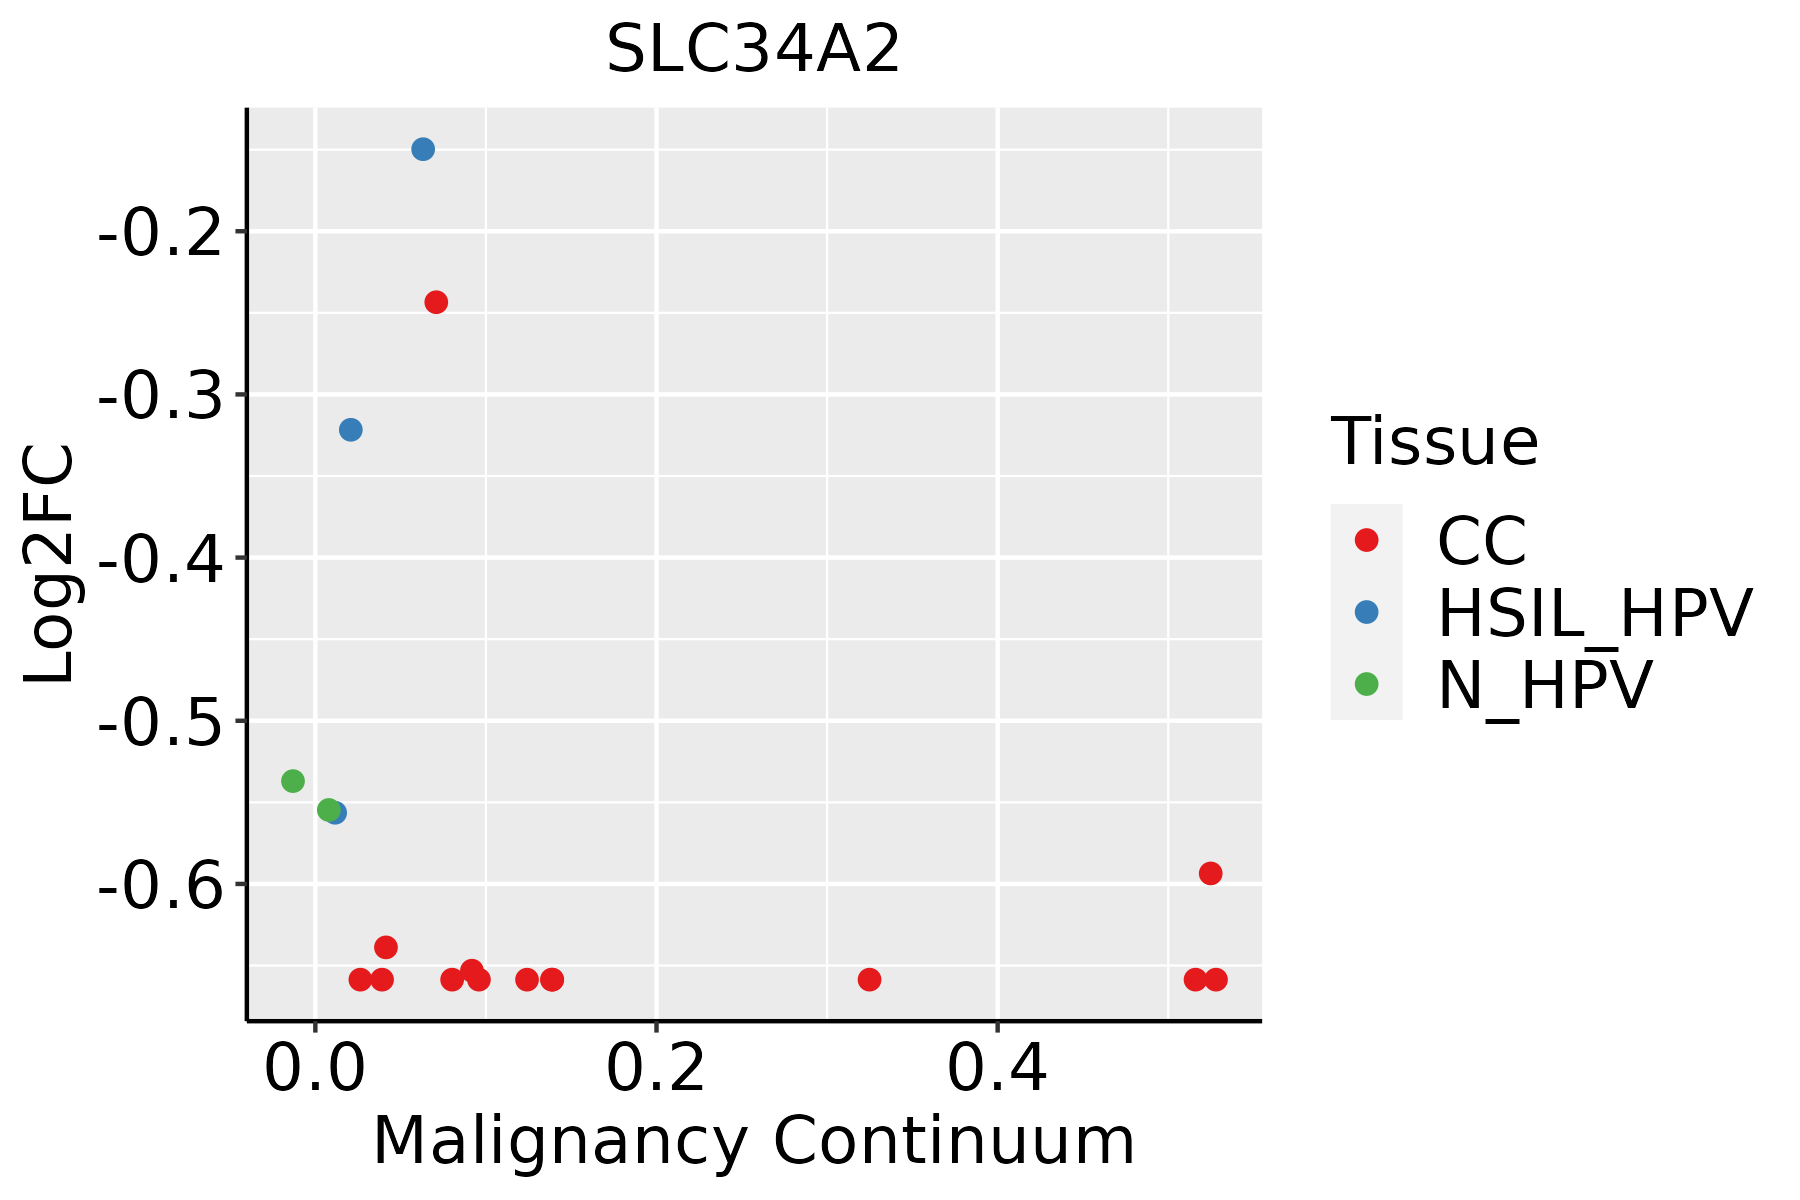 | CC: Cervix cancer |
| HSIL_HPV: HPV-infected high-grade squamous intraepithelial lesions |
| N_HPV: HPV-infected normal cervix |
| Esophagus | 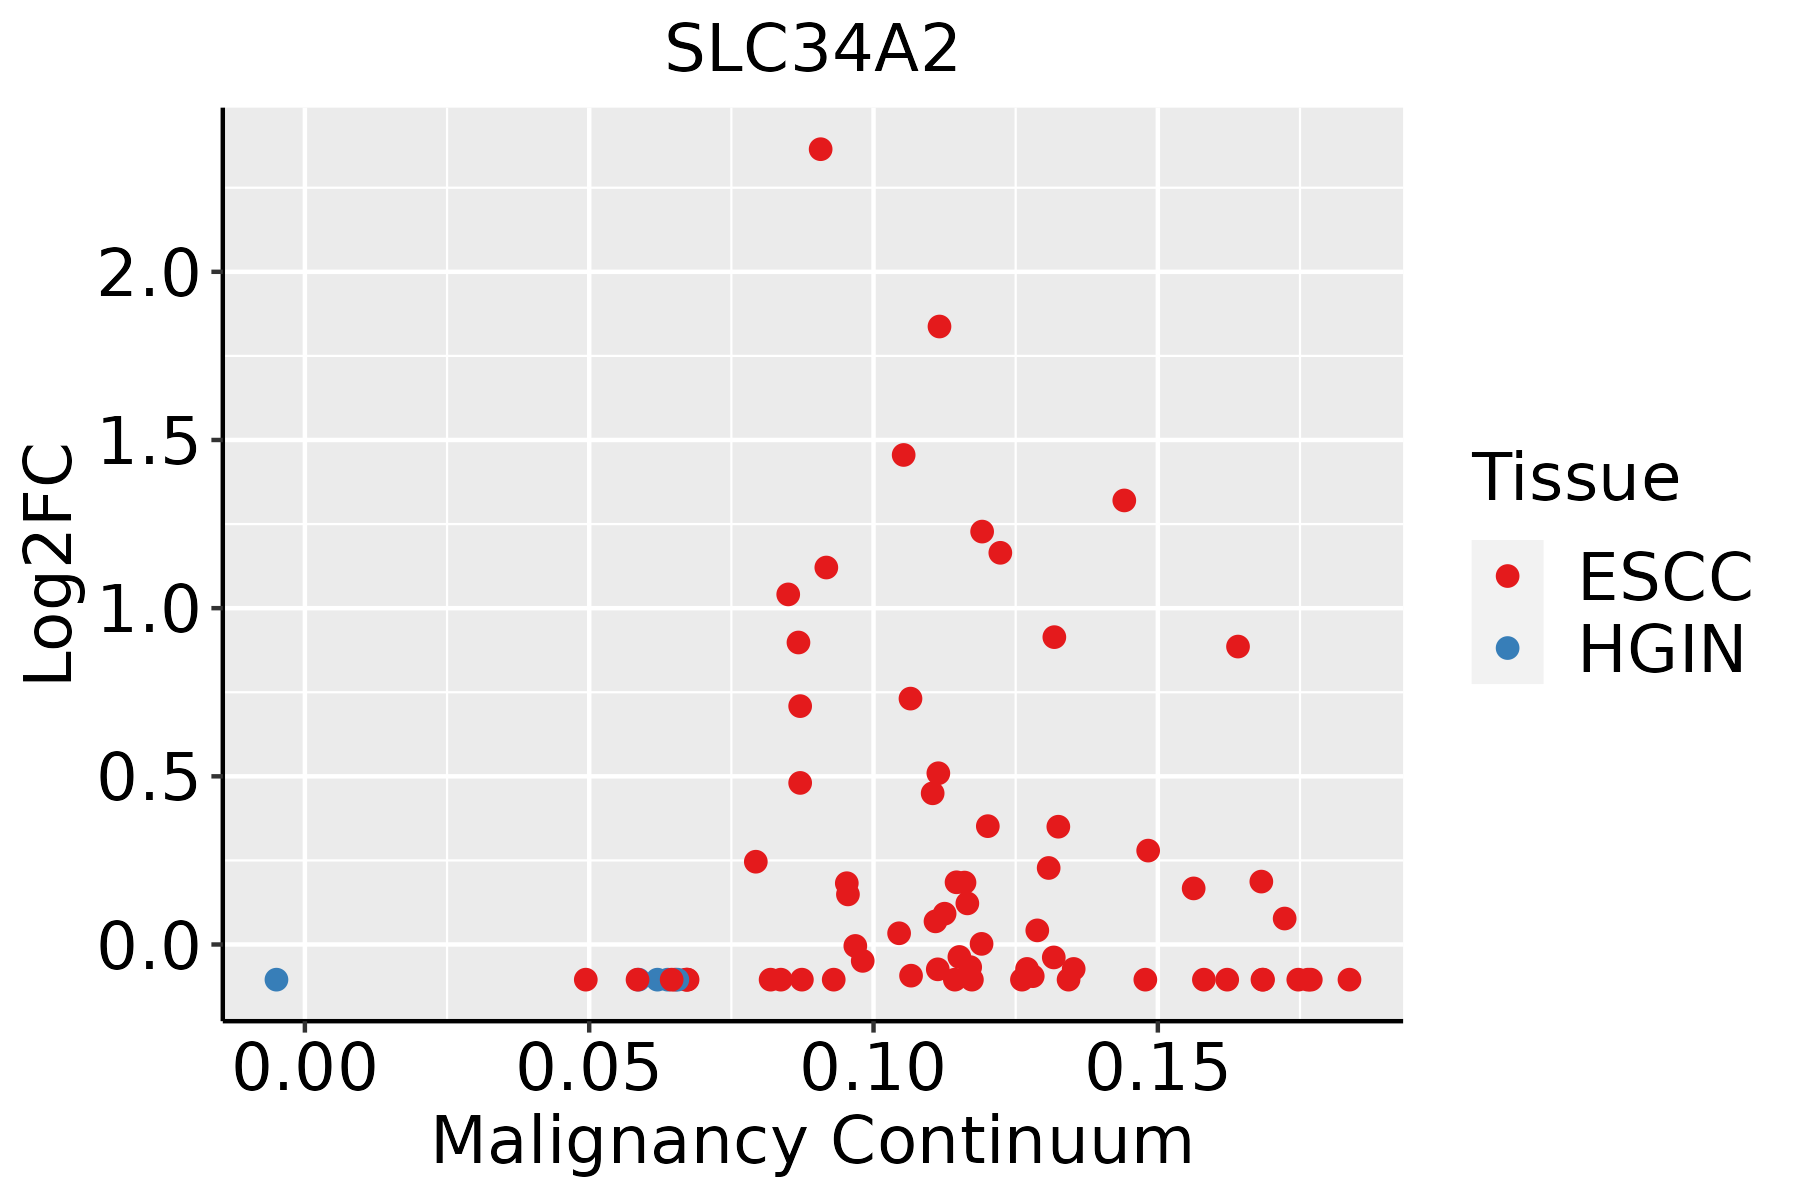 | ESCC: Esophageal squamous cell carcinoma |
| HGIN: High-grade intraepithelial neoplasias |
| LGIN: Low-grade intraepithelial neoplasias |
| Liver | 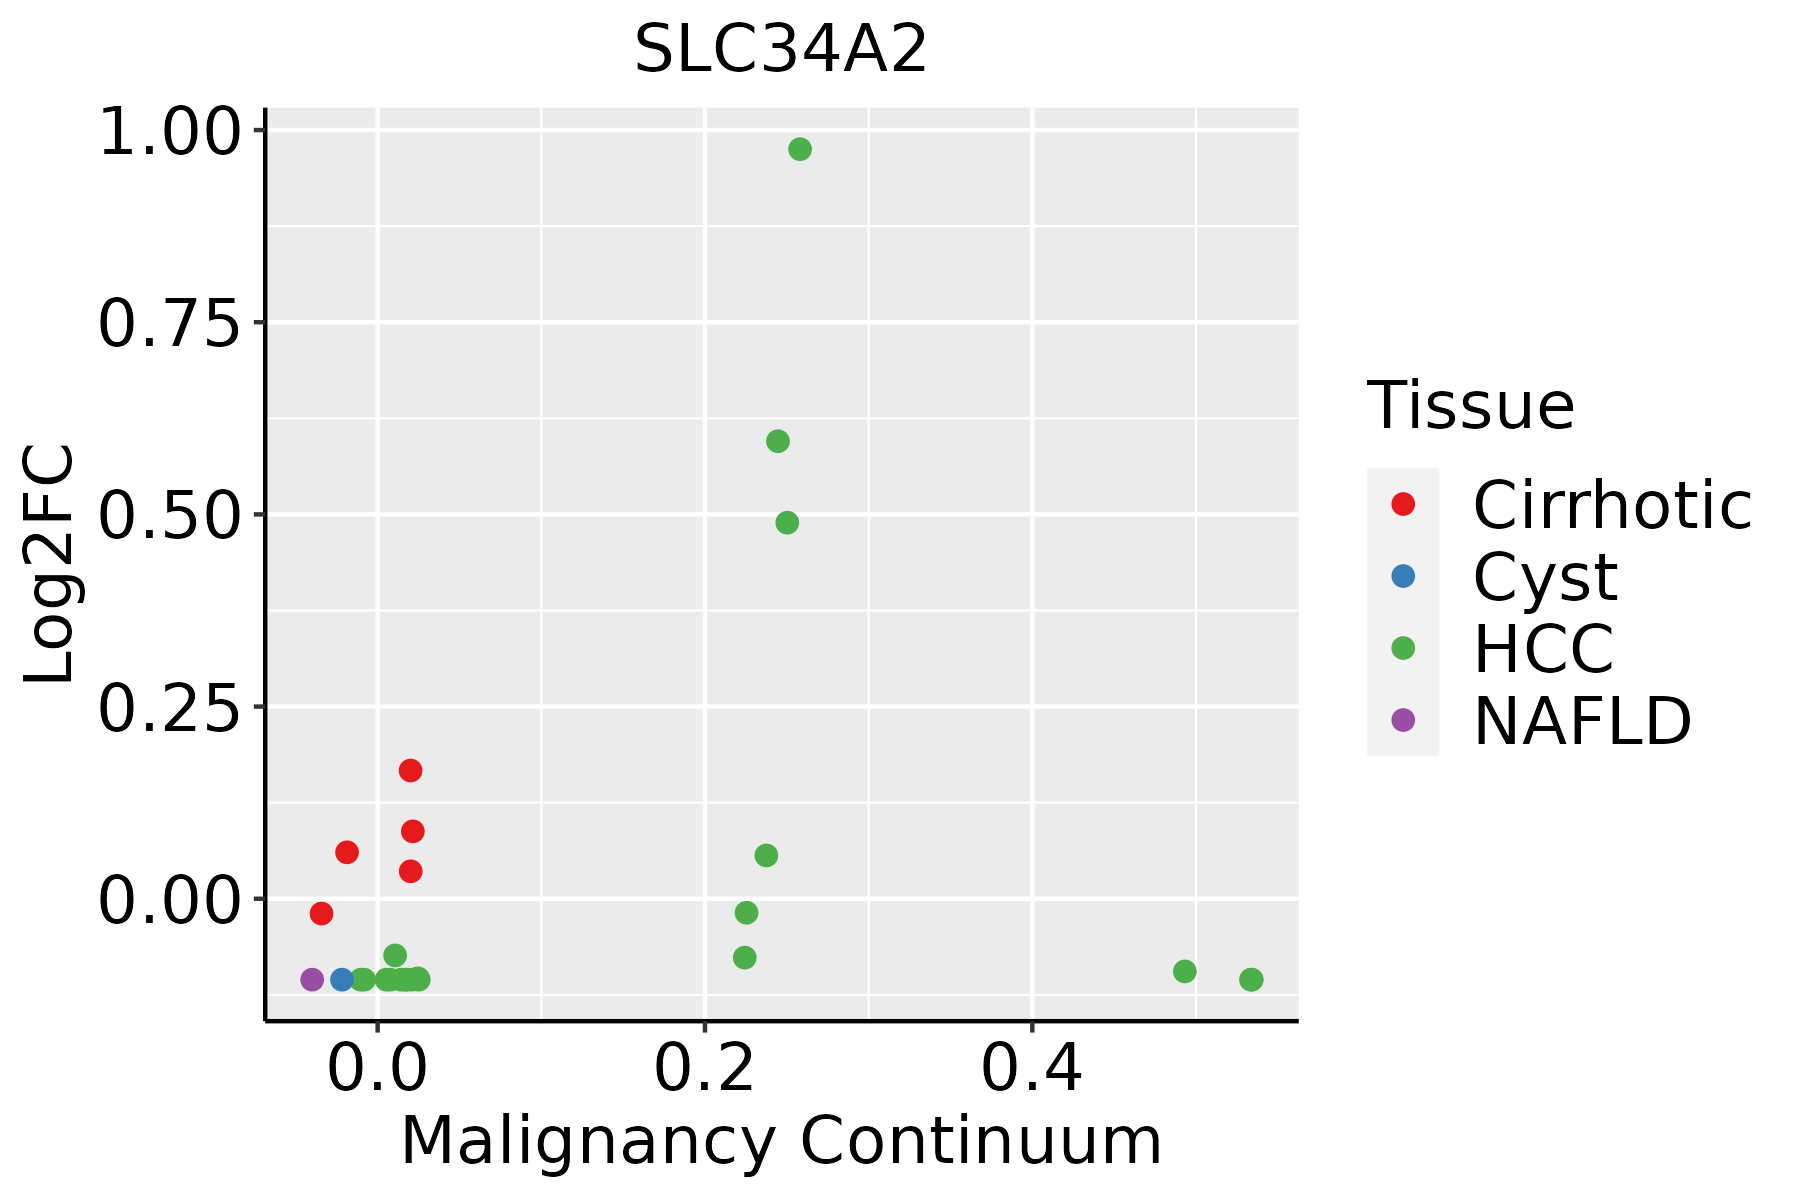 | HCC: Hepatocellular carcinoma |
| NAFLD: Non-alcoholic fatty liver disease |
| Lung |  | AAH: Atypical adenomatous hyperplasia |
| AIS: Adenocarcinoma in situ |
| IAC: Invasive lung adenocarcinoma |
| MIA: Minimally invasive adenocarcinoma |
| Thyroid | 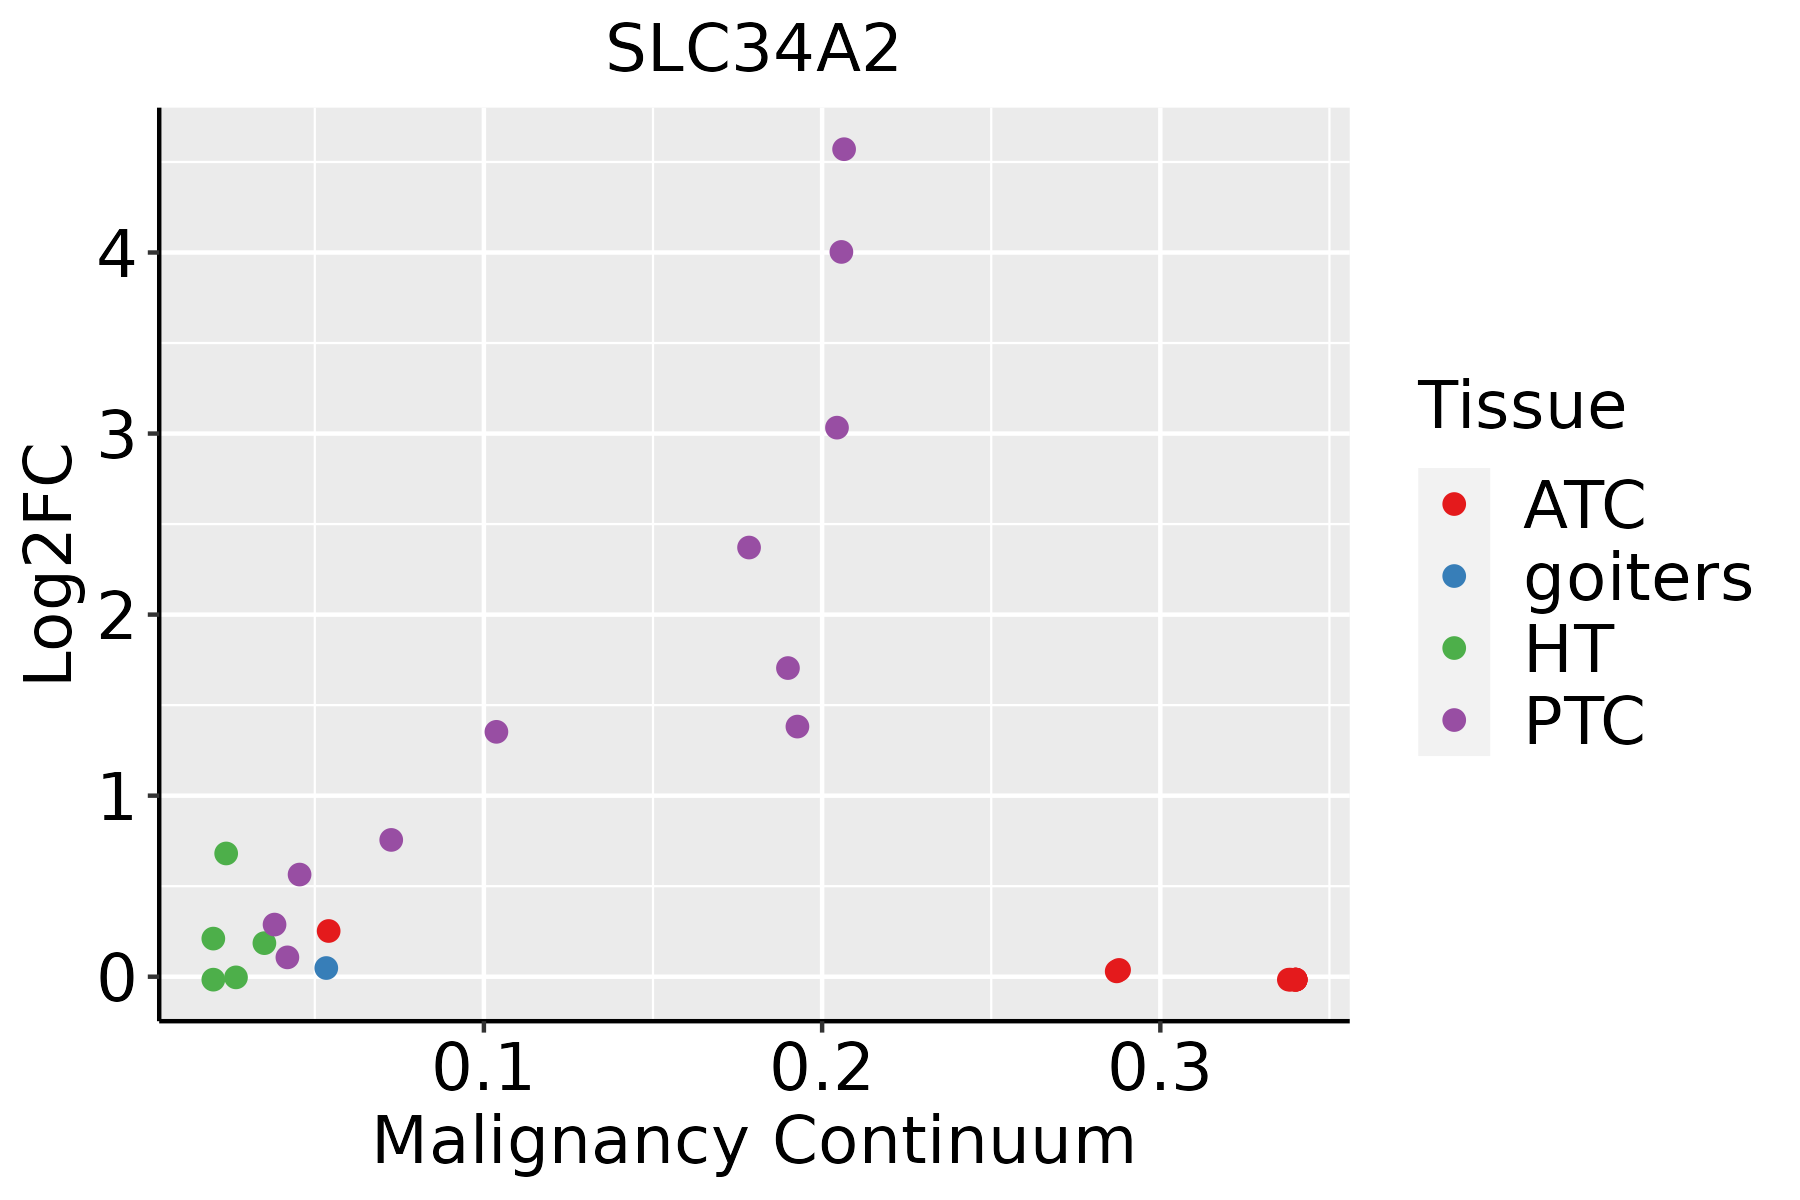 | ATC: Anaplastic thyroid cancer |
| HT: Hashimoto's thyroiditis |
| PTC: Papillary thyroid cancer |
| GO ID | Tissue | Disease Stage | Description | Gene Ratio | Bg Ratio | pvalue | p.adjust | Count |
| GO:00017018 | Cervix | CC | in utero embryonic development | 71/2311 | 367/18723 | 7.21e-05 | 1.00e-03 | 71 |
| GO:000170119 | Esophagus | ESCC | in utero embryonic development | 243/8552 | 367/18723 | 1.00e-15 | 6.86e-14 | 243 |
| GO:00436275 | Esophagus | ESCC | response to estrogen | 45/8552 | 75/18723 | 8.75e-03 | 3.08e-02 | 45 |
| GO:00017015 | Liver | Cirrhotic | in utero embryonic development | 134/4634 | 367/18723 | 2.78e-07 | 6.86e-06 | 134 |
| GO:0043627 | Liver | Cirrhotic | response to estrogen | 30/4634 | 75/18723 | 2.52e-03 | 1.51e-02 | 30 |
| GO:000170111 | Liver | HCC | in utero embryonic development | 204/7958 | 367/18723 | 2.44e-07 | 4.30e-06 | 204 |
| GO:00436271 | Liver | HCC | response to estrogen | 44/7958 | 75/18723 | 3.44e-03 | 1.55e-02 | 44 |
| GO:00017016 | Lung | IAC | in utero embryonic development | 68/2061 | 367/18723 | 1.12e-05 | 3.45e-04 | 68 |
| GO:0006817 | Lung | IAC | phosphate ion transport | 8/2061 | 24/18723 | 3.09e-03 | 2.71e-02 | 8 |
| GO:000170112 | Lung | AIS | in utero embryonic development | 59/1849 | 367/18723 | 1.20e-04 | 2.75e-03 | 59 |
| GO:000170121 | Lung | AAH | in utero embryonic development | 24/613 | 367/18723 | 1.09e-03 | 3.25e-02 | 24 |
| GO:000170131 | Lung | MIAC | in utero embryonic development | 33/967 | 367/18723 | 1.44e-03 | 2.54e-02 | 33 |
| GO:000170125 | Thyroid | HT | in utero embryonic development | 39/1272 | 367/18723 | 3.72e-03 | 2.78e-02 | 39 |
| GO:0001701111 | Thyroid | PTC | in utero embryonic development | 175/5968 | 367/18723 | 1.40e-10 | 4.73e-09 | 175 |
| Pathway ID | Tissue | Disease Stage | Description | Gene Ratio | Bg Ratio | pvalue | p.adjust | qvalue | Count |
| hsa0492812 | Cervix | CC | Parathyroid hormone synthesis, secretion and action | 27/1267 | 106/8465 | 3.12e-03 | 1.19e-02 | 7.03e-03 | 27 |
| hsa0492813 | Cervix | CC | Parathyroid hormone synthesis, secretion and action | 27/1267 | 106/8465 | 3.12e-03 | 1.19e-02 | 7.03e-03 | 27 |
| hsa0492816 | Esophagus | ESCC | Parathyroid hormone synthesis, secretion and action | 66/4205 | 106/8465 | 5.86e-03 | 1.47e-02 | 7.51e-03 | 66 |
| hsa0492817 | Esophagus | ESCC | Parathyroid hormone synthesis, secretion and action | 66/4205 | 106/8465 | 5.86e-03 | 1.47e-02 | 7.51e-03 | 66 |
| hsa0492810 | Lung | IAC | Parathyroid hormone synthesis, secretion and action | 26/1053 | 106/8465 | 4.34e-04 | 4.03e-03 | 2.68e-03 | 26 |
| hsa0492811 | Lung | IAC | Parathyroid hormone synthesis, secretion and action | 26/1053 | 106/8465 | 4.34e-04 | 4.03e-03 | 2.68e-03 | 26 |
| hsa0492821 | Lung | AIS | Parathyroid hormone synthesis, secretion and action | 22/961 | 106/8465 | 3.45e-03 | 1.90e-02 | 1.21e-02 | 22 |
| hsa0492831 | Lung | AIS | Parathyroid hormone synthesis, secretion and action | 22/961 | 106/8465 | 3.45e-03 | 1.90e-02 | 1.21e-02 | 22 |
| hsa0492841 | Lung | MIAC | Parathyroid hormone synthesis, secretion and action | 17/507 | 106/8465 | 1.69e-04 | 3.51e-03 | 2.54e-03 | 17 |
| hsa0492851 | Lung | MIAC | Parathyroid hormone synthesis, secretion and action | 17/507 | 106/8465 | 1.69e-04 | 3.51e-03 | 2.54e-03 | 17 |
| Hugo Symbol | Variant Class | Variant Classification | dbSNP RS | HGVSc | HGVSp | HGVSp Short | SWISSPROT | BIOTYPE | SIFT | PolyPhen | Tumor Sample Barcode | Tissue | Histology | Sex | Age | Stage | Therapy Types | Drugs | Outcome |
| SLC34A2 | SNV | Missense_Mutation | novel | c.137N>T | p.Thr46Ile | p.T46I | O95436 | protein_coding | tolerated(0.06) | benign(0.148) | TCGA-A2-A4S3-01 | Breast | breast invasive carcinoma | Female | <65 | I/II | Unknown | Unknown | SD |
| SLC34A2 | SNV | Missense_Mutation | novel | c.313C>A | p.Leu105Ile | p.L105I | O95436 | protein_coding | tolerated(0.08) | possibly_damaging(0.46) | TCGA-AN-A046-01 | Breast | breast invasive carcinoma | Female | >=65 | I/II | Unknown | Unknown | SD |
| SLC34A2 | SNV | Missense_Mutation | | c.203N>G | p.Asp68Gly | p.D68G | O95436 | protein_coding | deleterious(0) | probably_damaging(0.948) | TCGA-B6-A0WX-01 | Breast | breast invasive carcinoma | Female | <65 | III/IV | Unknown | Unknown | PD |
| SLC34A2 | SNV | Missense_Mutation | | c.1284N>A | p.Phe428Leu | p.F428L | O95436 | protein_coding | tolerated(0.06) | benign(0.344) | TCGA-BH-A0HA-01 | Breast | breast invasive carcinoma | Female | <65 | I/II | Unknown | Unknown | SD |
| SLC34A2 | SNV | Missense_Mutation | rs115874588 | c.1538N>A | p.Arg513His | p.R513H | O95436 | protein_coding | tolerated(0.19) | benign(0.077) | TCGA-BH-A18P-01 | Breast | breast invasive carcinoma | Female | <65 | I/II | Unknown | Unknown | PD |
| SLC34A2 | SNV | Missense_Mutation | rs148403466 | c.700N>A | p.Val234Met | p.V234M | O95436 | protein_coding | deleterious(0.02) | benign(0.117) | TCGA-LD-A9QF-01 | Breast | breast invasive carcinoma | Female | >=65 | I/II | Chemotherapy | taxol | SD |
| SLC34A2 | SNV | Missense_Mutation | rs76854178 | c.1342G>A | p.Val448Met | p.V448M | O95436 | protein_coding | deleterious(0.02) | possibly_damaging(0.74) | TCGA-2W-A8YY-01 | Cervix | cervical & endocervical cancer | Female | <65 | I/II | Chemotherapy | cisplatin | CR |
| SLC34A2 | SNV | Missense_Mutation | | c.1611N>A | p.Phe537Leu | p.F537L | O95436 | protein_coding | deleterious(0) | probably_damaging(0.999) | TCGA-C5-A3HE-01 | Cervix | cervical & endocervical cancer | Female | <65 | I/II | Unknown | Unknown | PD |
| SLC34A2 | SNV | Missense_Mutation | rs775481758 | c.1658G>A | p.Arg553Gln | p.R553Q | O95436 | protein_coding | tolerated(0.84) | benign(0) | TCGA-EA-A3HU-01 | Cervix | cervical & endocervical cancer | Female | <65 | I/II | Unknown | Unknown | SD |
| SLC34A2 | SNV | Missense_Mutation | rs78448446 | c.334N>A | p.Val112Met | p.V112M | O95436 | protein_coding | deleterious(0) | probably_damaging(0.981) | TCGA-JX-A3PZ-01 | Cervix | cervical & endocervical cancer | Female | <65 | I/II | Unknown | Unknown | PD |


