
|
|||||
|
 | |
| |
| |
| |
| |
| |
|
Gene: SLC31A1 |
Gene summary for SLC31A1 |
| Gene information | Species | Human | Gene symbol | SLC31A1 | Gene ID | 1317 |
| Gene name | solute carrier family 31 member 1 | |
| Gene Alias | COPT1 | |
| Cytomap | 9q32 | |
| Gene Type | protein-coding | GO ID | GO:0000041 | UniProtAcc | A0A024R824 |
Top |
Malignant transformation analysis |
| Identification of the aberrant gene expression in precancerous and cancerous lesions by comparing the gene expression of stem-like cells in diseased tissues with normal stem cells |
| Entrez ID | Symbol | Replicates | Species | Organ | Tissue | Adj P-value | Log2FC | Malignancy |
| 1317 | SLC31A1 | LZE4T | Human | Esophagus | ESCC | 3.02e-09 | 1.64e-01 | 0.0811 |
| 1317 | SLC31A1 | LZE5T | Human | Esophagus | ESCC | 4.68e-08 | 6.17e-01 | 0.0514 |
| 1317 | SLC31A1 | LZE7T | Human | Esophagus | ESCC | 3.23e-02 | 1.71e-01 | 0.0667 |
| 1317 | SLC31A1 | LZE8T | Human | Esophagus | ESCC | 9.75e-06 | 1.33e-01 | 0.067 |
| 1317 | SLC31A1 | LZE20T | Human | Esophagus | ESCC | 5.37e-07 | 1.83e-01 | 0.0662 |
| 1317 | SLC31A1 | LZE24T | Human | Esophagus | ESCC | 3.34e-12 | 3.19e-01 | 0.0596 |
| 1317 | SLC31A1 | P1T-E | Human | Esophagus | ESCC | 4.49e-03 | 2.35e-01 | 0.0875 |
| 1317 | SLC31A1 | P2T-E | Human | Esophagus | ESCC | 2.53e-37 | 6.38e-01 | 0.1177 |
| 1317 | SLC31A1 | P4T-E | Human | Esophagus | ESCC | 7.08e-22 | 4.08e-01 | 0.1323 |
| 1317 | SLC31A1 | P5T-E | Human | Esophagus | ESCC | 1.48e-13 | 2.87e-01 | 0.1327 |
| 1317 | SLC31A1 | P8T-E | Human | Esophagus | ESCC | 6.32e-07 | 1.89e-01 | 0.0889 |
| 1317 | SLC31A1 | P9T-E | Human | Esophagus | ESCC | 5.38e-12 | 2.54e-01 | 0.1131 |
| 1317 | SLC31A1 | P10T-E | Human | Esophagus | ESCC | 2.07e-09 | 1.95e-01 | 0.116 |
| 1317 | SLC31A1 | P11T-E | Human | Esophagus | ESCC | 1.46e-06 | 4.36e-01 | 0.1426 |
| 1317 | SLC31A1 | P12T-E | Human | Esophagus | ESCC | 1.96e-11 | 2.64e-01 | 0.1122 |
| 1317 | SLC31A1 | P15T-E | Human | Esophagus | ESCC | 1.18e-09 | 2.11e-01 | 0.1149 |
| 1317 | SLC31A1 | P16T-E | Human | Esophagus | ESCC | 2.97e-25 | 2.59e-01 | 0.1153 |
| 1317 | SLC31A1 | P17T-E | Human | Esophagus | ESCC | 2.28e-05 | 3.09e-01 | 0.1278 |
| 1317 | SLC31A1 | P19T-E | Human | Esophagus | ESCC | 6.76e-07 | 2.67e-01 | 0.1662 |
| 1317 | SLC31A1 | P20T-E | Human | Esophagus | ESCC | 2.47e-09 | 7.44e-02 | 0.1124 |
| Page: 1 2 3 4 5 6 |
| Tissue | Expression Dynamics | Abbreviation |
| Esophagus | 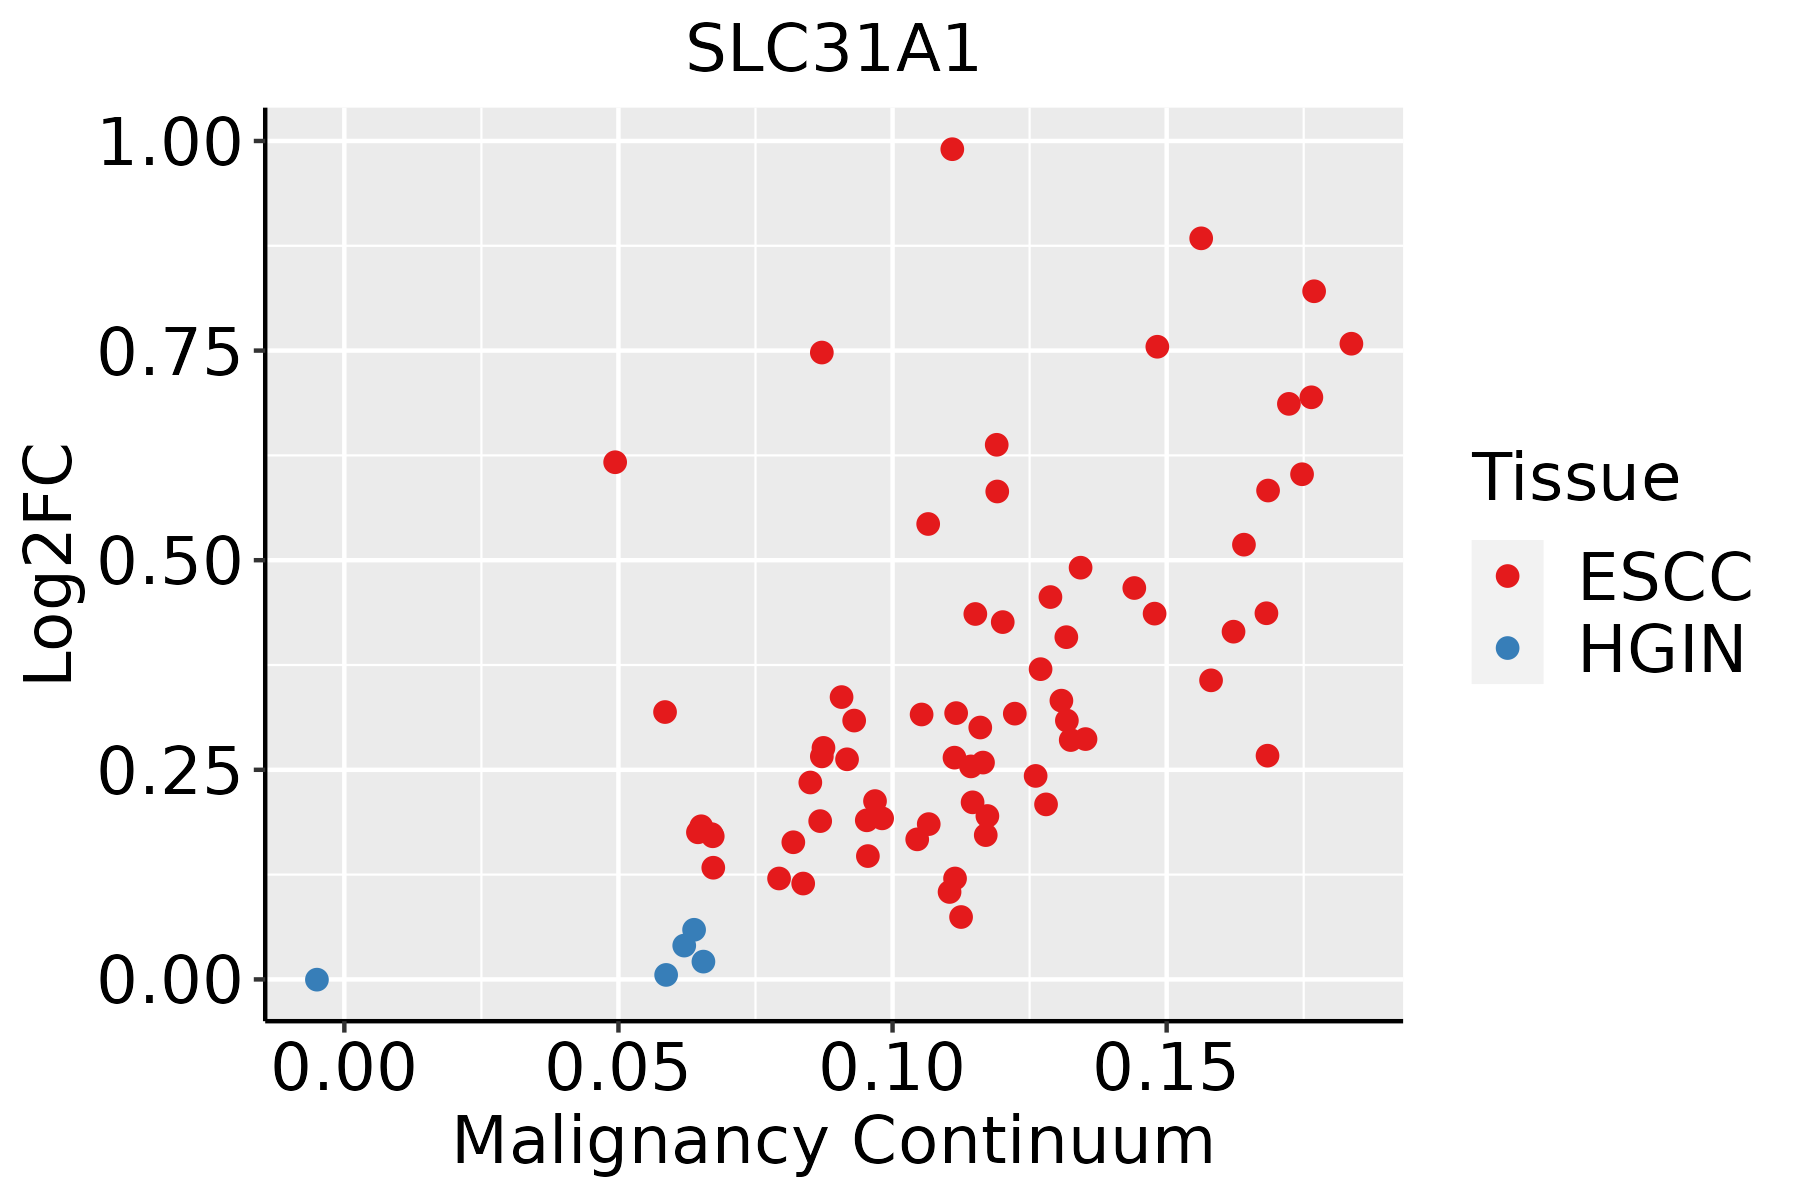 | ESCC: Esophageal squamous cell carcinoma |
| HGIN: High-grade intraepithelial neoplasias | ||
| LGIN: Low-grade intraepithelial neoplasias | ||
| Liver | 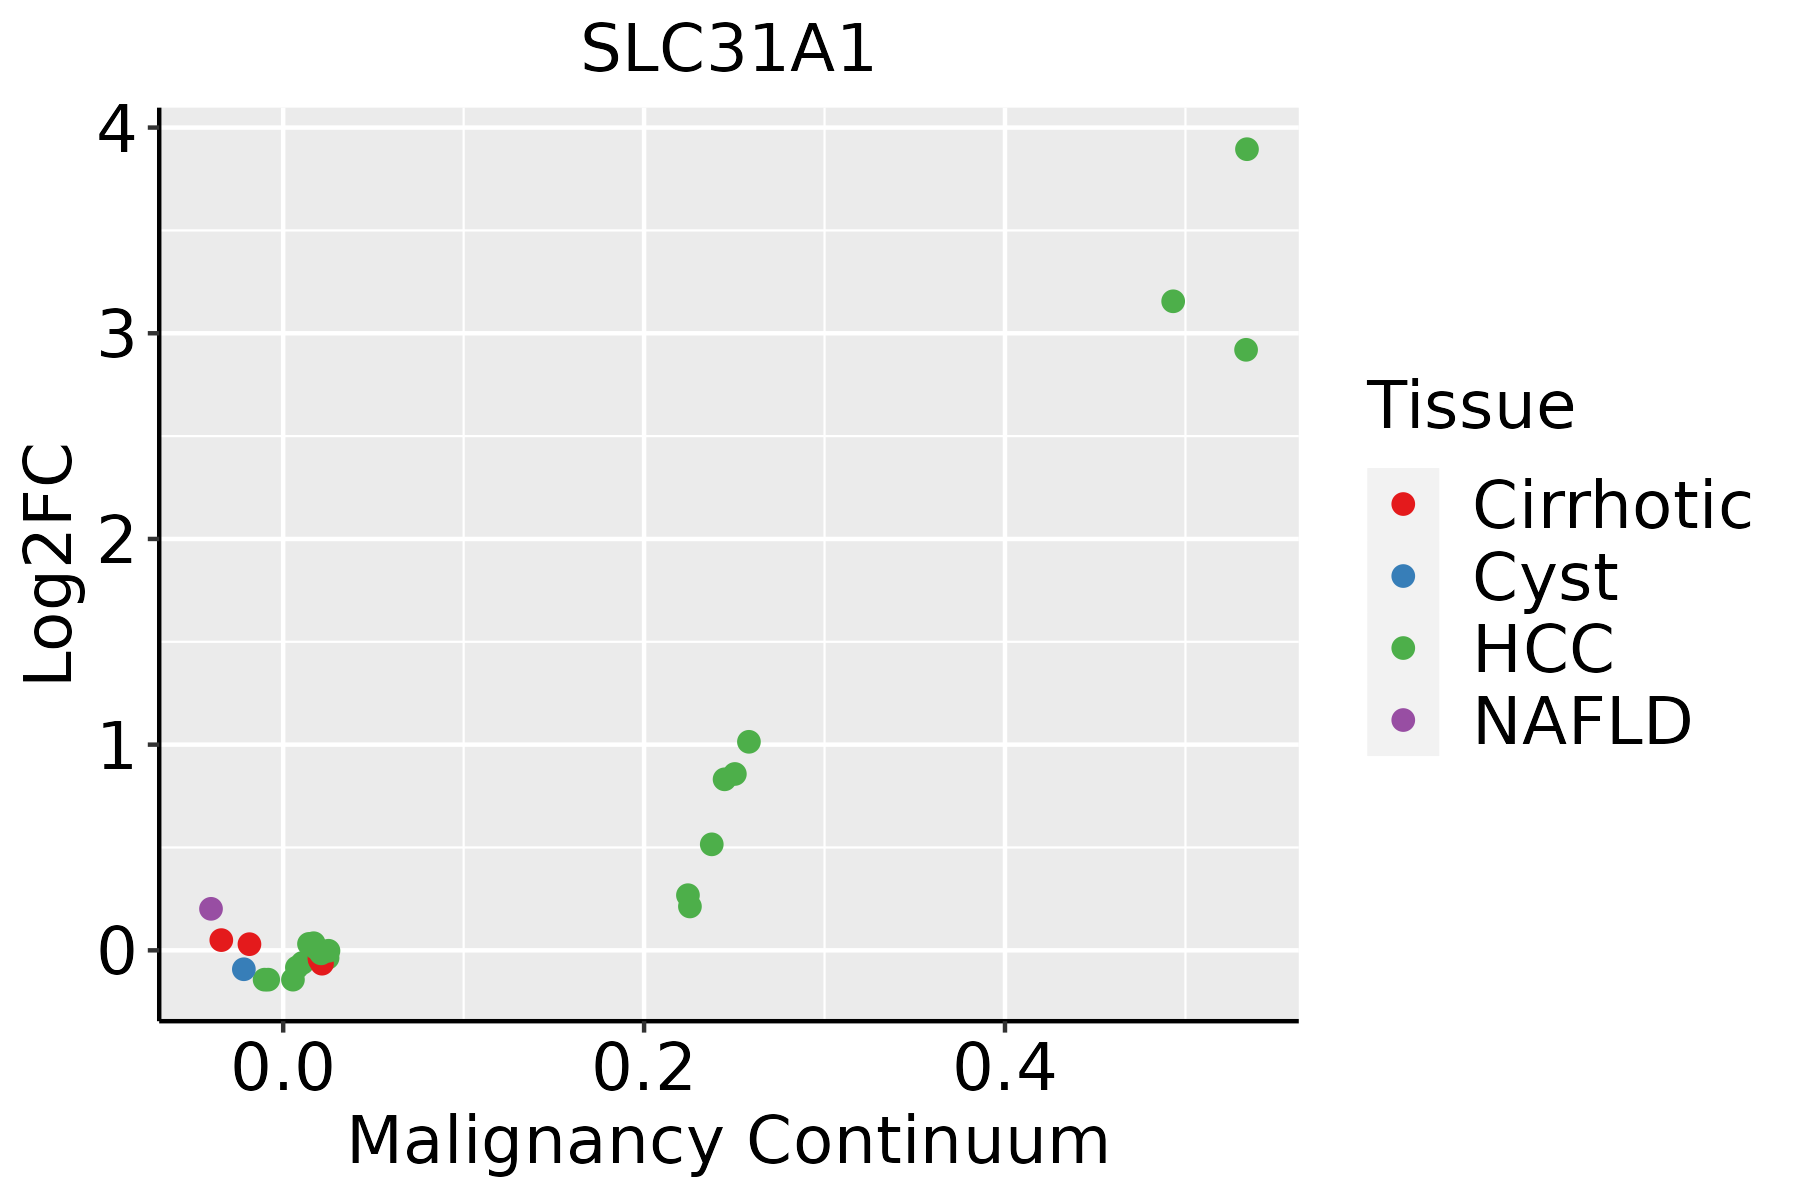 | HCC: Hepatocellular carcinoma |
| NAFLD: Non-alcoholic fatty liver disease | ||
| Oral Cavity | 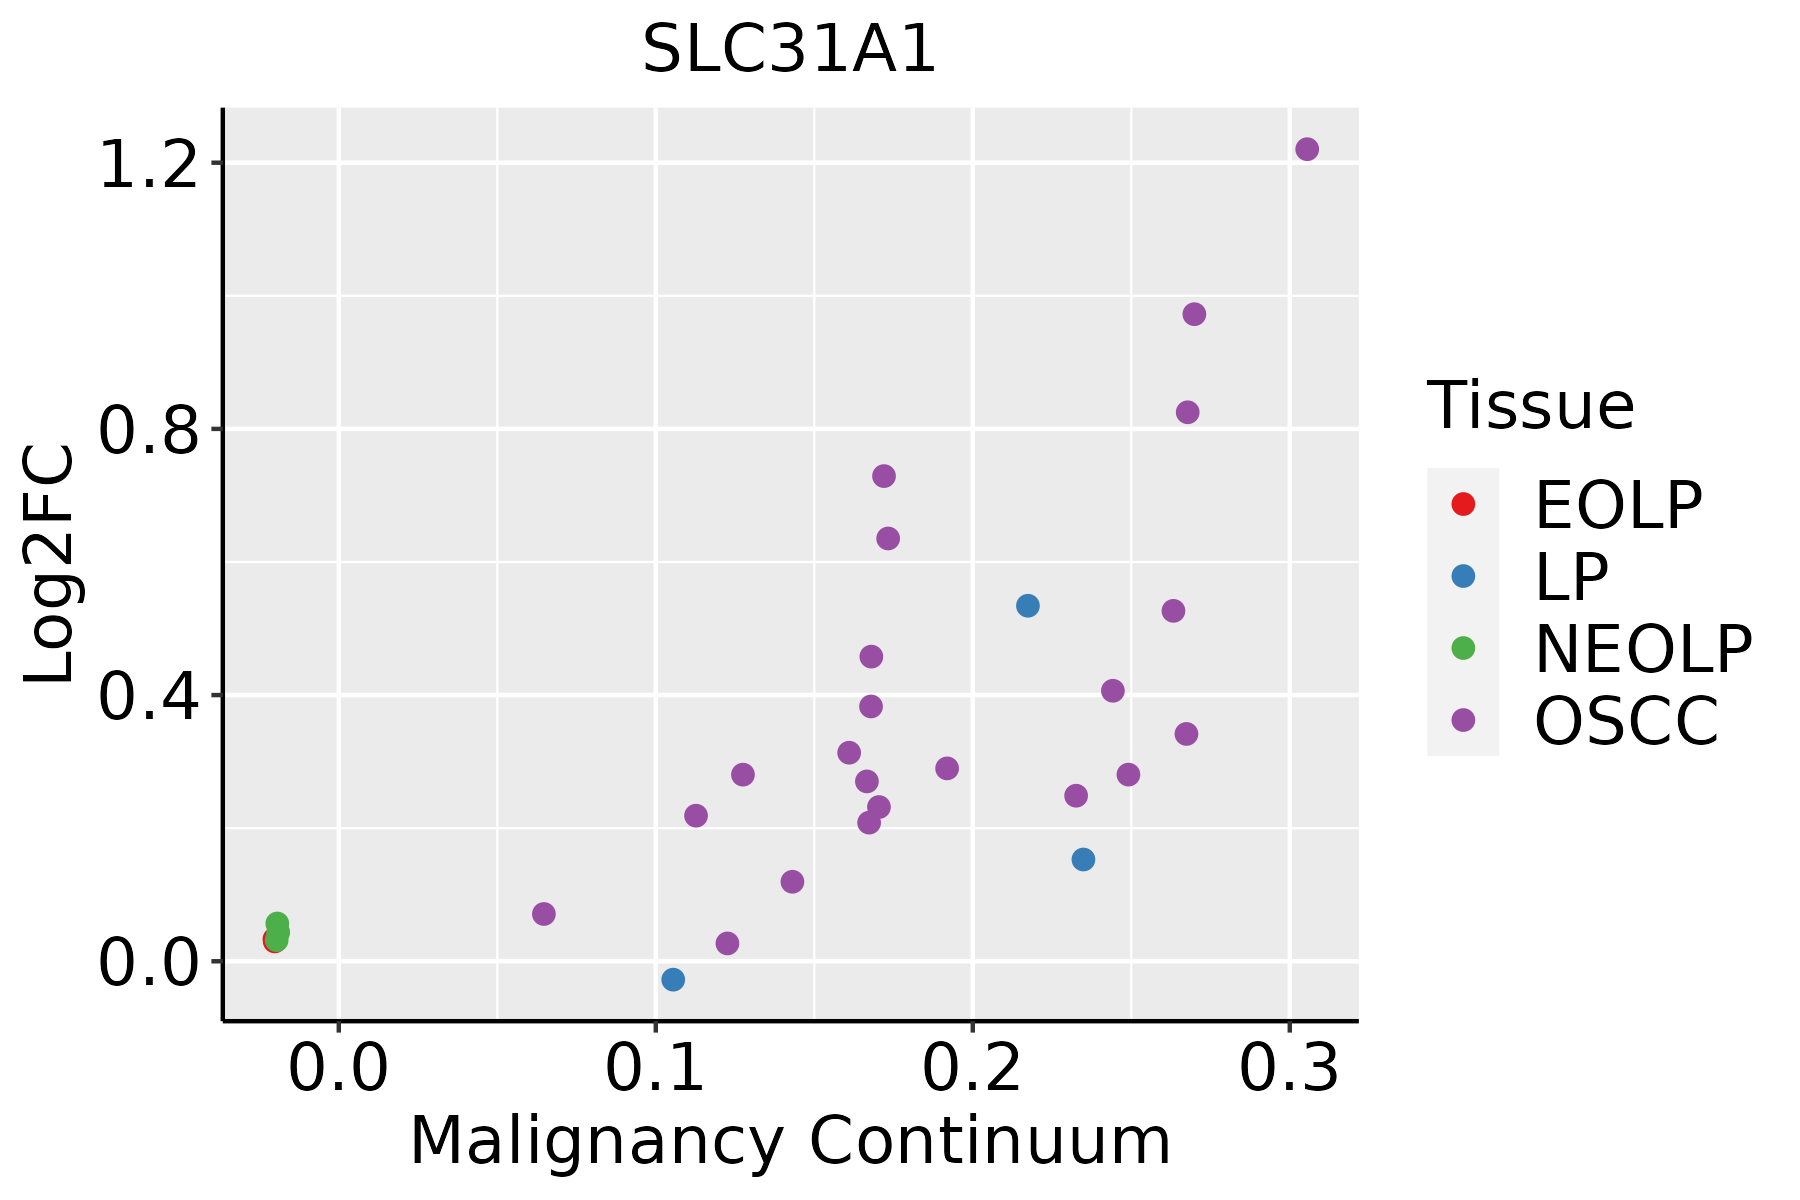 | EOLP: Erosive Oral lichen planus |
| LP: leukoplakia | ||
| NEOLP: Non-erosive oral lichen planus | ||
| OSCC: Oral squamous cell carcinoma | ||
| Skin |  | AK: Actinic keratosis |
| cSCC: Cutaneous squamous cell carcinoma | ||
| SCCIS:squamous cell carcinoma in situ | ||
| Thyroid | 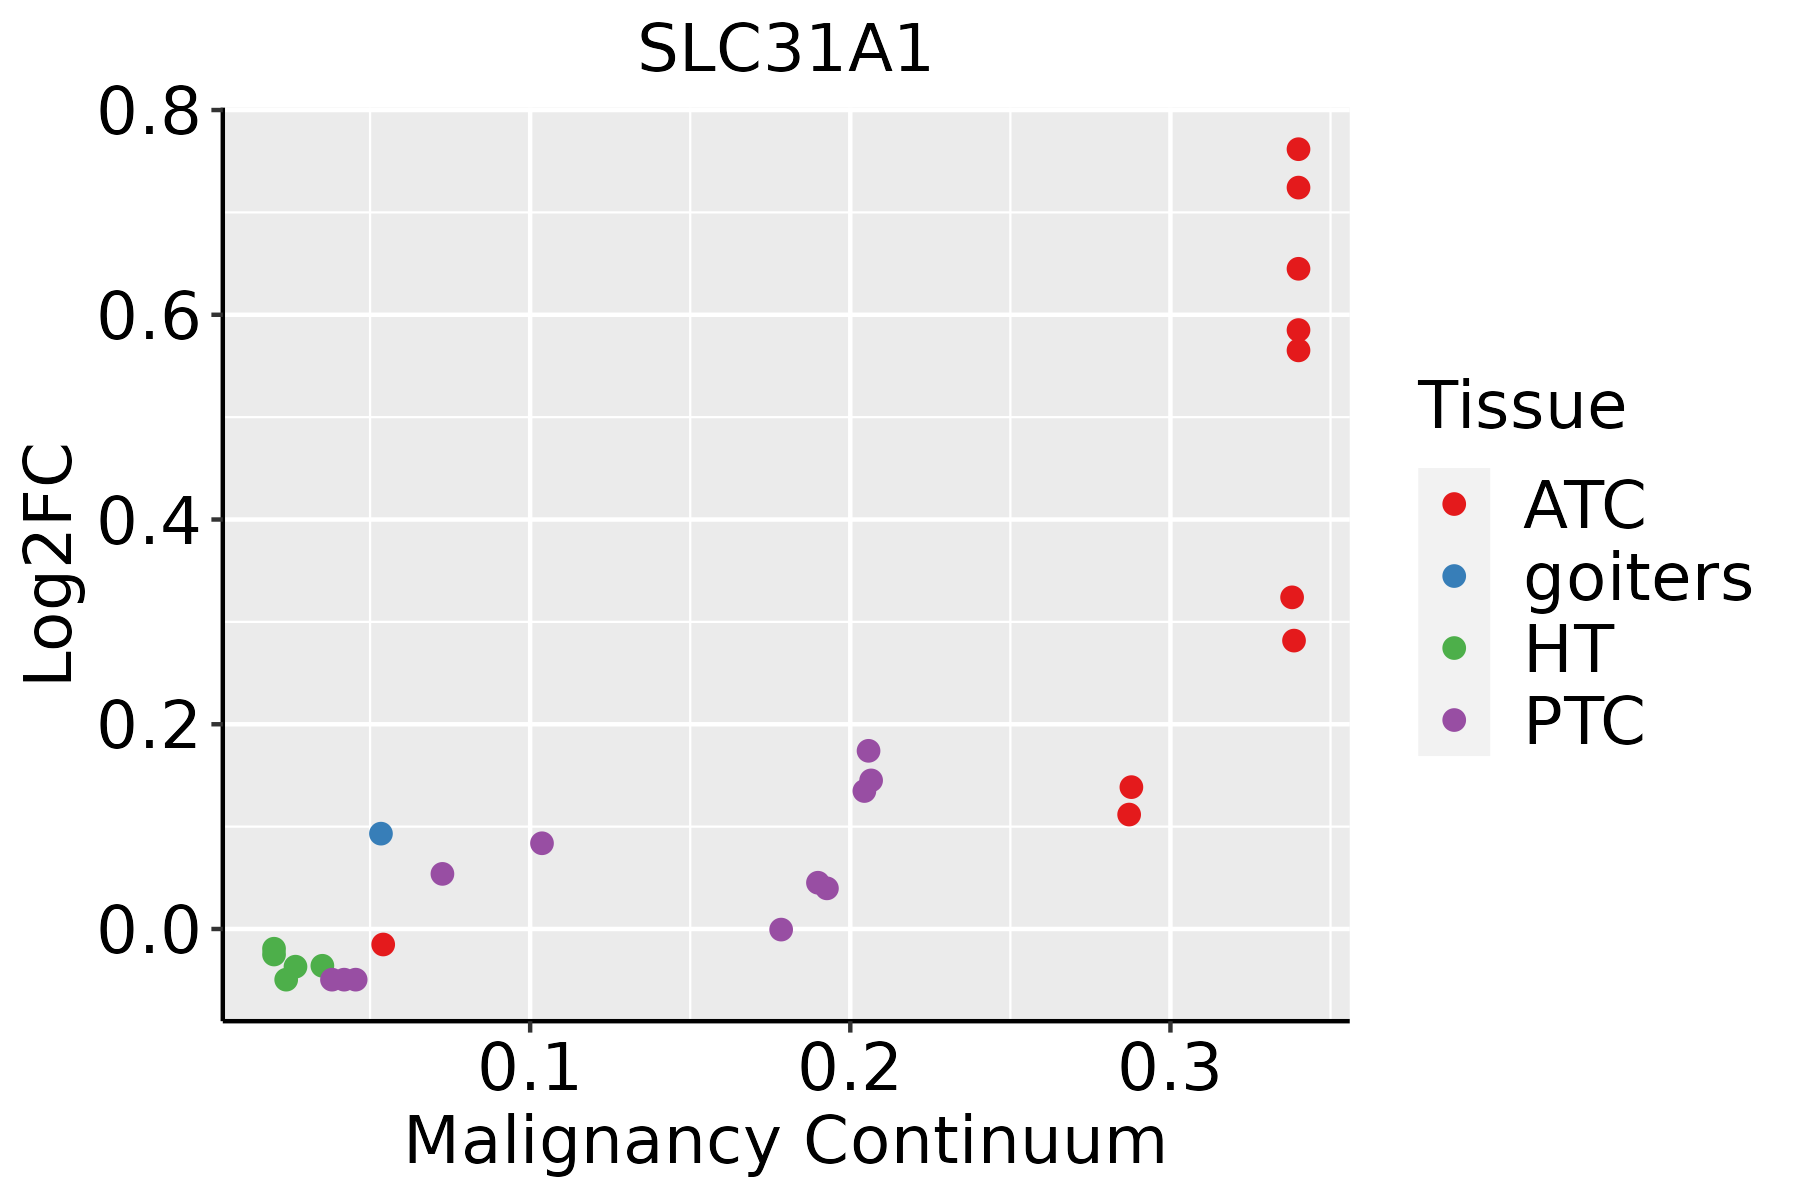 | ATC: Anaplastic thyroid cancer |
| HT: Hashimoto's thyroiditis | ||
| PTC: Papillary thyroid cancer |
| ∗log2FC in expression of this searched gene in stem-like cells from each diseased tissue sample relative to stem-like cells in normal samples in each tissue plotted against the malignancy continuum. Samples are colored based on if they are from different disease stage. |
Top |
Malignant transformation related pathway analysis |
| Find out the enriched GO biological processes and KEGG pathways involved in transition from healthy to precancer to cancer |
| Tissue | Disease Stage | Enriched GO biological Processes |
| Colorectum | AD |  |
| Colorectum | SER |  |
| Colorectum | MSS |  |
| Colorectum | MSI-H |  |
| Colorectum | FAP |  |
| ∗Top 15 enriched GO BP terms are showed in the bar plot of each disease state in each tissue. Each row represents a significant GO biological process which is colored according to the -log10(p.adjust). |
| Page: 1 2 3 4 5 6 7 8 9 |
| GO ID | Tissue | Disease Stage | Description | Gene Ratio | Bg Ratio | pvalue | p.adjust | Count |
| GO:005507617 | Esophagus | ESCC | transition metal ion homeostasis | 87/8552 | 138/18723 | 2.85e-05 | 2.37e-04 | 87 |
| GO:00469169 | Esophagus | ESCC | cellular transition metal ion homeostasis | 70/8552 | 115/18723 | 7.28e-04 | 3.79e-03 | 70 |
| GO:00550703 | Esophagus | ESCC | copper ion homeostasis | 15/8552 | 18/18723 | 1.20e-03 | 5.88e-03 | 15 |
| GO:00068781 | Esophagus | ESCC | cellular copper ion homeostasis | 12/8552 | 15/18723 | 7.31e-03 | 2.63e-02 | 12 |
| GO:00550766 | Liver | Cirrhotic | transition metal ion homeostasis | 59/4634 | 138/18723 | 2.59e-06 | 4.65e-05 | 59 |
| GO:00469164 | Liver | Cirrhotic | cellular transition metal ion homeostasis | 48/4634 | 115/18723 | 4.51e-05 | 5.30e-04 | 48 |
| GO:005507612 | Liver | HCC | transition metal ion homeostasis | 81/7958 | 138/18723 | 8.87e-05 | 7.72e-04 | 81 |
| GO:004691611 | Liver | HCC | cellular transition metal ion homeostasis | 67/7958 | 115/18723 | 4.64e-04 | 3.08e-03 | 67 |
| GO:0055070 | Liver | HCC | copper ion homeostasis | 14/7958 | 18/18723 | 2.57e-03 | 1.23e-02 | 14 |
| GO:00000411 | Liver | HCC | transition metal ion transport | 59/7958 | 105/18723 | 3.18e-03 | 1.47e-02 | 59 |
| GO:005507610 | Oral cavity | OSCC | transition metal ion homeostasis | 81/7305 | 138/18723 | 2.13e-06 | 2.72e-05 | 81 |
| GO:00469168 | Oral cavity | OSCC | cellular transition metal ion homeostasis | 64/7305 | 115/18723 | 2.13e-04 | 1.40e-03 | 64 |
| GO:00550702 | Oral cavity | OSCC | copper ion homeostasis | 14/7305 | 18/18723 | 9.51e-04 | 4.96e-03 | 14 |
| GO:0006878 | Oral cavity | OSCC | cellular copper ion homeostasis | 11/7305 | 15/18723 | 7.49e-03 | 2.75e-02 | 11 |
| GO:005507616 | Oral cavity | LP | transition metal ion homeostasis | 54/4623 | 138/18723 | 1.19e-04 | 1.40e-03 | 54 |
| GO:004691615 | Oral cavity | LP | cellular transition metal ion homeostasis | 46/4623 | 115/18723 | 2.02e-04 | 2.20e-03 | 46 |
| GO:00550701 | Oral cavity | LP | copper ion homeostasis | 10/4623 | 18/18723 | 4.91e-03 | 3.06e-02 | 10 |
| GO:005507618 | Skin | cSCC | transition metal ion homeostasis | 57/4864 | 138/18723 | 5.96e-05 | 5.86e-04 | 57 |
| GO:004691610 | Skin | cSCC | cellular transition metal ion homeostasis | 48/4864 | 115/18723 | 1.63e-04 | 1.43e-03 | 48 |
| GO:00550704 | Skin | cSCC | copper ion homeostasis | 12/4864 | 18/18723 | 3.39e-04 | 2.68e-03 | 12 |
| Page: 1 2 |
| Pathway ID | Tissue | Disease Stage | Description | Gene Ratio | Bg Ratio | pvalue | p.adjust | qvalue | Count |
| hsa015247 | Esophagus | ESCC | Platinum drug resistance | 56/4205 | 73/8465 | 1.85e-06 | 1.13e-05 | 5.78e-06 | 56 |
| hsa0152414 | Esophagus | ESCC | Platinum drug resistance | 56/4205 | 73/8465 | 1.85e-06 | 1.13e-05 | 5.78e-06 | 56 |
| hsa015244 | Liver | Cirrhotic | Platinum drug resistance | 34/2530 | 73/8465 | 1.86e-03 | 8.37e-03 | 5.16e-03 | 34 |
| hsa0152411 | Liver | Cirrhotic | Platinum drug resistance | 34/2530 | 73/8465 | 1.86e-03 | 8.37e-03 | 5.16e-03 | 34 |
| hsa015242 | Liver | HCC | Platinum drug resistance | 52/4020 | 73/8465 | 3.14e-05 | 1.88e-04 | 1.04e-04 | 52 |
| hsa015243 | Liver | HCC | Platinum drug resistance | 52/4020 | 73/8465 | 3.14e-05 | 1.88e-04 | 1.04e-04 | 52 |
| hsa015246 | Oral cavity | OSCC | Platinum drug resistance | 51/3704 | 73/8465 | 5.41e-06 | 2.75e-05 | 1.40e-05 | 51 |
| hsa0152413 | Oral cavity | OSCC | Platinum drug resistance | 51/3704 | 73/8465 | 5.41e-06 | 2.75e-05 | 1.40e-05 | 51 |
| Page: 1 |
Top |
Cell-cell communication analysis |
| Identification of potential cell-cell interactions between two cell types and their ligand-receptor pairs for different disease states |
| Ligand | Receptor | LRpair | Pathway | Tissue | Disease Stage |
| Page: 1 |
Top |
Single-cell gene regulatory network inference analysis |
| Find out the significant the regulons (TFs) and the target genes of each regulon across cell types for different disease states |
| TF | Cell Type | Tissue | Disease Stage | Target Gene | RSS | Regulon Activity |
| ∗The dot plots of a searched regulon are shown for all cell subpopulations in each disease state of each tissue based on the regulon specific score inferred using pySCENIC and by calculating the average expression. |
| Page: 1 |
Top |
Somatic mutation of malignant transformation related genes |
| Annotation of somatic variants for genes involved in malignant transformation |
| Hugo Symbol | Variant Class | Variant Classification | dbSNP RS | HGVSc | HGVSp | HGVSp Short | SWISSPROT | BIOTYPE | SIFT | PolyPhen | Tumor Sample Barcode | Tissue | Histology | Sex | Age | Stage | Therapy Types | Drugs | Outcome |
| SLC31A1 | SNV | Missense_Mutation | c.89N>T | p.Ser30Leu | p.S30L | O15431 | protein_coding | tolerated(0.16) | benign(0.036) | TCGA-A8-A092-01 | Breast | breast invasive carcinoma | Female | <65 | III/IV | Chemotherapy | paclitaxel | CR | |
| SLC31A1 | SNV | Missense_Mutation | rs757926731 | c.360N>G | p.His120Gln | p.H120Q | O15431 | protein_coding | tolerated(0.32) | benign(0.147) | TCGA-B6-A0I8-01 | Breast | breast invasive carcinoma | Female | <65 | I/II | Unknown | Unknown | PD |
| SLC31A1 | insertion | Nonsense_Mutation | novel | c.489_490insTTTGCCCCATCACTGACACTTTGAGCATGGTCTTTATTTTATTGT | p.Ala163_Val164insPheAlaProSerLeuThrLeuTerAlaTrpSerLeuPheTyrCys | p.A163_V164insFAPSLTL*AWSLFYC | O15431 | protein_coding | TCGA-A2-A0EQ-01 | Breast | breast invasive carcinoma | Female | <65 | I/II | Chemotherapy | adriamycin | SD | ||
| SLC31A1 | SNV | Missense_Mutation | rs752644549 | c.304N>T | p.Arg102Cys | p.R102C | O15431 | protein_coding | deleterious(0) | probably_damaging(0.939) | TCGA-AG-A002-01 | Colorectum | rectum adenocarcinoma | Male | <65 | I/II | Unknown | Unknown | SD |
| SLC31A1 | SNV | Missense_Mutation | rs143362872 | c.179N>A | p.Gly60Asp | p.G60D | O15431 | protein_coding | tolerated(0.17) | possibly_damaging(0.451) | TCGA-AG-A00Y-01 | Colorectum | rectum adenocarcinoma | Male | >=65 | I/II | Unknown | Unknown | PD |
| SLC31A1 | SNV | Missense_Mutation | novel | c.218N>C | p.Phe73Ser | p.F73S | O15431 | protein_coding | deleterious(0.04) | possibly_damaging(0.551) | TCGA-F5-6814-01 | Colorectum | rectum adenocarcinoma | Male | <65 | I/II | Unknown | Unknown | SD |
| SLC31A1 | SNV | Missense_Mutation | novel | c.197N>A | p.Ala66Asp | p.A66D | O15431 | protein_coding | deleterious(0.01) | benign(0.283) | TCGA-A5-A0G1-01 | Endometrium | uterine corpus endometrioid carcinoma | Female | >=65 | I/II | Unknown | Unknown | SD |
| SLC31A1 | SNV | Missense_Mutation | novel | c.409N>A | p.Val137Met | p.V137M | O15431 | protein_coding | tolerated(0.1) | possibly_damaging(0.541) | TCGA-A5-A0G2-01 | Endometrium | uterine corpus endometrioid carcinoma | Female | <65 | III/IV | Unknown | Unknown | SD |
| SLC31A1 | SNV | Missense_Mutation | novel | c.280N>A | p.Leu94Met | p.L94M | O15431 | protein_coding | deleterious(0.04) | possibly_damaging(0.621) | TCGA-AX-A06F-01 | Endometrium | uterine corpus endometrioid carcinoma | Female | <65 | III/IV | Chemotherapy | carboplatin | SD |
| SLC31A1 | SNV | Missense_Mutation | c.232N>G | p.Leu78Val | p.L78V | O15431 | protein_coding | tolerated(0.19) | benign(0.033) | TCGA-AX-A0J0-01 | Endometrium | uterine corpus endometrioid carcinoma | Female | <65 | I/II | Unknown | Unknown | SD |
| Page: 1 2 |
Top |
Related drugs of malignant transformation related genes |
| Identification of chemicals and drugs interact with genes involved in malignant transfromation |
| (DGIdb 4.0) |
| Entrez ID | Symbol | Category | Interaction Types | Drug Claim Name | Drug Name | PMIDs |
| 1317 | SLC31A1 | TRANSPORTER | cisplatin | CISPLATIN | 22725681,22516052 | |
| 1317 | SLC31A1 | TRANSPORTER | carboplatin | CARBOPLATIN | 22725681 |
| Page: 1 |

Copyright 2023-Present -The University of Texas Health Science Center at Houston |