
|
|||||
|
 | |
| |
| |
| |
| |
| |
|
Gene: SLC30A9 |
Gene summary for SLC30A9 |
| Gene information | Species | Human | Gene symbol | SLC30A9 | Gene ID | 10463 |
| Gene name | solute carrier family 30 member 9 | |
| Gene Alias | BILAPES | |
| Cytomap | 4p13 | |
| Gene Type | protein-coding | GO ID | GO:0000041 | UniProtAcc | A0A0S2Z514 |
Top |
Malignant transformation analysis |
| Identification of the aberrant gene expression in precancerous and cancerous lesions by comparing the gene expression of stem-like cells in diseased tissues with normal stem cells |
| Entrez ID | Symbol | Replicates | Species | Organ | Tissue | Adj P-value | Log2FC | Malignancy |
| 10463 | SLC30A9 | LZE4T | Human | Esophagus | ESCC | 3.74e-07 | 2.63e-01 | 0.0811 |
| 10463 | SLC30A9 | LZE7T | Human | Esophagus | ESCC | 4.94e-07 | 6.54e-01 | 0.0667 |
| 10463 | SLC30A9 | LZE8T | Human | Esophagus | ESCC | 7.15e-03 | 2.68e-01 | 0.067 |
| 10463 | SLC30A9 | LZE20T | Human | Esophagus | ESCC | 1.84e-05 | 2.53e-01 | 0.0662 |
| 10463 | SLC30A9 | LZE24T | Human | Esophagus | ESCC | 5.18e-11 | 2.83e-01 | 0.0596 |
| 10463 | SLC30A9 | LZE6T | Human | Esophagus | ESCC | 1.82e-02 | 3.30e-01 | 0.0845 |
| 10463 | SLC30A9 | P1T-E | Human | Esophagus | ESCC | 5.78e-10 | 3.71e-01 | 0.0875 |
| 10463 | SLC30A9 | P2T-E | Human | Esophagus | ESCC | 2.06e-30 | 6.24e-01 | 0.1177 |
| 10463 | SLC30A9 | P4T-E | Human | Esophagus | ESCC | 1.96e-29 | 5.40e-01 | 0.1323 |
| 10463 | SLC30A9 | P5T-E | Human | Esophagus | ESCC | 7.57e-12 | 1.04e-01 | 0.1327 |
| 10463 | SLC30A9 | P8T-E | Human | Esophagus | ESCC | 7.48e-25 | 4.64e-01 | 0.0889 |
| 10463 | SLC30A9 | P9T-E | Human | Esophagus | ESCC | 1.33e-07 | 1.70e-01 | 0.1131 |
| 10463 | SLC30A9 | P10T-E | Human | Esophagus | ESCC | 1.41e-22 | 2.81e-01 | 0.116 |
| 10463 | SLC30A9 | P11T-E | Human | Esophagus | ESCC | 3.63e-17 | 6.79e-01 | 0.1426 |
| 10463 | SLC30A9 | P12T-E | Human | Esophagus | ESCC | 1.03e-18 | 3.97e-01 | 0.1122 |
| 10463 | SLC30A9 | P15T-E | Human | Esophagus | ESCC | 3.71e-08 | 2.97e-01 | 0.1149 |
| 10463 | SLC30A9 | P16T-E | Human | Esophagus | ESCC | 4.60e-33 | 6.29e-01 | 0.1153 |
| 10463 | SLC30A9 | P17T-E | Human | Esophagus | ESCC | 3.74e-05 | 2.36e-01 | 0.1278 |
| 10463 | SLC30A9 | P19T-E | Human | Esophagus | ESCC | 1.92e-07 | 4.37e-01 | 0.1662 |
| 10463 | SLC30A9 | P20T-E | Human | Esophagus | ESCC | 1.81e-10 | 2.28e-01 | 0.1124 |
| Page: 1 2 3 4 5 6 |
| Tissue | Expression Dynamics | Abbreviation |
| Esophagus |  | ESCC: Esophageal squamous cell carcinoma |
| HGIN: High-grade intraepithelial neoplasias | ||
| LGIN: Low-grade intraepithelial neoplasias | ||
| Liver | 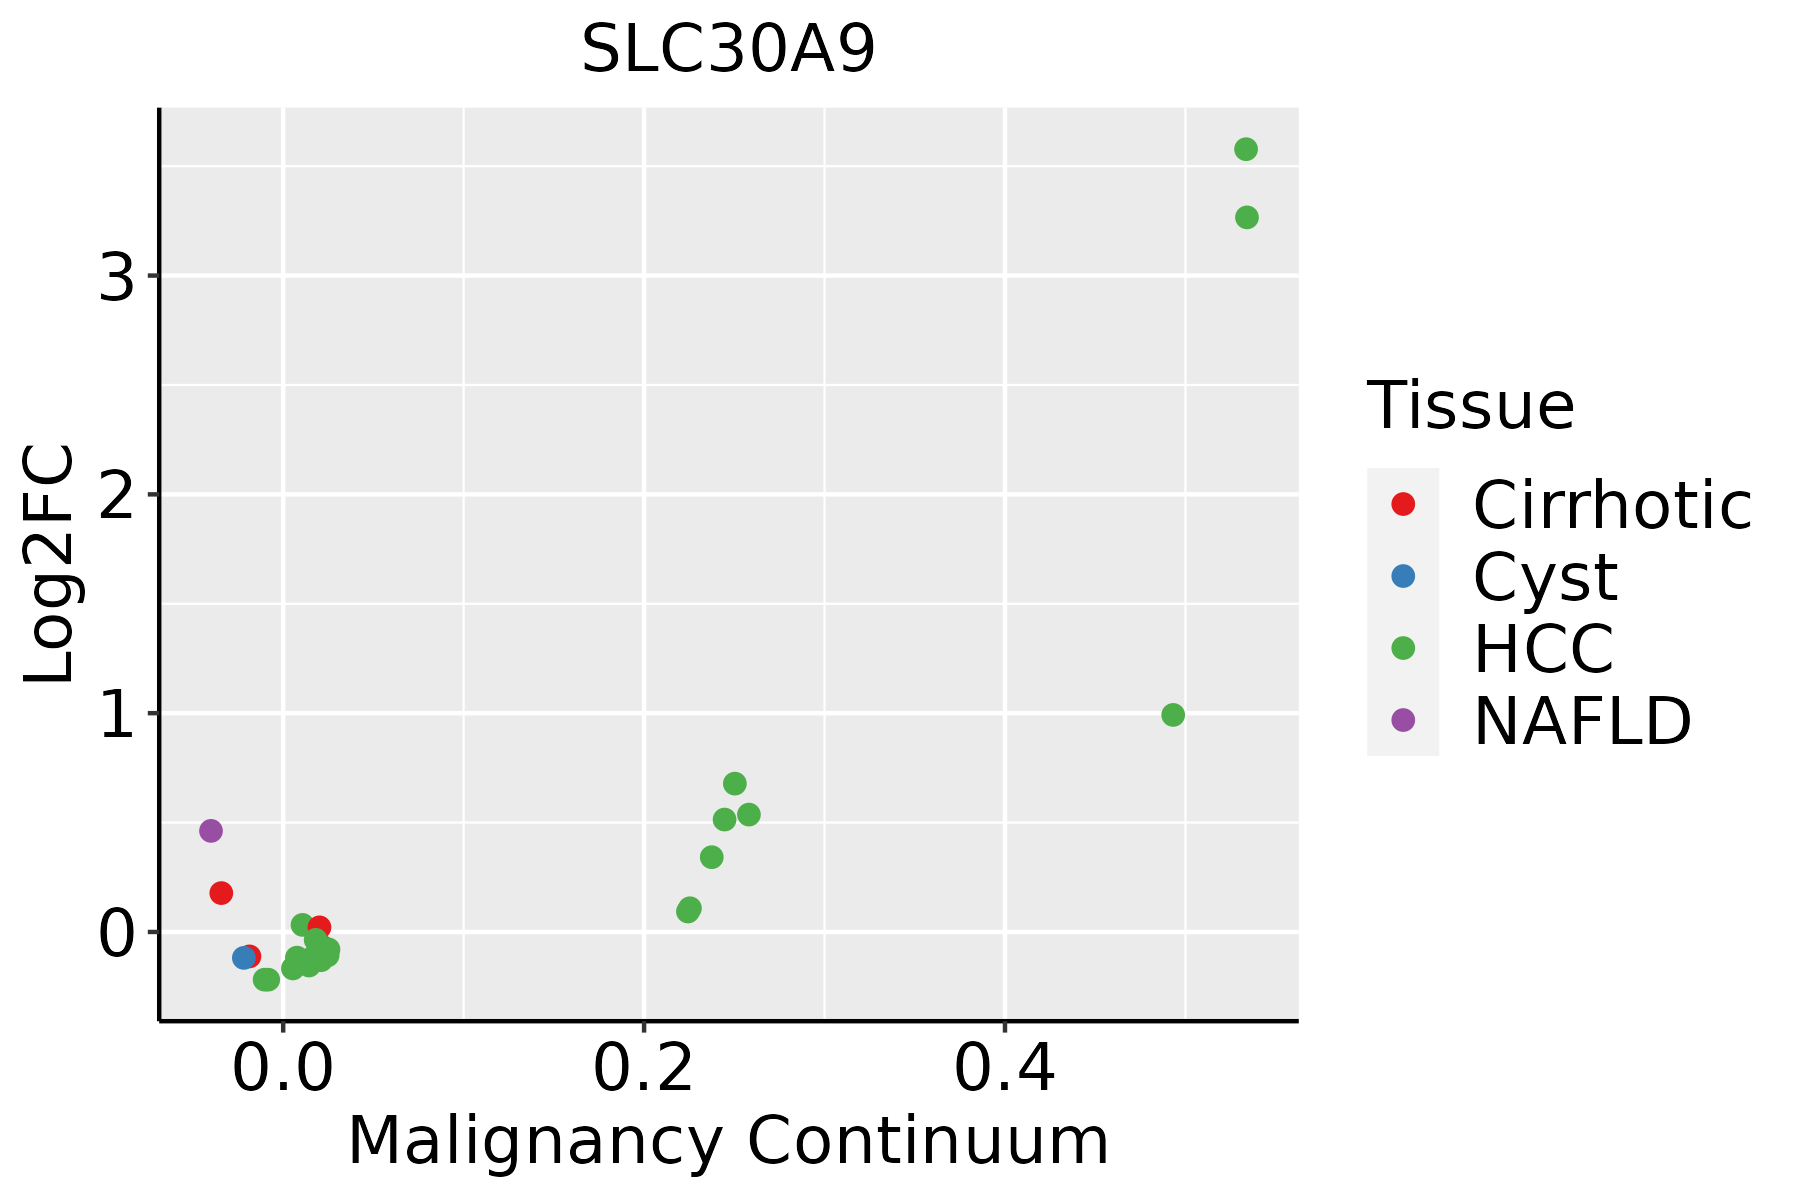 | HCC: Hepatocellular carcinoma |
| NAFLD: Non-alcoholic fatty liver disease | ||
| Oral Cavity |  | EOLP: Erosive Oral lichen planus |
| LP: leukoplakia | ||
| NEOLP: Non-erosive oral lichen planus | ||
| OSCC: Oral squamous cell carcinoma | ||
| Skin |  | AK: Actinic keratosis |
| cSCC: Cutaneous squamous cell carcinoma | ||
| SCCIS:squamous cell carcinoma in situ | ||
| Thyroid | 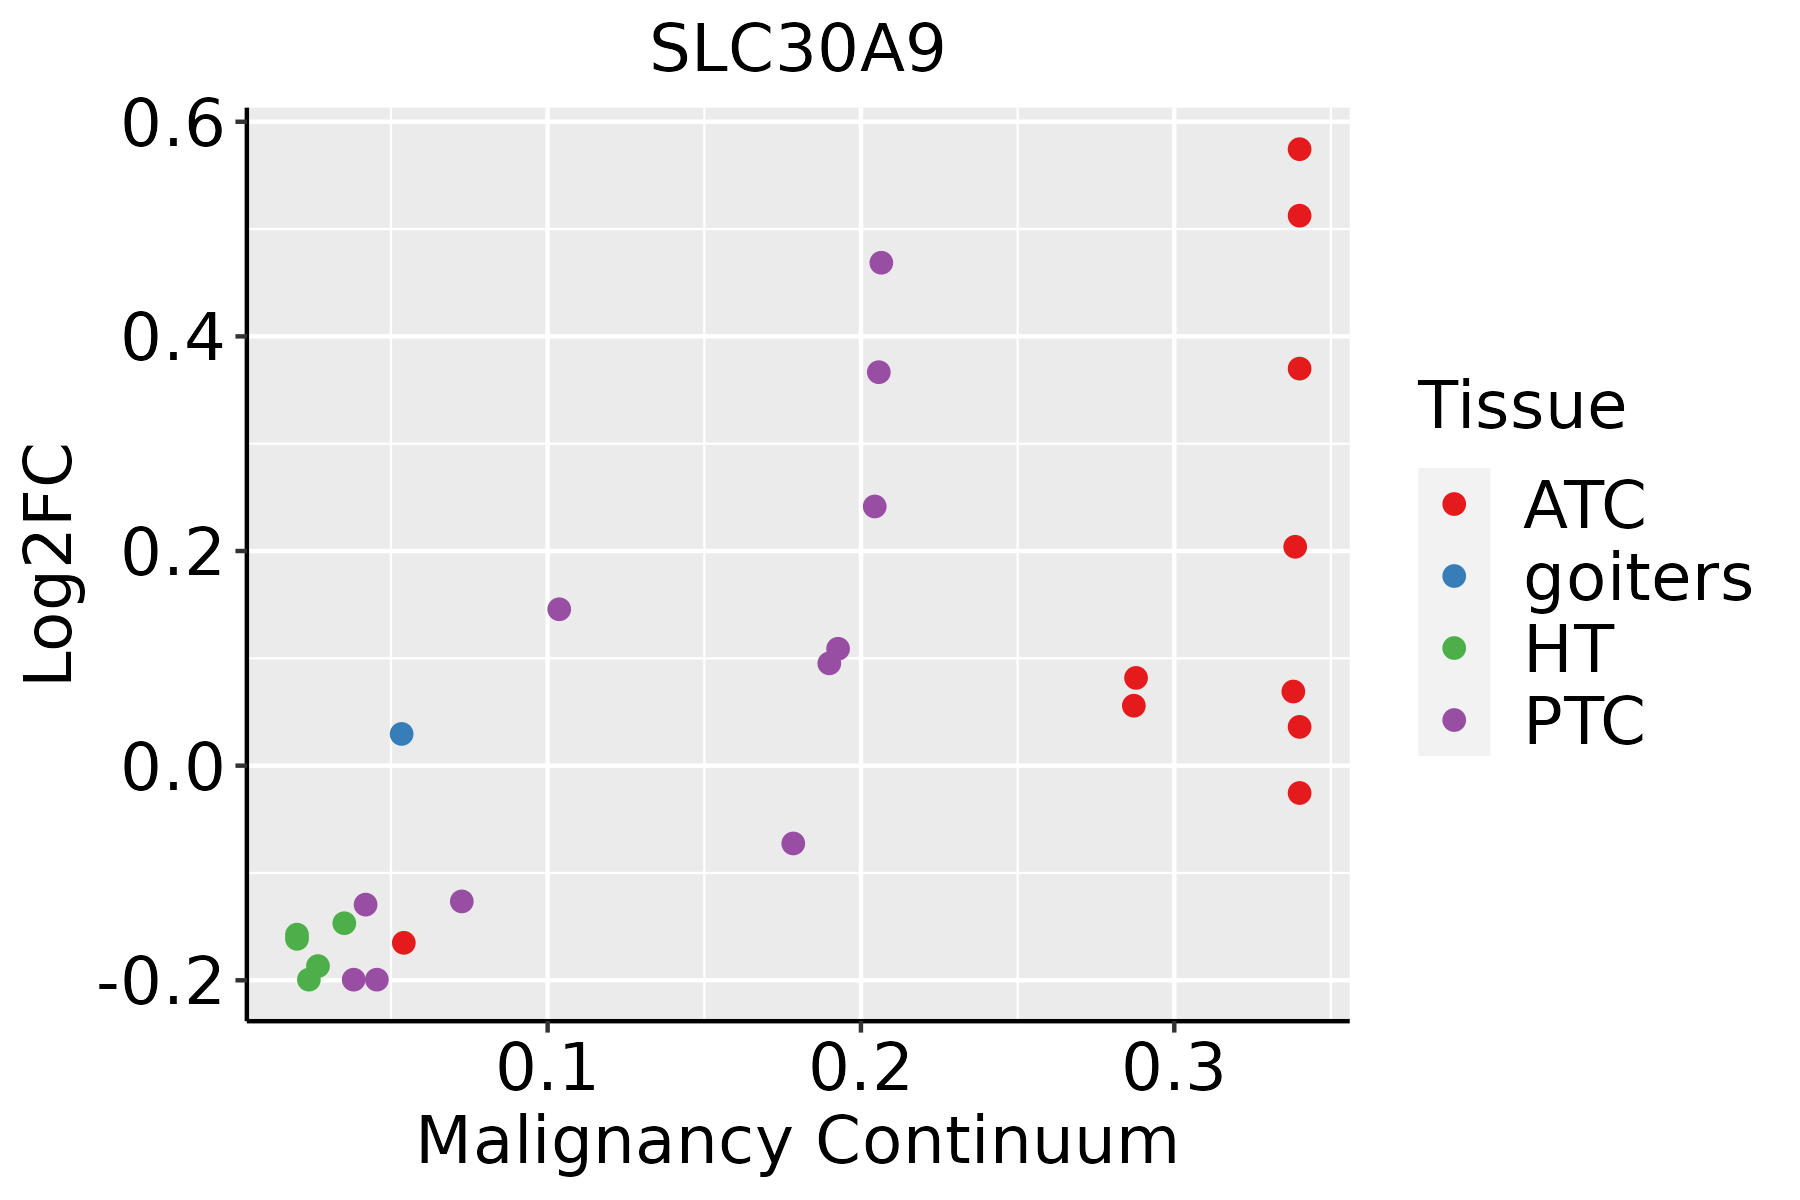 | ATC: Anaplastic thyroid cancer |
| HT: Hashimoto's thyroiditis | ||
| PTC: Papillary thyroid cancer |
| ∗log2FC in expression of this searched gene in stem-like cells from each diseased tissue sample relative to stem-like cells in normal samples in each tissue plotted against the malignancy continuum. Samples are colored based on if they are from different disease stage. |
Top |
Malignant transformation related pathway analysis |
| Find out the enriched GO biological processes and KEGG pathways involved in transition from healthy to precancer to cancer |
| Tissue | Disease Stage | Enriched GO biological Processes |
| Colorectum | AD |  |
| Colorectum | SER |  |
| Colorectum | MSS |  |
| Colorectum | MSI-H |  |
| Colorectum | FAP |  |
| ∗Top 15 enriched GO BP terms are showed in the bar plot of each disease state in each tissue. Each row represents a significant GO biological process which is colored according to the -log10(p.adjust). |
| Page: 1 2 3 4 5 6 7 8 9 |
| GO ID | Tissue | Disease Stage | Description | Gene Ratio | Bg Ratio | pvalue | p.adjust | Count |
| GO:005507617 | Esophagus | ESCC | transition metal ion homeostasis | 87/8552 | 138/18723 | 2.85e-05 | 2.37e-04 | 87 |
| GO:00062891 | Esophagus | ESCC | nucleotide-excision repair | 42/8552 | 60/18723 | 1.18e-04 | 8.14e-04 | 42 |
| GO:00469169 | Esophagus | ESCC | cellular transition metal ion homeostasis | 70/8552 | 115/18723 | 7.28e-04 | 3.79e-03 | 70 |
| GO:00550766 | Liver | Cirrhotic | transition metal ion homeostasis | 59/4634 | 138/18723 | 2.59e-06 | 4.65e-05 | 59 |
| GO:00469164 | Liver | Cirrhotic | cellular transition metal ion homeostasis | 48/4634 | 115/18723 | 4.51e-05 | 5.30e-04 | 48 |
| GO:00068823 | Liver | Cirrhotic | cellular zinc ion homeostasis | 17/4634 | 38/18723 | 5.62e-03 | 2.84e-02 | 17 |
| GO:00550693 | Liver | Cirrhotic | zinc ion homeostasis | 17/4634 | 40/18723 | 1.04e-02 | 4.61e-02 | 17 |
| GO:005507612 | Liver | HCC | transition metal ion homeostasis | 81/7958 | 138/18723 | 8.87e-05 | 7.72e-04 | 81 |
| GO:004691611 | Liver | HCC | cellular transition metal ion homeostasis | 67/7958 | 115/18723 | 4.64e-04 | 3.08e-03 | 67 |
| GO:00000411 | Liver | HCC | transition metal ion transport | 59/7958 | 105/18723 | 3.18e-03 | 1.47e-02 | 59 |
| GO:000688212 | Liver | HCC | cellular zinc ion homeostasis | 24/7958 | 38/18723 | 8.20e-03 | 3.22e-02 | 24 |
| GO:005507610 | Oral cavity | OSCC | transition metal ion homeostasis | 81/7305 | 138/18723 | 2.13e-06 | 2.72e-05 | 81 |
| GO:00469168 | Oral cavity | OSCC | cellular transition metal ion homeostasis | 64/7305 | 115/18723 | 2.13e-04 | 1.40e-03 | 64 |
| GO:0006289 | Oral cavity | OSCC | nucleotide-excision repair | 37/7305 | 60/18723 | 3.15e-04 | 1.96e-03 | 37 |
| GO:00550695 | Oral cavity | OSCC | zinc ion homeostasis | 24/7305 | 40/18723 | 5.76e-03 | 2.22e-02 | 24 |
| GO:00068825 | Oral cavity | OSCC | cellular zinc ion homeostasis | 23/7305 | 38/18723 | 5.87e-03 | 2.24e-02 | 23 |
| GO:005507616 | Oral cavity | LP | transition metal ion homeostasis | 54/4623 | 138/18723 | 1.19e-04 | 1.40e-03 | 54 |
| GO:004691615 | Oral cavity | LP | cellular transition metal ion homeostasis | 46/4623 | 115/18723 | 2.02e-04 | 2.20e-03 | 46 |
| GO:000688213 | Oral cavity | EOLP | cellular zinc ion homeostasis | 11/2218 | 38/18723 | 3.60e-03 | 2.03e-02 | 11 |
| GO:005506912 | Oral cavity | EOLP | zinc ion homeostasis | 11/2218 | 40/18723 | 5.53e-03 | 2.86e-02 | 11 |
| Page: 1 2 |
| Pathway ID | Tissue | Disease Stage | Description | Gene Ratio | Bg Ratio | pvalue | p.adjust | qvalue | Count |
| Page: 1 |
Top |
Cell-cell communication analysis |
| Identification of potential cell-cell interactions between two cell types and their ligand-receptor pairs for different disease states |
| Ligand | Receptor | LRpair | Pathway | Tissue | Disease Stage |
| Page: 1 |
Top |
Single-cell gene regulatory network inference analysis |
| Find out the significant the regulons (TFs) and the target genes of each regulon across cell types for different disease states |
| TF | Cell Type | Tissue | Disease Stage | Target Gene | RSS | Regulon Activity |
| ∗The dot plots of a searched regulon are shown for all cell subpopulations in each disease state of each tissue based on the regulon specific score inferred using pySCENIC and by calculating the average expression. |
| Page: 1 |
Top |
Somatic mutation of malignant transformation related genes |
| Annotation of somatic variants for genes involved in malignant transformation |
| Hugo Symbol | Variant Class | Variant Classification | dbSNP RS | HGVSc | HGVSp | HGVSp Short | SWISSPROT | BIOTYPE | SIFT | PolyPhen | Tumor Sample Barcode | Tissue | Histology | Sex | Age | Stage | Therapy Types | Drugs | Outcome |
| SLC30A9 | SNV | Missense_Mutation | c.1401G>T | p.Glu467Asp | p.E467D | Q6PML9 | protein_coding | tolerated(0.07) | probably_damaging(0.919) | TCGA-A2-A25A-01 | Breast | breast invasive carcinoma | Female | <65 | I/II | Unspecific | Cytoxan | SD | |
| SLC30A9 | SNV | Missense_Mutation | novel | c.840G>T | p.Gln280His | p.Q280H | Q6PML9 | protein_coding | deleterious(0) | probably_damaging(0.998) | TCGA-A7-A426-01 | Breast | breast invasive carcinoma | Female | <65 | III/IV | Chemotherapy | adriamycin | SD |
| SLC30A9 | SNV | Missense_Mutation | novel | c.1573N>A | p.Glu525Lys | p.E525K | Q6PML9 | protein_coding | deleterious(0.03) | benign(0.444) | TCGA-A7-A4SA-01 | Breast | breast invasive carcinoma | Female | <65 | I/II | Chemotherapy | doxorubicin | CR |
| SLC30A9 | SNV | Missense_Mutation | novel | c.630A>C | p.Lys210Asn | p.K210N | Q6PML9 | protein_coding | tolerated(0.07) | benign(0.028) | TCGA-AN-A046-01 | Breast | breast invasive carcinoma | Female | >=65 | I/II | Unknown | Unknown | SD |
| SLC30A9 | SNV | Missense_Mutation | novel | c.1564A>G | p.Lys522Glu | p.K522E | Q6PML9 | protein_coding | tolerated(0.14) | benign(0.241) | TCGA-AN-A046-01 | Breast | breast invasive carcinoma | Female | >=65 | I/II | Unknown | Unknown | SD |
| SLC30A9 | SNV | Missense_Mutation | rs375750615 | c.916N>T | p.Arg306Cys | p.R306C | Q6PML9 | protein_coding | deleterious(0) | probably_damaging(0.999) | TCGA-BH-A0HA-01 | Breast | breast invasive carcinoma | Female | <65 | I/II | Unknown | Unknown | SD |
| SLC30A9 | SNV | Missense_Mutation | c.1156N>G | p.Arg386Gly | p.R386G | Q6PML9 | protein_coding | deleterious(0.04) | possibly_damaging(0.498) | TCGA-BH-A18R-01 | Breast | breast invasive carcinoma | Female | <65 | I/II | Unknown | Unknown | SD | |
| SLC30A9 | SNV | Missense_Mutation | novel | c.944T>C | p.Val315Ala | p.V315A | Q6PML9 | protein_coding | deleterious(0) | probably_damaging(0.983) | TCGA-2W-A8YY-01 | Cervix | cervical & endocervical cancer | Female | <65 | I/II | Chemotherapy | cisplatin | CR |
| SLC30A9 | SNV | Missense_Mutation | c.1289N>C | p.Val430Ala | p.V430A | Q6PML9 | protein_coding | deleterious(0) | probably_damaging(0.973) | TCGA-A6-3809-01 | Colorectum | colon adenocarcinoma | Female | >=65 | I/II | Unknown | Unknown | SD | |
| SLC30A9 | SNV | Missense_Mutation | c.1499T>C | p.Val500Ala | p.V500A | Q6PML9 | protein_coding | tolerated(0.48) | benign(0.262) | TCGA-A6-5665-01 | Colorectum | colon adenocarcinoma | Female | >=65 | I/II | Unknown | Unknown | PD |
| Page: 1 2 3 4 5 6 7 |
Top |
Related drugs of malignant transformation related genes |
| Identification of chemicals and drugs interact with genes involved in malignant transfromation |
| (DGIdb 4.0) |
| Entrez ID | Symbol | Category | Interaction Types | Drug Claim Name | Drug Name | PMIDs |
| 10463 | SLC30A9 | TRANSPORTER, NUCLEAR HORMONE RECEPTOR | aspirin | ASPIRIN |
| Page: 1 |

Copyright 2023-Present -The University of Texas Health Science Center at Houston |