
|
|||||
|
 | |
| |
| |
| |
| |
| |
|
Gene: SLC30A4 |
Gene summary for SLC30A4 |
| Gene information | Species | Human | Gene symbol | SLC30A4 | Gene ID | 7782 |
| Gene name | solute carrier family 30 member 4 | |
| Gene Alias | ZNT4 | |
| Cytomap | 15q21.1 | |
| Gene Type | protein-coding | GO ID | GO:0000041 | UniProtAcc | O14863 |
Top |
Malignant transformation analysis |
| Identification of the aberrant gene expression in precancerous and cancerous lesions by comparing the gene expression of stem-like cells in diseased tissues with normal stem cells |
| Entrez ID | Symbol | Replicates | Species | Organ | Tissue | Adj P-value | Log2FC | Malignancy |
| 7782 | SLC30A4 | HTA11_1938_2000001011 | Human | Colorectum | AD | 1.14e-03 | 5.15e-01 | -0.0811 |
| 7782 | SLC30A4 | HTA11_78_2000001011 | Human | Colorectum | AD | 4.26e-12 | 6.46e-01 | -0.1088 |
| 7782 | SLC30A4 | HTA11_347_2000001011 | Human | Colorectum | AD | 1.62e-41 | 1.06e+00 | -0.1954 |
| 7782 | SLC30A4 | HTA11_83_2000001011 | Human | Colorectum | SER | 1.04e-03 | 4.93e-01 | -0.1526 |
| 7782 | SLC30A4 | HTA11_696_2000001011 | Human | Colorectum | AD | 4.97e-06 | 4.91e-01 | -0.1464 |
| 7782 | SLC30A4 | HTA11_866_2000001011 | Human | Colorectum | AD | 4.08e-06 | 3.47e-01 | -0.1001 |
| 7782 | SLC30A4 | HTA11_546_2000001011 | Human | Colorectum | AD | 5.40e-10 | 6.77e-01 | -0.0842 |
| 7782 | SLC30A4 | HTA11_7862_2000001011 | Human | Colorectum | AD | 1.58e-04 | 4.75e-01 | -0.0179 |
| 7782 | SLC30A4 | HTA11_7663_2000001011 | Human | Colorectum | SER | 2.40e-08 | 7.10e-01 | 0.0131 |
| 7782 | SLC30A4 | HTA11_10623_2000001011 | Human | Colorectum | AD | 2.96e-03 | 4.72e-01 | -0.0177 |
| 7782 | SLC30A4 | HTA11_6818_2000001011 | Human | Colorectum | AD | 9.72e-04 | 5.10e-01 | 0.0112 |
| 7782 | SLC30A4 | HTA11_7469_2000001011 | Human | Colorectum | AD | 2.91e-07 | 9.59e-01 | -0.0124 |
| 7782 | SLC30A4 | HTA11_99999971662_82457 | Human | Colorectum | MSS | 2.03e-09 | -1.78e-01 | 0.3859 |
| 7782 | SLC30A4 | HTA11_99999974143_84620 | Human | Colorectum | MSS | 6.81e-07 | -1.75e-01 | 0.3005 |
| 7782 | SLC30A4 | A015-C-203 | Human | Colorectum | FAP | 1.70e-06 | -1.64e-01 | -0.1294 |
| 7782 | SLC30A4 | A015-C-204 | Human | Colorectum | FAP | 9.13e-04 | -1.93e-01 | -0.0228 |
| 7782 | SLC30A4 | A002-C-203 | Human | Colorectum | FAP | 3.22e-03 | -1.43e-01 | 0.2786 |
| 7782 | SLC30A4 | A001-C-108 | Human | Colorectum | FAP | 1.78e-05 | -1.60e-01 | -0.0272 |
| 7782 | SLC30A4 | A002-C-205 | Human | Colorectum | FAP | 1.38e-02 | -1.50e-01 | -0.1236 |
| 7782 | SLC30A4 | A015-C-106 | Human | Colorectum | FAP | 8.24e-04 | -1.51e-01 | -0.0511 |
| Page: 1 2 |
| Tissue | Expression Dynamics | Abbreviation |
| Colorectum (GSE201348) |  | FAP: Familial adenomatous polyposis |
| CRC: Colorectal cancer | ||
| Colorectum (HTA11) |  | AD: Adenomas |
| SER: Sessile serrated lesions | ||
| MSI-H: Microsatellite-high colorectal cancer | ||
| MSS: Microsatellite stable colorectal cancer | ||
| Prostate | 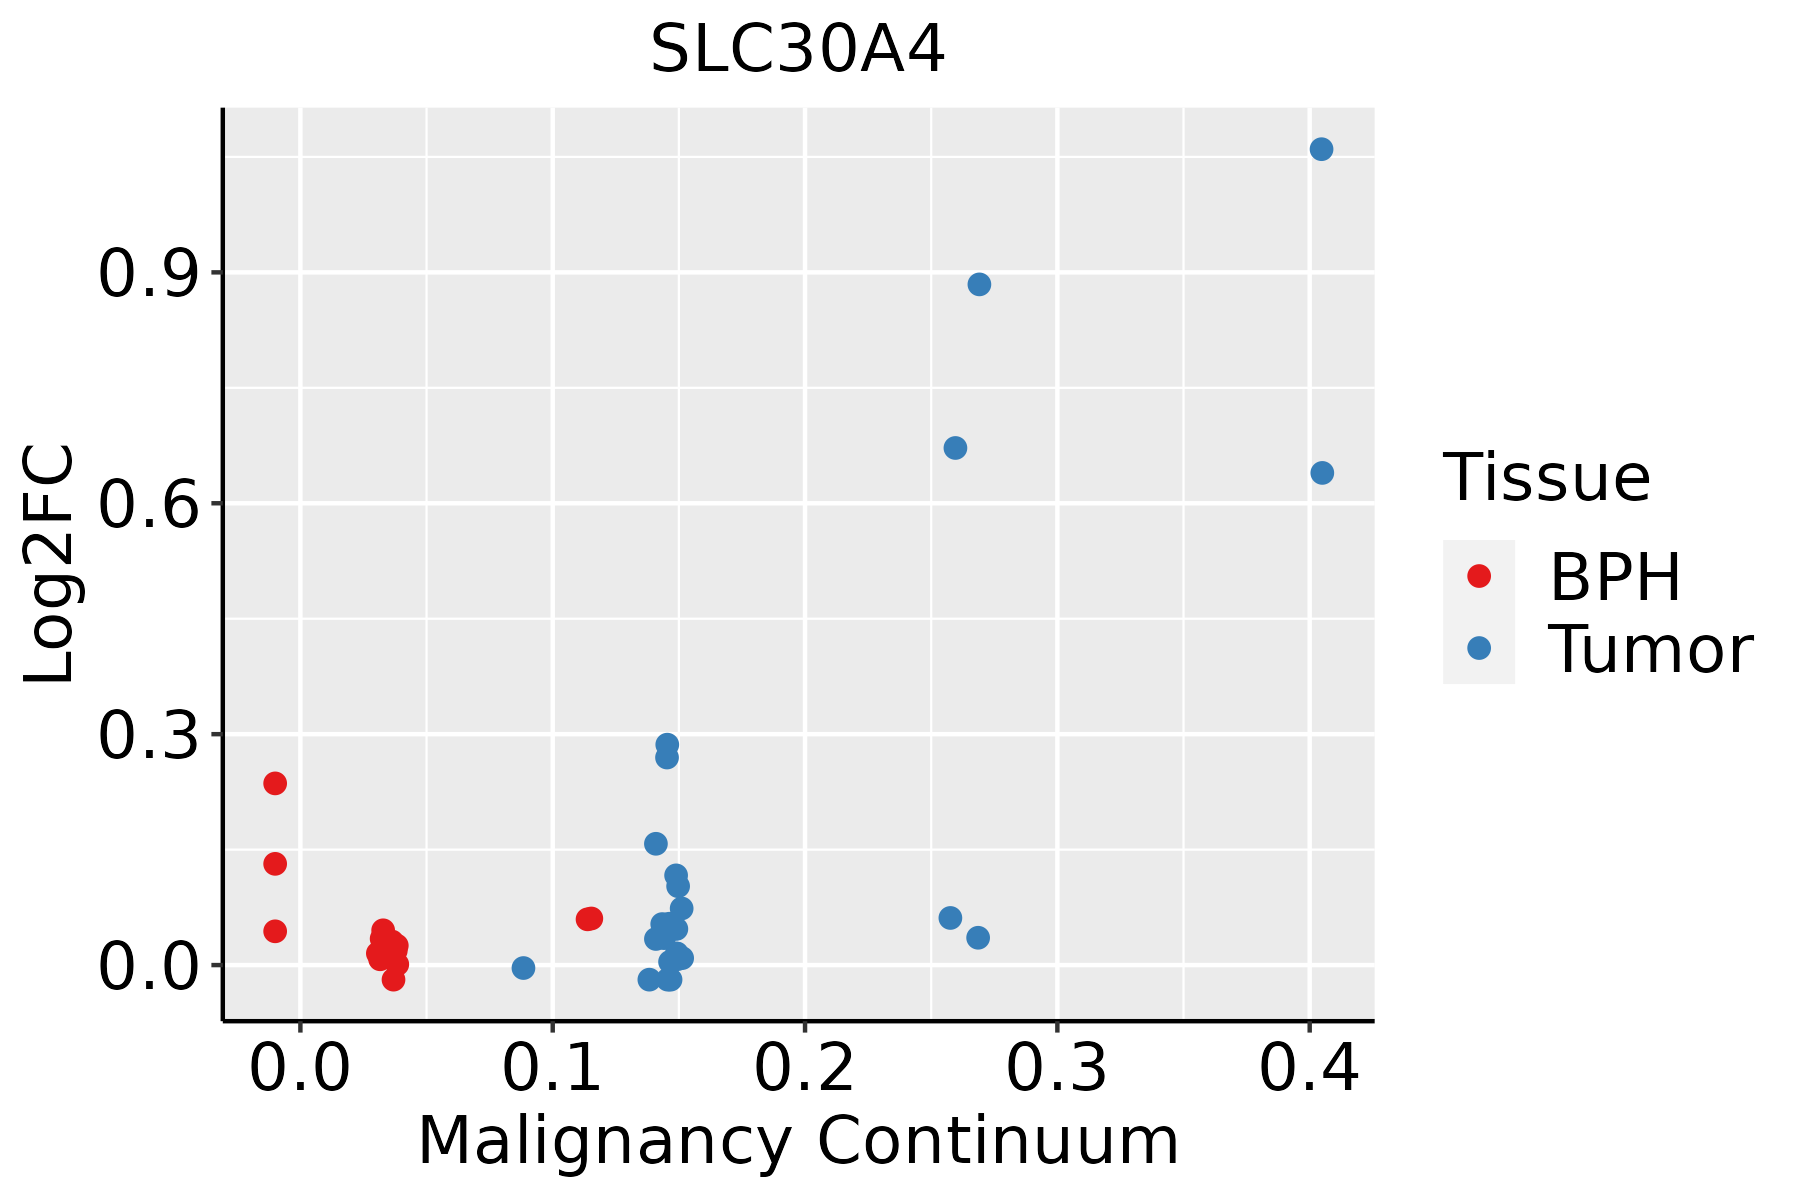 | BPH: Benign Prostatic Hyperplasia |
| ∗log2FC in expression of this searched gene in stem-like cells from each diseased tissue sample relative to stem-like cells in normal samples in each tissue plotted against the malignancy continuum. Samples are colored based on if they are from different disease stage. |
Top |
Malignant transformation related pathway analysis |
| Find out the enriched GO biological processes and KEGG pathways involved in transition from healthy to precancer to cancer |
| Tissue | Disease Stage | Enriched GO biological Processes |
| Colorectum | AD |  |
| Colorectum | SER |  |
| Colorectum | MSS |  |
| Colorectum | MSI-H |  |
| Colorectum | FAP |  |
| ∗Top 15 enriched GO BP terms are showed in the bar plot of each disease state in each tissue. Each row represents a significant GO biological process which is colored according to the -log10(p.adjust). |
| Page: 1 2 3 4 5 6 7 8 9 |
| GO ID | Tissue | Disease Stage | Description | Gene Ratio | Bg Ratio | pvalue | p.adjust | Count |
| GO:0009636 | Colorectum | AD | response to toxic substance | 88/3918 | 262/18723 | 1.12e-06 | 3.72e-05 | 88 |
| GO:0055076 | Colorectum | AD | transition metal ion homeostasis | 53/3918 | 138/18723 | 1.89e-06 | 5.65e-05 | 53 |
| GO:0046916 | Colorectum | AD | cellular transition metal ion homeostasis | 43/3918 | 115/18723 | 3.62e-05 | 6.56e-04 | 43 |
| GO:0010038 | Colorectum | AD | response to metal ion | 106/3918 | 373/18723 | 3.22e-04 | 3.83e-03 | 106 |
| GO:0055069 | Colorectum | AD | zinc ion homeostasis | 18/3918 | 40/18723 | 5.36e-04 | 5.74e-03 | 18 |
| GO:0006882 | Colorectum | AD | cellular zinc ion homeostasis | 17/3918 | 38/18723 | 8.26e-04 | 8.13e-03 | 17 |
| GO:0051651 | Colorectum | AD | maintenance of location in cell | 61/3918 | 214/18723 | 5.02e-03 | 3.37e-02 | 61 |
| GO:00096361 | Colorectum | SER | response to toxic substance | 71/2897 | 262/18723 | 8.63e-07 | 4.07e-05 | 71 |
| GO:00550761 | Colorectum | SER | transition metal ion homeostasis | 41/2897 | 138/18723 | 1.66e-05 | 5.05e-04 | 41 |
| GO:00100381 | Colorectum | SER | response to metal ion | 84/2897 | 373/18723 | 1.87e-04 | 3.44e-03 | 84 |
| GO:00469161 | Colorectum | SER | cellular transition metal ion homeostasis | 33/2897 | 115/18723 | 2.20e-04 | 3.89e-03 | 33 |
| GO:00550691 | Colorectum | SER | zinc ion homeostasis | 15/2897 | 40/18723 | 5.71e-04 | 7.86e-03 | 15 |
| GO:00068821 | Colorectum | SER | cellular zinc ion homeostasis | 14/2897 | 38/18723 | 1.06e-03 | 1.23e-02 | 14 |
| GO:00516511 | Colorectum | SER | maintenance of location in cell | 47/2897 | 214/18723 | 7.20e-03 | 4.99e-02 | 47 |
| GO:00550762 | Colorectum | MSS | transition metal ion homeostasis | 45/3467 | 138/18723 | 4.99e-05 | 9.02e-04 | 45 |
| GO:00096362 | Colorectum | MSS | response to toxic substance | 73/3467 | 262/18723 | 1.26e-04 | 1.94e-03 | 73 |
| GO:00469162 | Colorectum | MSS | cellular transition metal ion homeostasis | 35/3467 | 115/18723 | 1.33e-03 | 1.26e-02 | 35 |
| GO:00516512 | Colorectum | MSS | maintenance of location in cell | 57/3467 | 214/18723 | 2.07e-03 | 1.76e-02 | 57 |
| GO:00100382 | Colorectum | MSS | response to metal ion | 90/3467 | 373/18723 | 3.76e-03 | 2.76e-02 | 90 |
| GO:00550764 | Colorectum | FAP | transition metal ion homeostasis | 33/2622 | 138/18723 | 1.22e-03 | 1.14e-02 | 33 |
| Page: 1 2 |
| Pathway ID | Tissue | Disease Stage | Description | Gene Ratio | Bg Ratio | pvalue | p.adjust | qvalue | Count |
| Page: 1 |
Top |
Cell-cell communication analysis |
| Identification of potential cell-cell interactions between two cell types and their ligand-receptor pairs for different disease states |
| Ligand | Receptor | LRpair | Pathway | Tissue | Disease Stage |
| Page: 1 |
Top |
Single-cell gene regulatory network inference analysis |
| Find out the significant the regulons (TFs) and the target genes of each regulon across cell types for different disease states |
| TF | Cell Type | Tissue | Disease Stage | Target Gene | RSS | Regulon Activity |
| ∗The dot plots of a searched regulon are shown for all cell subpopulations in each disease state of each tissue based on the regulon specific score inferred using pySCENIC and by calculating the average expression. |
| Page: 1 |
Top |
Somatic mutation of malignant transformation related genes |
| Annotation of somatic variants for genes involved in malignant transformation |
| Hugo Symbol | Variant Class | Variant Classification | dbSNP RS | HGVSc | HGVSp | HGVSp Short | SWISSPROT | BIOTYPE | SIFT | PolyPhen | Tumor Sample Barcode | Tissue | Histology | Sex | Age | Stage | Therapy Types | Drugs | Outcome |
| SLC30A4 | SNV | Missense_Mutation | c.1044N>C | p.Leu348Phe | p.L348F | O14863 | protein_coding | tolerated(0.09) | probably_damaging(0.999) | TCGA-A8-A09G-01 | Breast | breast invasive carcinoma | Female | >=65 | III/IV | Unknown | Unknown | SD | |
| SLC30A4 | SNV | Missense_Mutation | novel | c.614G>C | p.Arg205Thr | p.R205T | O14863 | protein_coding | deleterious(0) | probably_damaging(0.998) | TCGA-PE-A5DE-01 | Breast | breast invasive carcinoma | Female | <65 | I/II | Chemotherapy | taxotere | CR |
| SLC30A4 | insertion | Frame_Shift_Ins | novel | c.798_799insACACACACACA | p.Asp267ThrfsTer9 | p.D267Tfs*9 | O14863 | protein_coding | TCGA-A2-A0EO-01 | Breast | breast invasive carcinoma | Female | <65 | I/II | Hormone Therapy | tamoxiphen | SD | ||
| SLC30A4 | insertion | Frame_Shift_Ins | novel | c.797_798insCACACACACACACACACTTCTTTCCAGCTCT | p.Gln266HisfsTer13 | p.Q266Hfs*13 | O14863 | protein_coding | TCGA-A2-A0EO-01 | Breast | breast invasive carcinoma | Female | <65 | I/II | Hormone Therapy | tamoxiphen | SD | ||
| SLC30A4 | insertion | Frame_Shift_Ins | novel | c.25_26insTTACCTTTGACCAACAGTCAGCTGAGTTTGAAGGT | p.Arg9LeufsTer18 | p.R9Lfs*18 | O14863 | protein_coding | TCGA-A7-A0CJ-01 | Breast | breast invasive carcinoma | Female | <65 | I/II | Chemotherapy | cytoxan | SD | ||
| SLC30A4 | insertion | Frame_Shift_Ins | novel | c.25_26insCTGAAATGAACCAGAGG | p.Arg9ProfsTer12 | p.R9Pfs*12 | O14863 | protein_coding | TCGA-A8-A07R-01 | Breast | breast invasive carcinoma | Female | >=65 | III/IV | Ancillary | zoledronic | SD | ||
| SLC30A4 | insertion | Frame_Shift_Ins | novel | c.23_24insCATGAAATTTTTGCCTCGTAAGAAGG | p.Lys8AsnfsTer16 | p.K8Nfs*16 | O14863 | protein_coding | TCGA-A8-A07R-01 | Breast | breast invasive carcinoma | Female | >=65 | III/IV | Ancillary | zoledronic | SD | ||
| SLC30A4 | insertion | Frame_Shift_Ins | novel | c.4_5insACGTTATCTTCATTGT | p.Ala2AspfsTer22 | p.A2Dfs*22 | O14863 | protein_coding | TCGA-BH-A0DS-01 | Breast | breast invasive carcinoma | Female | >=65 | III/IV | Chemotherapy | cyclophosphamide | SD | ||
| SLC30A4 | SNV | Missense_Mutation | novel | c.431N>T | p.Ala144Val | p.A144V | O14863 | protein_coding | deleterious(0) | possibly_damaging(0.57) | TCGA-2W-A8YY-01 | Cervix | cervical & endocervical cancer | Female | <65 | I/II | Chemotherapy | cisplatin | CR |
| SLC30A4 | SNV | Missense_Mutation | c.238G>A | p.Asp80Asn | p.D80N | O14863 | protein_coding | tolerated(0.07) | benign(0.101) | TCGA-D5-6928-01 | Colorectum | colon adenocarcinoma | Male | >=65 | I/II | Unknown | Unknown | SD |
| Page: 1 2 3 4 |
Top |
Related drugs of malignant transformation related genes |
| Identification of chemicals and drugs interact with genes involved in malignant transfromation |
| (DGIdb 4.0) |
| Entrez ID | Symbol | Category | Interaction Types | Drug Claim Name | Drug Name | PMIDs |
| Page: 1 |

Copyright 2023-Present -The University of Texas Health Science Center at Houston |