
|
|||||
|
 | |
| |
| |
| |
| |
| |
|
Gene: SLC30A10 |
Gene summary for SLC30A10 |
| Gene information | Species | Human | Gene symbol | SLC30A10 | Gene ID | 55532 |
| Gene name | solute carrier family 30 member 10 | |
| Gene Alias | HMDPC | |
| Cytomap | 1q41 | |
| Gene Type | protein-coding | GO ID | GO:0000041 | UniProtAcc | B3KR19 |
Top |
Malignant transformation analysis |
| Identification of the aberrant gene expression in precancerous and cancerous lesions by comparing the gene expression of stem-like cells in diseased tissues with normal stem cells |
| Entrez ID | Symbol | Replicates | Species | Organ | Tissue | Adj P-value | Log2FC | Malignancy |
| 55532 | SLC30A10 | HTA11_347_2000001011 | Human | Colorectum | AD | 1.25e-03 | 1.31e-01 | -0.1954 |
| 55532 | SLC30A10 | HTA11_3361_2000001011 | Human | Colorectum | AD | 6.98e-04 | 1.46e-01 | -0.1207 |
| 55532 | SLC30A10 | A015-C-203 | Human | Colorectum | FAP | 4.75e-24 | 8.59e-01 | -0.1294 |
| 55532 | SLC30A10 | A015-C-204 | Human | Colorectum | FAP | 7.14e-04 | 4.70e-01 | -0.0228 |
| 55532 | SLC30A10 | A002-C-201 | Human | Colorectum | FAP | 5.13e-07 | 5.34e-01 | 0.0324 |
| 55532 | SLC30A10 | A002-C-116 | Human | Colorectum | FAP | 5.18e-17 | 7.29e-01 | -0.0452 |
| 55532 | SLC30A10 | CRC-3-11773 | Human | Colorectum | CRC | 5.93e-23 | 7.68e-01 | 0.2564 |
| 55532 | SLC30A10 | NAFLD1 | Human | Liver | NAFLD | 2.10e-09 | 9.01e-01 | -0.04 |
| 55532 | SLC30A10 | S43 | Human | Liver | Cirrhotic | 2.11e-03 | -3.06e-02 | -0.0187 |
| 55532 | SLC30A10 | HCC1_Meng | Human | Liver | HCC | 8.41e-30 | -1.20e-01 | 0.0246 |
| 55532 | SLC30A10 | HCC2_Meng | Human | Liver | HCC | 4.93e-06 | -1.87e-01 | 0.0107 |
| 55532 | SLC30A10 | HCC1 | Human | Liver | HCC | 2.91e-13 | 3.41e+00 | 0.5336 |
| 55532 | SLC30A10 | HCC2 | Human | Liver | HCC | 4.46e-15 | 3.26e+00 | 0.5341 |
| 55532 | SLC30A10 | Pt13.b | Human | Liver | HCC | 1.79e-03 | -2.05e-02 | 0.0251 |
| 55532 | SLC30A10 | S028 | Human | Liver | HCC | 1.78e-02 | 3.15e-01 | 0.2503 |
| 55532 | SLC30A10 | Pat01-B | Human | Stomach | GC | 5.42e-39 | 7.03e-01 | 0.5754 |
| 55532 | SLC30A10 | Pat02-B | Human | Stomach | GC | 3.52e-02 | 1.00e-01 | 0.0368 |
| 55532 | SLC30A10 | Pat03-B | Human | Stomach | GC | 1.59e-23 | 5.48e-01 | 0.3693 |
| 55532 | SLC30A10 | Pat17-B | Human | Stomach | GC | 8.40e-04 | 1.86e-01 | 0.3109 |
| Page: 1 |
| Tissue | Expression Dynamics | Abbreviation |
| Colorectum (GSE201348) | 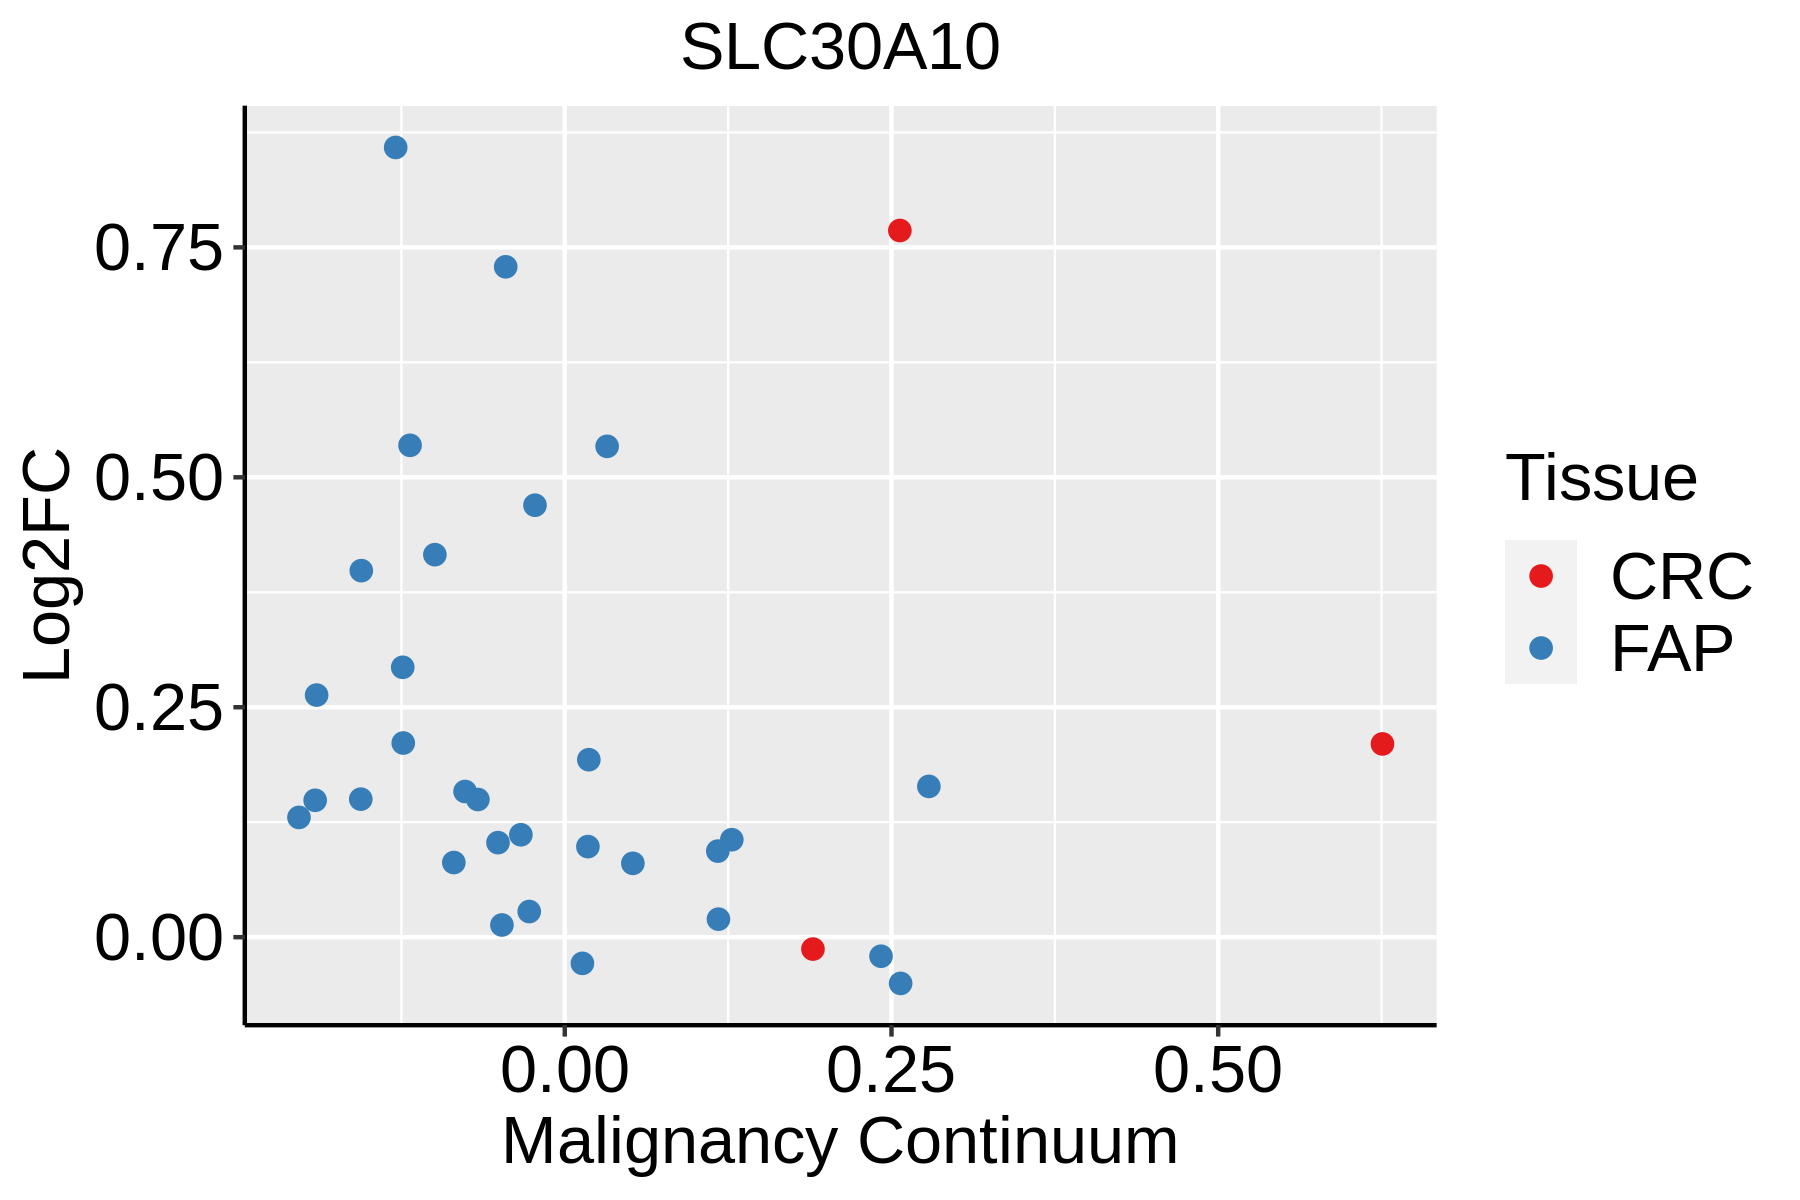 | FAP: Familial adenomatous polyposis |
| CRC: Colorectal cancer | ||
| Colorectum (HTA11) |  | AD: Adenomas |
| SER: Sessile serrated lesions | ||
| MSI-H: Microsatellite-high colorectal cancer | ||
| MSS: Microsatellite stable colorectal cancer | ||
| GC |  | CAG: Chronic atrophic gastritis |
| CAG with IM: Chronic atrophic gastritis with intestinal metaplasia | ||
| CSG: Chronic superficial gastritis | ||
| GC: Gastric cancer | ||
| SIM: Severe intestinal metaplasia | ||
| WIM: Wild intestinal metaplasia | ||
| Liver | 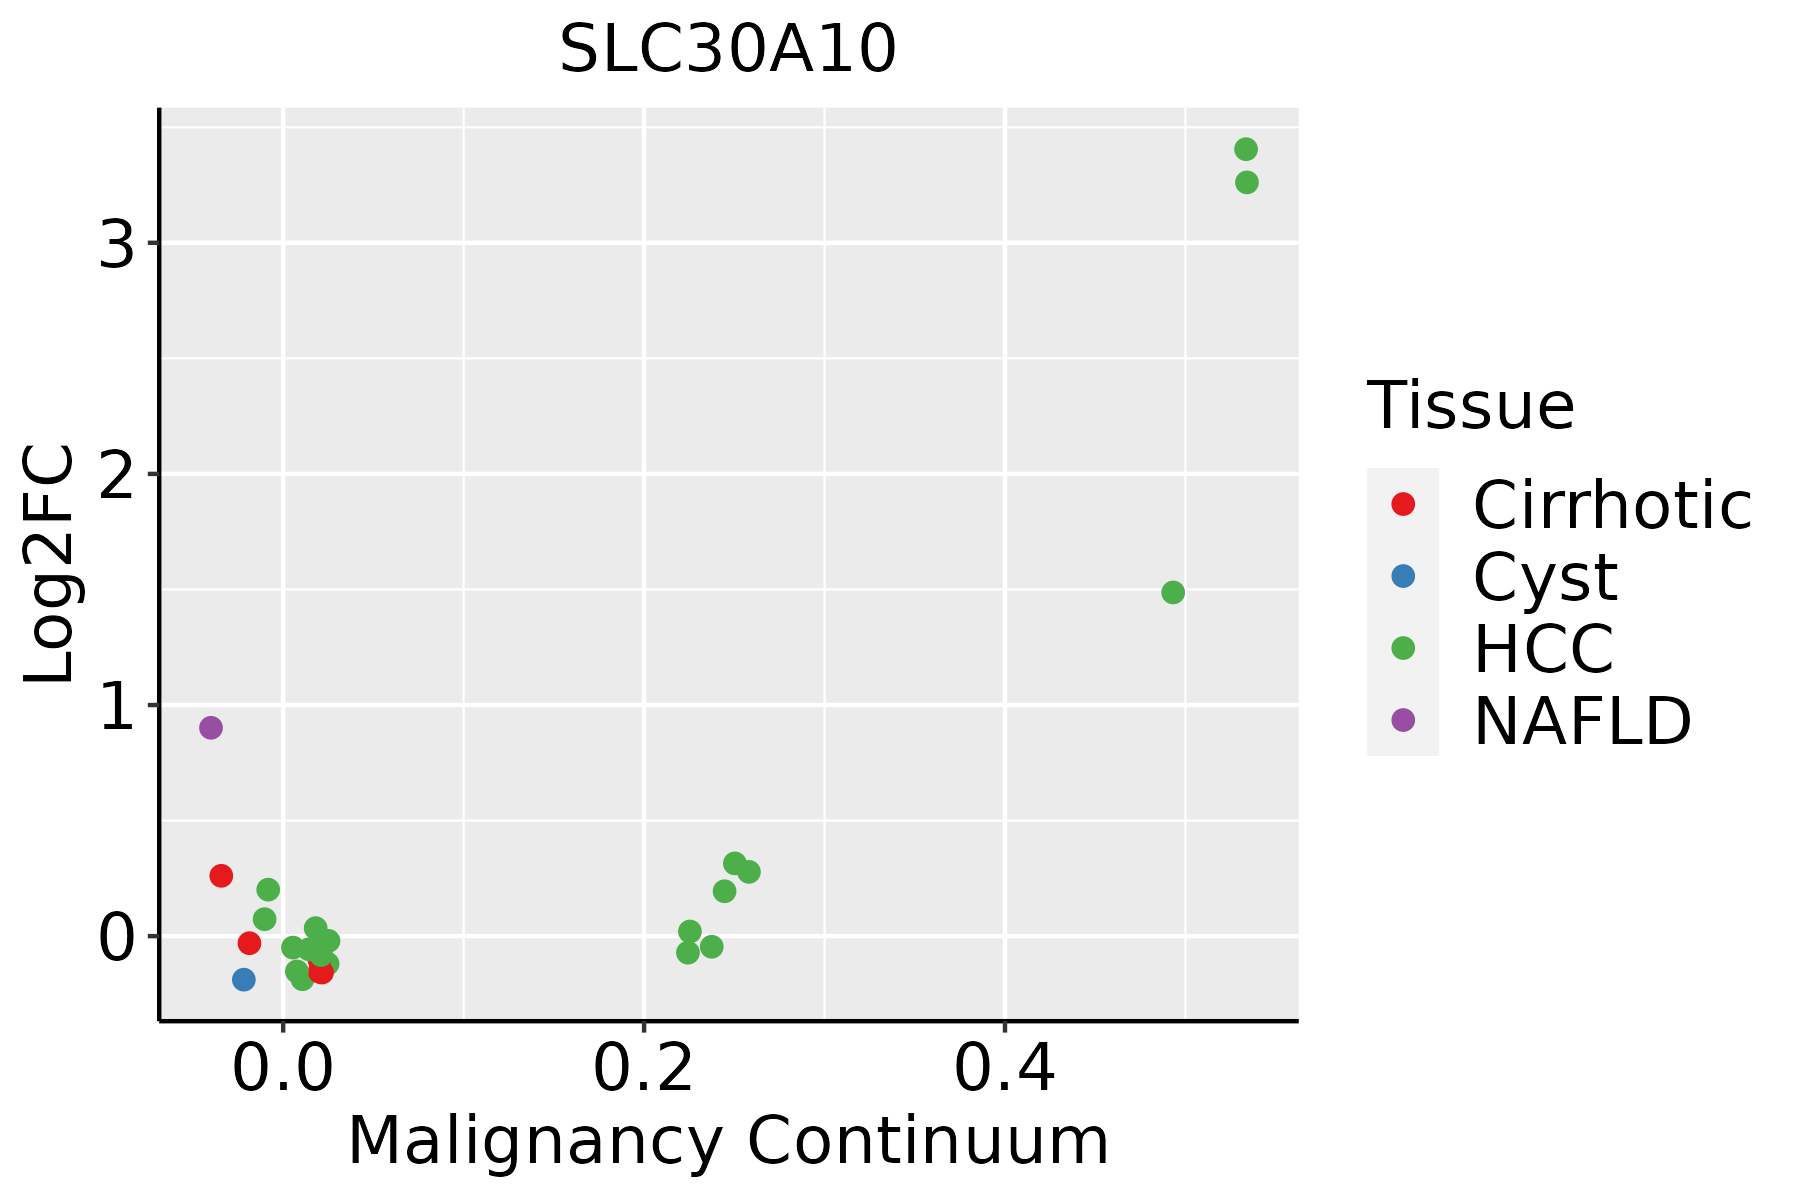 | HCC: Hepatocellular carcinoma |
| NAFLD: Non-alcoholic fatty liver disease |
| ∗log2FC in expression of this searched gene in stem-like cells from each diseased tissue sample relative to stem-like cells in normal samples in each tissue plotted against the malignancy continuum. Samples are colored based on if they are from different disease stage. |
Top |
Malignant transformation related pathway analysis |
| Find out the enriched GO biological processes and KEGG pathways involved in transition from healthy to precancer to cancer |
| Tissue | Disease Stage | Enriched GO biological Processes |
| Colorectum | AD |  |
| Colorectum | SER |  |
| Colorectum | MSS |  |
| Colorectum | MSI-H |  |
| Colorectum | FAP |  |
| ∗Top 15 enriched GO BP terms are showed in the bar plot of each disease state in each tissue. Each row represents a significant GO biological process which is colored according to the -log10(p.adjust). |
| Page: 1 2 3 4 5 6 7 8 9 |
| GO ID | Tissue | Disease Stage | Description | Gene Ratio | Bg Ratio | pvalue | p.adjust | Count |
| GO:0038127 | Colorectum | AD | ERBB signaling pathway | 55/3918 | 121/18723 | 1.19e-09 | 8.85e-08 | 55 |
| GO:0007173 | Colorectum | AD | epidermal growth factor receptor signaling pathway | 50/3918 | 108/18723 | 3.08e-09 | 2.07e-07 | 50 |
| GO:1901653 | Colorectum | AD | cellular response to peptide | 114/3918 | 359/18723 | 8.32e-07 | 2.88e-05 | 114 |
| GO:0009636 | Colorectum | AD | response to toxic substance | 88/3918 | 262/18723 | 1.12e-06 | 3.72e-05 | 88 |
| GO:0070997 | Colorectum | AD | neuron death | 114/3918 | 361/18723 | 1.13e-06 | 3.72e-05 | 114 |
| GO:0071375 | Colorectum | AD | cellular response to peptide hormone stimulus | 95/3918 | 290/18723 | 1.50e-06 | 4.66e-05 | 95 |
| GO:0055076 | Colorectum | AD | transition metal ion homeostasis | 53/3918 | 138/18723 | 1.89e-06 | 5.65e-05 | 53 |
| GO:0043434 | Colorectum | AD | response to peptide hormone | 126/3918 | 414/18723 | 2.70e-06 | 7.86e-05 | 126 |
| GO:1901214 | Colorectum | AD | regulation of neuron death | 99/3918 | 319/18723 | 1.26e-05 | 2.76e-04 | 99 |
| GO:0046916 | Colorectum | AD | cellular transition metal ion homeostasis | 43/3918 | 115/18723 | 3.62e-05 | 6.56e-04 | 43 |
| GO:0098754 | Colorectum | AD | detoxification | 53/3918 | 152/18723 | 4.63e-05 | 7.98e-04 | 53 |
| GO:0051402 | Colorectum | AD | neuron apoptotic process | 77/3918 | 246/18723 | 8.07e-05 | 1.28e-03 | 77 |
| GO:1901215 | Colorectum | AD | negative regulation of neuron death | 67/3918 | 208/18723 | 8.81e-05 | 1.35e-03 | 67 |
| GO:0007568 | Colorectum | AD | aging | 98/3918 | 339/18723 | 2.77e-04 | 3.39e-03 | 98 |
| GO:0072593 | Colorectum | AD | reactive oxygen species metabolic process | 73/3918 | 239/18723 | 2.79e-04 | 3.42e-03 | 73 |
| GO:0010038 | Colorectum | AD | response to metal ion | 106/3918 | 373/18723 | 3.22e-04 | 3.83e-03 | 106 |
| GO:0055069 | Colorectum | AD | zinc ion homeostasis | 18/3918 | 40/18723 | 5.36e-04 | 5.74e-03 | 18 |
| GO:0071248 | Colorectum | AD | cellular response to metal ion | 61/3918 | 197/18723 | 5.74e-04 | 6.09e-03 | 61 |
| GO:0071241 | Colorectum | AD | cellular response to inorganic substance | 68/3918 | 226/18723 | 6.98e-04 | 7.10e-03 | 68 |
| GO:0006882 | Colorectum | AD | cellular zinc ion homeostasis | 17/3918 | 38/18723 | 8.26e-04 | 8.13e-03 | 17 |
| Page: 1 2 3 4 5 6 7 8 |
| Pathway ID | Tissue | Disease Stage | Description | Gene Ratio | Bg Ratio | pvalue | p.adjust | qvalue | Count |
| Page: 1 |
Top |
Cell-cell communication analysis |
| Identification of potential cell-cell interactions between two cell types and their ligand-receptor pairs for different disease states |
| Ligand | Receptor | LRpair | Pathway | Tissue | Disease Stage |
| Page: 1 |
Top |
Single-cell gene regulatory network inference analysis |
| Find out the significant the regulons (TFs) and the target genes of each regulon across cell types for different disease states |
| TF | Cell Type | Tissue | Disease Stage | Target Gene | RSS | Regulon Activity |
| ∗The dot plots of a searched regulon are shown for all cell subpopulations in each disease state of each tissue based on the regulon specific score inferred using pySCENIC and by calculating the average expression. |
| Page: 1 |
Top |
Somatic mutation of malignant transformation related genes |
| Annotation of somatic variants for genes involved in malignant transformation |
| Hugo Symbol | Variant Class | Variant Classification | dbSNP RS | HGVSc | HGVSp | HGVSp Short | SWISSPROT | BIOTYPE | SIFT | PolyPhen | Tumor Sample Barcode | Tissue | Histology | Sex | Age | Stage | Therapy Types | Drugs | Outcome |
| SLC30A10 | SNV | Missense_Mutation | c.634N>A | p.Val212Ile | p.V212I | Q6XR72 | protein_coding | tolerated(0.22) | benign(0.039) | TCGA-A8-A09Z-01 | Breast | breast invasive carcinoma | Female | >=65 | I/II | Unknown | Unknown | SD | |
| SLC30A10 | SNV | Missense_Mutation | c.1324A>C | p.Ser442Arg | p.S442R | Q6XR72 | protein_coding | tolerated(0.09) | benign(0.12) | TCGA-AC-A23H-01 | Breast | breast invasive carcinoma | Female | >=65 | I/II | Unknown | Unknown | PD | |
| SLC30A10 | SNV | Missense_Mutation | c.1102N>C | p.Glu368Gln | p.E368Q | Q6XR72 | protein_coding | tolerated(0.1) | benign(0.081) | TCGA-AR-A1AK-01 | Breast | breast invasive carcinoma | Female | >=65 | I/II | Hormone Therapy | anastrozole | SD | |
| SLC30A10 | SNV | Missense_Mutation | rs745609179 | c.890N>T | p.Pro297Leu | p.P297L | Q6XR72 | protein_coding | deleterious(0.01) | probably_damaging(1) | TCGA-AR-A24O-01 | Breast | breast invasive carcinoma | Female | <65 | III/IV | Chemotherapy | cytoxan | PD |
| SLC30A10 | SNV | Missense_Mutation | c.1188N>T | p.Leu396Phe | p.L396F | Q6XR72 | protein_coding | tolerated(0.75) | benign(0) | TCGA-C8-A12Y-01 | Breast | breast invasive carcinoma | Female | <65 | I/II | Unknown | Unknown | SD | |
| SLC30A10 | SNV | Missense_Mutation | rs368970531 | c.1348N>A | p.Ala450Thr | p.A450T | Q6XR72 | protein_coding | tolerated(1) | benign(0) | TCGA-E9-A226-01 | Breast | breast invasive carcinoma | Female | <65 | III/IV | Hormone Therapy | tamoxiphen | PD |
| SLC30A10 | insertion | Frame_Shift_Ins | novel | c.1222_1223insCATATTTTGT | p.Gly408AlafsTer7 | p.G408Afs*7 | Q6XR72 | protein_coding | TCGA-AO-A0JJ-01 | Breast | breast invasive carcinoma | Female | <65 | I/II | Chemotherapy | cyclophospamide | SD | ||
| SLC30A10 | insertion | Nonsense_Mutation | novel | c.1220_1221insCTGACATAATTTTTAAAGTCTAC | p.Lys407AsnfsTer2 | p.K407Nfs*2 | Q6XR72 | protein_coding | TCGA-AO-A0JJ-01 | Breast | breast invasive carcinoma | Female | <65 | I/II | Chemotherapy | cyclophospamide | SD | ||
| SLC30A10 | SNV | Missense_Mutation | rs746346368 | c.1321G>A | p.Gly441Arg | p.G441R | Q6XR72 | protein_coding | tolerated(0.95) | benign(0) | TCGA-2W-A8YY-01 | Cervix | cervical & endocervical cancer | Female | <65 | I/II | Chemotherapy | cisplatin | CR |
| SLC30A10 | SNV | Missense_Mutation | c.1247N>T | p.Pro416Leu | p.P416L | Q6XR72 | protein_coding | deleterious(0) | possibly_damaging(0.738) | TCGA-AA-3693-01 | Colorectum | colon adenocarcinoma | Female | >=65 | III/IV | Unknown | Unknown | SD |
| Page: 1 2 3 4 5 6 |
Top |
Related drugs of malignant transformation related genes |
| Identification of chemicals and drugs interact with genes involved in malignant transfromation |
| (DGIdb 4.0) |
| Entrez ID | Symbol | Category | Interaction Types | Drug Claim Name | Drug Name | PMIDs |
| Page: 1 |

Copyright 2023-Present -The University of Texas Health Science Center at Houston |