
|
|||||
|
 | |
| |
| |
| |
| |
| |
|
Gene: SLC2A9 |
Gene summary for SLC2A9 |
| Gene information | Species | Human | Gene symbol | SLC2A9 | Gene ID | 56606 |
| Gene name | solute carrier family 2 member 9 | |
| Gene Alias | GLUT9 | |
| Cytomap | 4p16.1 | |
| Gene Type | protein-coding | GO ID | GO:0006082 | UniProtAcc | Q9NRM0 |
Top |
Malignant transformation analysis |
| Identification of the aberrant gene expression in precancerous and cancerous lesions by comparing the gene expression of stem-like cells in diseased tissues with normal stem cells |
| Entrez ID | Symbol | Replicates | Species | Organ | Tissue | Adj P-value | Log2FC | Malignancy |
| 56606 | SLC2A9 | P2T-E | Human | Esophagus | ESCC | 3.63e-19 | 4.46e-01 | 0.1177 |
| 56606 | SLC2A9 | P4T-E | Human | Esophagus | ESCC | 3.66e-06 | 1.90e-01 | 0.1323 |
| 56606 | SLC2A9 | P5T-E | Human | Esophagus | ESCC | 3.61e-03 | 7.82e-02 | 0.1327 |
| 56606 | SLC2A9 | P8T-E | Human | Esophagus | ESCC | 1.39e-07 | 2.12e-01 | 0.0889 |
| 56606 | SLC2A9 | P9T-E | Human | Esophagus | ESCC | 1.77e-03 | 7.62e-02 | 0.1131 |
| 56606 | SLC2A9 | P10T-E | Human | Esophagus | ESCC | 5.80e-12 | 1.90e-01 | 0.116 |
| 56606 | SLC2A9 | P11T-E | Human | Esophagus | ESCC | 6.96e-15 | 5.58e-01 | 0.1426 |
| 56606 | SLC2A9 | P12T-E | Human | Esophagus | ESCC | 1.40e-07 | 1.70e-01 | 0.1122 |
| 56606 | SLC2A9 | P15T-E | Human | Esophagus | ESCC | 3.68e-07 | 2.24e-01 | 0.1149 |
| 56606 | SLC2A9 | P16T-E | Human | Esophagus | ESCC | 2.79e-13 | 1.77e-01 | 0.1153 |
| 56606 | SLC2A9 | P20T-E | Human | Esophagus | ESCC | 3.76e-06 | 6.93e-02 | 0.1124 |
| 56606 | SLC2A9 | P21T-E | Human | Esophagus | ESCC | 7.51e-13 | 2.29e-01 | 0.1617 |
| 56606 | SLC2A9 | P22T-E | Human | Esophagus | ESCC | 1.26e-10 | 1.14e-01 | 0.1236 |
| 56606 | SLC2A9 | P23T-E | Human | Esophagus | ESCC | 8.56e-03 | 1.32e-01 | 0.108 |
| 56606 | SLC2A9 | P24T-E | Human | Esophagus | ESCC | 1.69e-05 | 6.38e-02 | 0.1287 |
| 56606 | SLC2A9 | P26T-E | Human | Esophagus | ESCC | 4.87e-06 | 8.08e-02 | 0.1276 |
| 56606 | SLC2A9 | P27T-E | Human | Esophagus | ESCC | 1.86e-11 | 2.24e-01 | 0.1055 |
| 56606 | SLC2A9 | P28T-E | Human | Esophagus | ESCC | 1.49e-10 | 1.17e-01 | 0.1149 |
| 56606 | SLC2A9 | P30T-E | Human | Esophagus | ESCC | 1.73e-15 | 4.77e-01 | 0.137 |
| 56606 | SLC2A9 | P36T-E | Human | Esophagus | ESCC | 4.17e-06 | 2.54e-01 | 0.1187 |
| Page: 1 2 3 |
| Tissue | Expression Dynamics | Abbreviation |
| Esophagus | 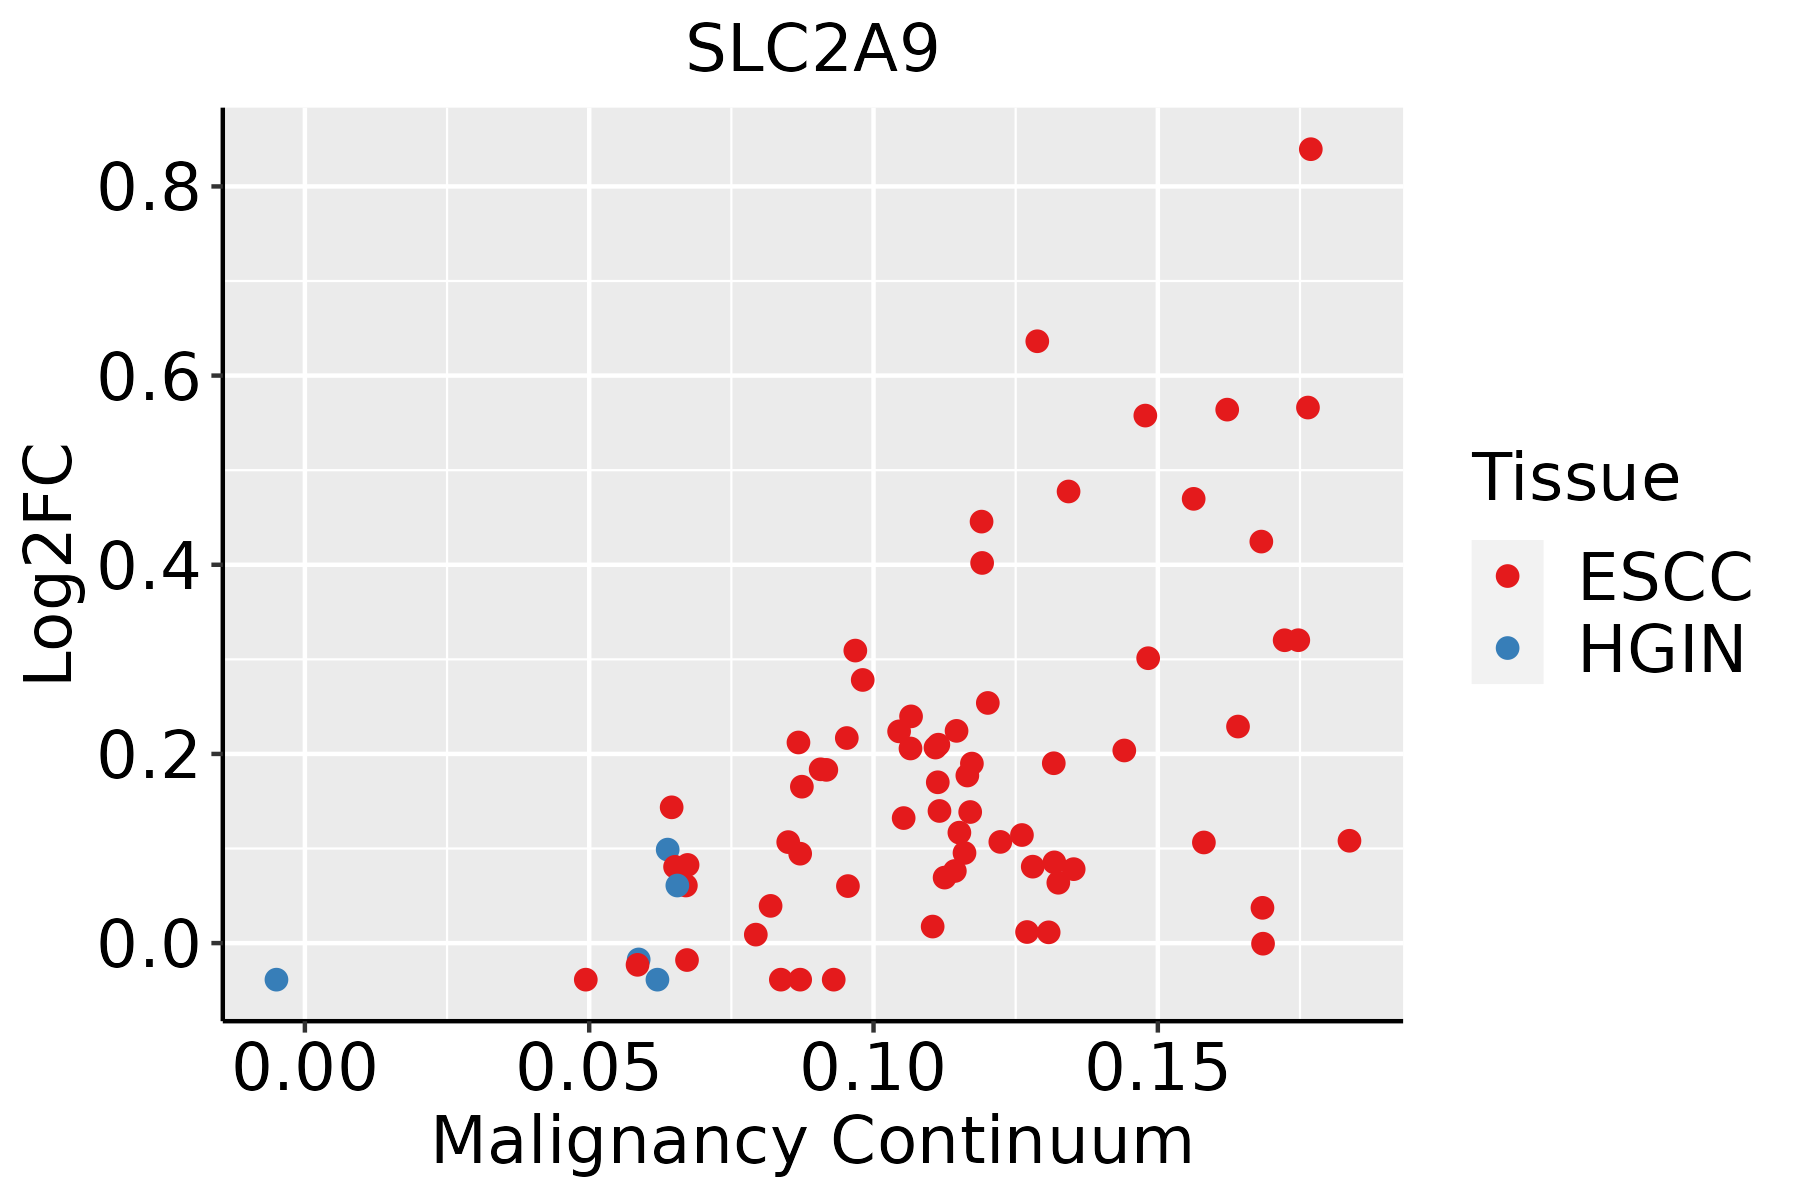 | ESCC: Esophageal squamous cell carcinoma |
| HGIN: High-grade intraepithelial neoplasias | ||
| LGIN: Low-grade intraepithelial neoplasias | ||
| Liver | 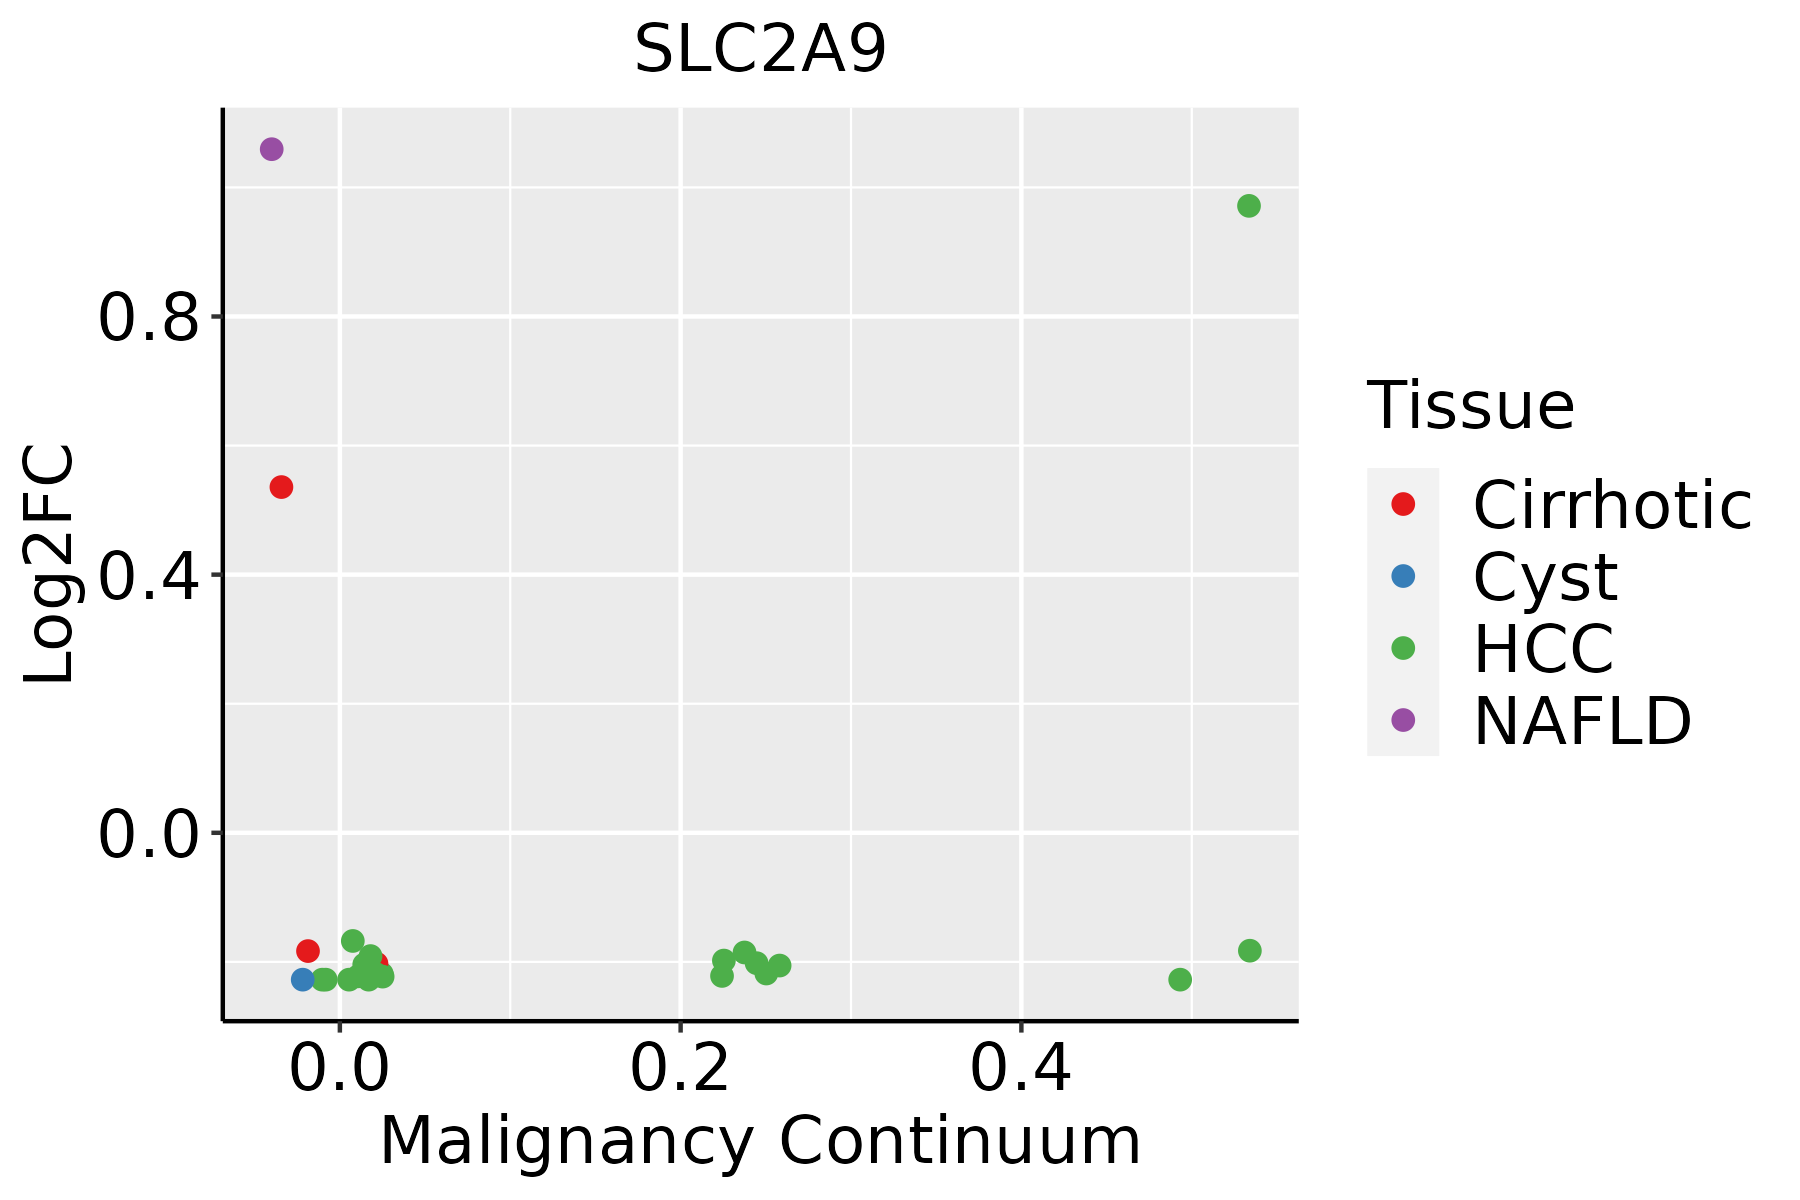 | HCC: Hepatocellular carcinoma |
| NAFLD: Non-alcoholic fatty liver disease | ||
| Oral Cavity | 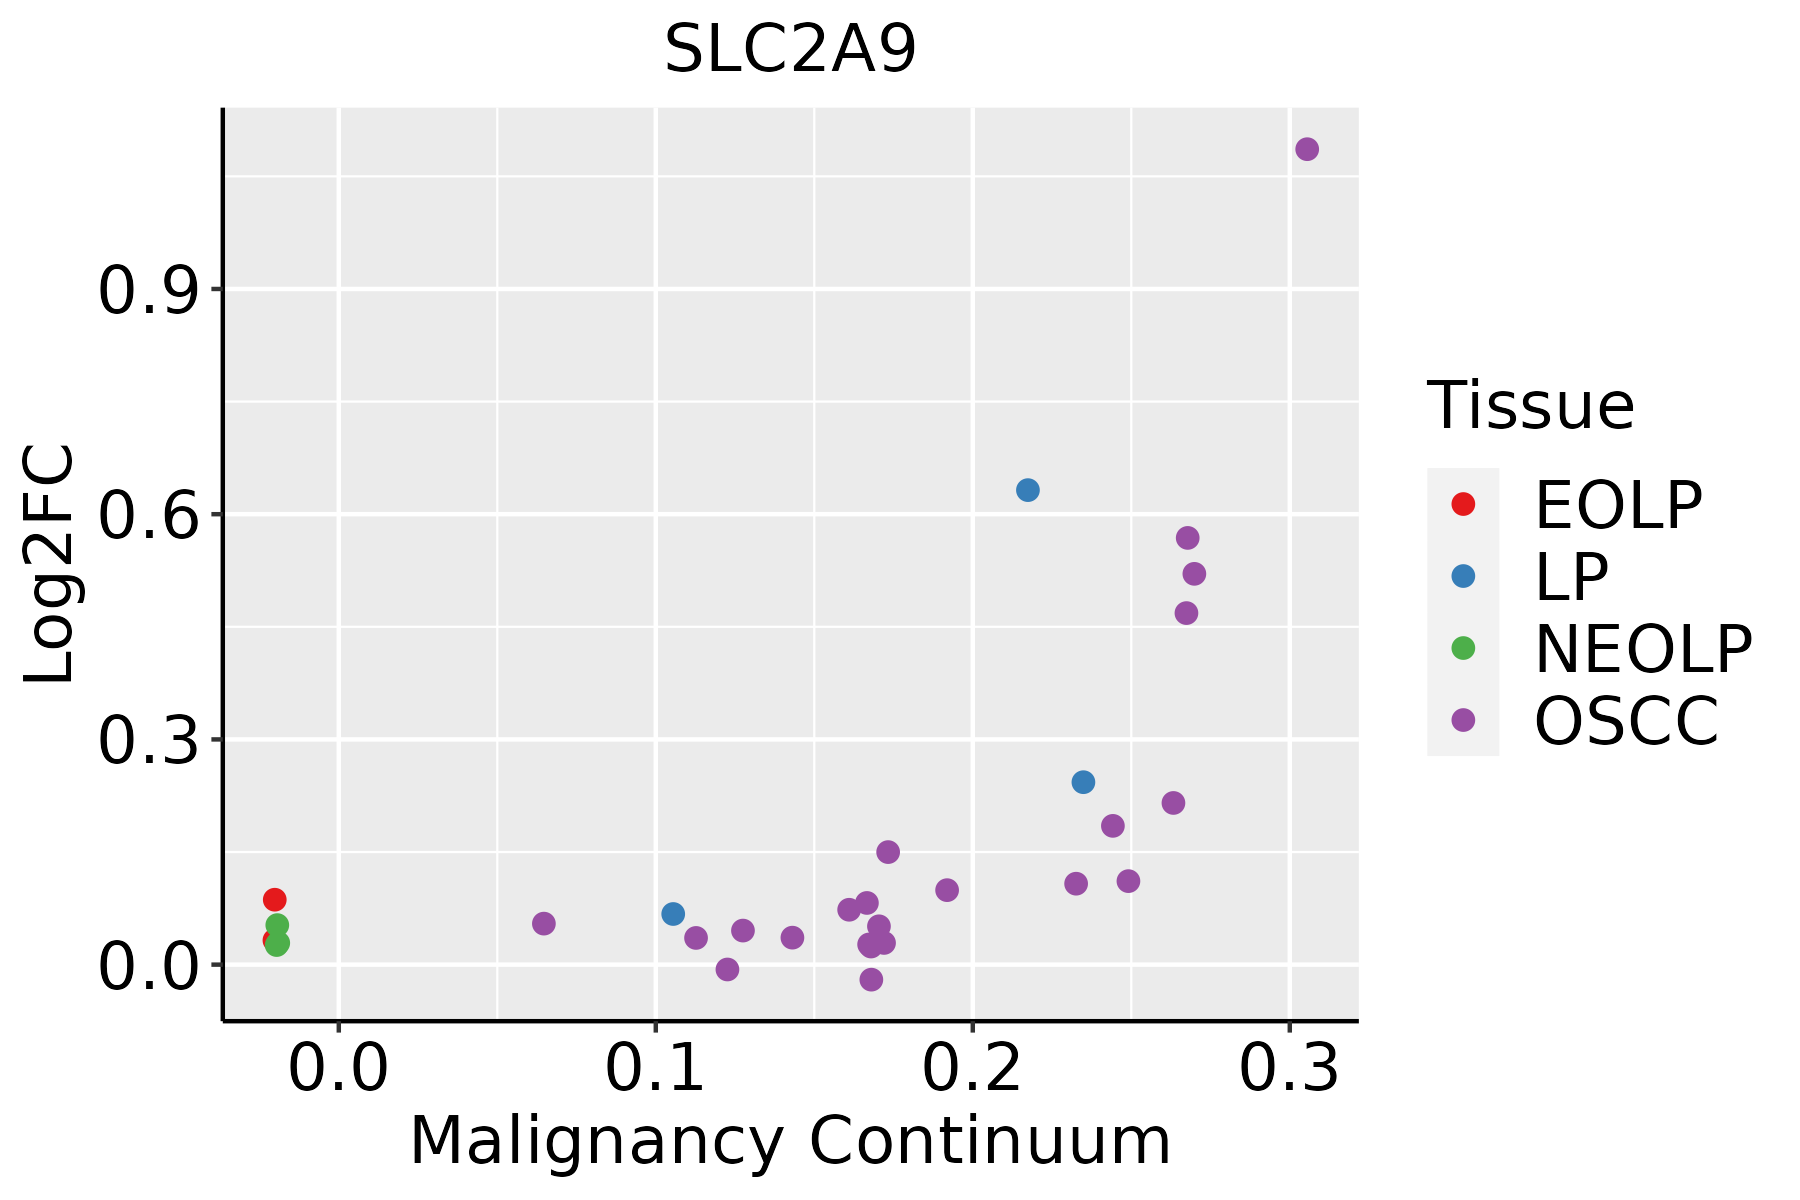 | EOLP: Erosive Oral lichen planus |
| LP: leukoplakia | ||
| NEOLP: Non-erosive oral lichen planus | ||
| OSCC: Oral squamous cell carcinoma |
| ∗log2FC in expression of this searched gene in stem-like cells from each diseased tissue sample relative to stem-like cells in normal samples in each tissue plotted against the malignancy continuum. Samples are colored based on if they are from different disease stage. |
Top |
Malignant transformation related pathway analysis |
| Find out the enriched GO biological processes and KEGG pathways involved in transition from healthy to precancer to cancer |
| Tissue | Disease Stage | Enriched GO biological Processes |
| Colorectum | AD |  |
| Colorectum | SER |  |
| Colorectum | MSS |  |
| Colorectum | MSI-H |  |
| Colorectum | FAP |  |
| ∗Top 15 enriched GO BP terms are showed in the bar plot of each disease state in each tissue. Each row represents a significant GO biological process which is colored according to the -log10(p.adjust). |
| Page: 1 2 3 4 5 6 7 8 9 |
| GO ID | Tissue | Disease Stage | Description | Gene Ratio | Bg Ratio | pvalue | p.adjust | Count |
| GO:190260018 | Esophagus | ESCC | proton transmembrane transport | 88/8552 | 157/18723 | 5.62e-03 | 2.10e-02 | 88 |
| GO:0015749 | Liver | NAFLD | monosaccharide transmembrane transport | 21/1882 | 116/18723 | 5.54e-03 | 4.23e-02 | 21 |
| GO:1904659 | Liver | NAFLD | glucose transmembrane transport | 20/1882 | 110/18723 | 6.36e-03 | 4.69e-02 | 20 |
| GO:0034219 | Liver | NAFLD | carbohydrate transmembrane transport | 21/1882 | 118/18723 | 6.77e-03 | 4.79e-02 | 21 |
| GO:19026007 | Liver | HCC | proton transmembrane transport | 87/7958 | 157/18723 | 7.27e-04 | 4.42e-03 | 87 |
| GO:0008643 | Liver | HCC | carbohydrate transport | 80/7958 | 152/18723 | 7.34e-03 | 2.92e-02 | 80 |
| Page: 1 |
| Pathway ID | Tissue | Disease Stage | Description | Gene Ratio | Bg Ratio | pvalue | p.adjust | qvalue | Count |
| Page: 1 |
Top |
Cell-cell communication analysis |
| Identification of potential cell-cell interactions between two cell types and their ligand-receptor pairs for different disease states |
| Ligand | Receptor | LRpair | Pathway | Tissue | Disease Stage |
| Page: 1 |
Top |
Single-cell gene regulatory network inference analysis |
| Find out the significant the regulons (TFs) and the target genes of each regulon across cell types for different disease states |
| TF | Cell Type | Tissue | Disease Stage | Target Gene | RSS | Regulon Activity |
| ∗The dot plots of a searched regulon are shown for all cell subpopulations in each disease state of each tissue based on the regulon specific score inferred using pySCENIC and by calculating the average expression. |
| Page: 1 |
Top |
Somatic mutation of malignant transformation related genes |
| Annotation of somatic variants for genes involved in malignant transformation |
| Hugo Symbol | Variant Class | Variant Classification | dbSNP RS | HGVSc | HGVSp | HGVSp Short | SWISSPROT | BIOTYPE | SIFT | PolyPhen | Tumor Sample Barcode | Tissue | Histology | Sex | Age | Stage | Therapy Types | Drugs | Outcome |
| SLC2A9 | SNV | Missense_Mutation | c.448N>A | p.Ser150Thr | p.S150T | Q9NRM0 | protein_coding | tolerated(0.25) | benign(0.006) | TCGA-AC-A23H-01 | Breast | breast invasive carcinoma | Female | >=65 | I/II | Unknown | Unknown | PD | |
| SLC2A9 | SNV | Missense_Mutation | rs372201423 | c.1343N>T | p.Pro448Leu | p.P448L | Q9NRM0 | protein_coding | deleterious(0) | probably_damaging(0.997) | TCGA-AO-A128-01 | Breast | breast invasive carcinoma | Female | <65 | I/II | Chemotherapy | doxorubicin | SD |
| SLC2A9 | SNV | Missense_Mutation | c.1537N>A | p.Ala513Thr | p.A513T | Q9NRM0 | protein_coding | tolerated(0.25) | possibly_damaging(0.506) | TCGA-BH-A0HA-01 | Breast | breast invasive carcinoma | Female | <65 | I/II | Unknown | Unknown | SD | |
| SLC2A9 | SNV | Missense_Mutation | c.946N>G | p.Gln316Glu | p.Q316E | Q9NRM0 | protein_coding | deleterious(0) | probably_damaging(0.999) | TCGA-E2-A1LA-01 | Breast | breast invasive carcinoma | Female | <65 | I/II | Hormone Therapy | arimidex | SD | |
| SLC2A9 | insertion | Frame_Shift_Ins | novel | c.766_767insTCACTTCTGTGCAGTGTCTCACTACCACCTCTCTAGTTGTT | p.Pro256LeufsTer29 | p.P256Lfs*29 | Q9NRM0 | protein_coding | TCGA-A2-A0D2-01 | Breast | breast invasive carcinoma | Female | <65 | I/II | Chemotherapy | adriamycin | SD | ||
| SLC2A9 | insertion | In_Frame_Ins | novel | c.104_105insTGTGGG | p.Glu35delinsAspValGly | p.E35delinsDVG | Q9NRM0 | protein_coding | TCGA-AO-A03R-01 | Breast | breast invasive carcinoma | Female | <65 | I/II | Chemotherapy | doxorubicin | SD | ||
| SLC2A9 | deletion | Frame_Shift_Del | c.1378_1391delNNNNNNNNNNNNNN | p.Leu460CysfsTer37 | p.L460Cfs*37 | Q9NRM0 | protein_coding | TCGA-BH-A1FM-01 | Breast | breast invasive carcinoma | Female | <65 | III/IV | Unknown | Unknown | SD | |||
| SLC2A9 | SNV | Missense_Mutation | novel | c.229G>A | p.Val77Met | p.V77M | Q9NRM0 | protein_coding | deleterious(0) | probably_damaging(1) | TCGA-MY-A913-01 | Cervix | cervical & endocervical cancer | Female | <65 | I/II | Chemotherapy | cisplatin | CR |
| SLC2A9 | SNV | Missense_Mutation | c.1575N>T | p.Glu525Asp | p.E525D | Q9NRM0 | protein_coding | tolerated(0.14) | benign(0.048) | TCGA-A6-3809-01 | Colorectum | colon adenocarcinoma | Female | >=65 | I/II | Unknown | Unknown | SD | |
| SLC2A9 | SNV | Missense_Mutation | novel | c.439T>C | p.Phe147Leu | p.F147L | Q9NRM0 | protein_coding | tolerated(0.34) | benign(0.169) | TCGA-A6-5665-01 | Colorectum | colon adenocarcinoma | Female | >=65 | I/II | Unknown | Unknown | PD |
| Page: 1 2 3 4 5 6 7 |
Top |
Related drugs of malignant transformation related genes |
| Identification of chemicals and drugs interact with genes involved in malignant transfromation |
| (DGIdb 4.0) |
| Entrez ID | Symbol | Category | Interaction Types | Drug Claim Name | Drug Name | PMIDs |
| Page: 1 |

Copyright 2023-Present -The University of Texas Health Science Center at Houston |