
|
|||||
|
 | |
| |
| |
| |
| |
| |
|
Gene: SLC2A5 |
Gene summary for SLC2A5 |
| Gene information | Species | Human | Gene symbol | SLC2A5 | Gene ID | 6518 |
| Gene name | solute carrier family 2 member 5 | |
| Gene Alias | GLUT-5 | |
| Cytomap | 1p36.23 | |
| Gene Type | protein-coding | GO ID | GO:0003008 | UniProtAcc | A0A140VJK5 |
Top |
Malignant transformation analysis |
| Identification of the aberrant gene expression in precancerous and cancerous lesions by comparing the gene expression of stem-like cells in diseased tissues with normal stem cells |
| Entrez ID | Symbol | Replicates | Species | Organ | Tissue | Adj P-value | Log2FC | Malignancy |
| 6518 | SLC2A5 | Pat01-B | Human | Stomach | GC | 7.33e-13 | 3.63e-01 | 0.5754 |
| 6518 | SLC2A5 | Pat03-B | Human | Stomach | GC | 8.21e-08 | 2.58e-01 | 0.3693 |
| Page: 1 |
| Tissue | Expression Dynamics | Abbreviation |
| GC | 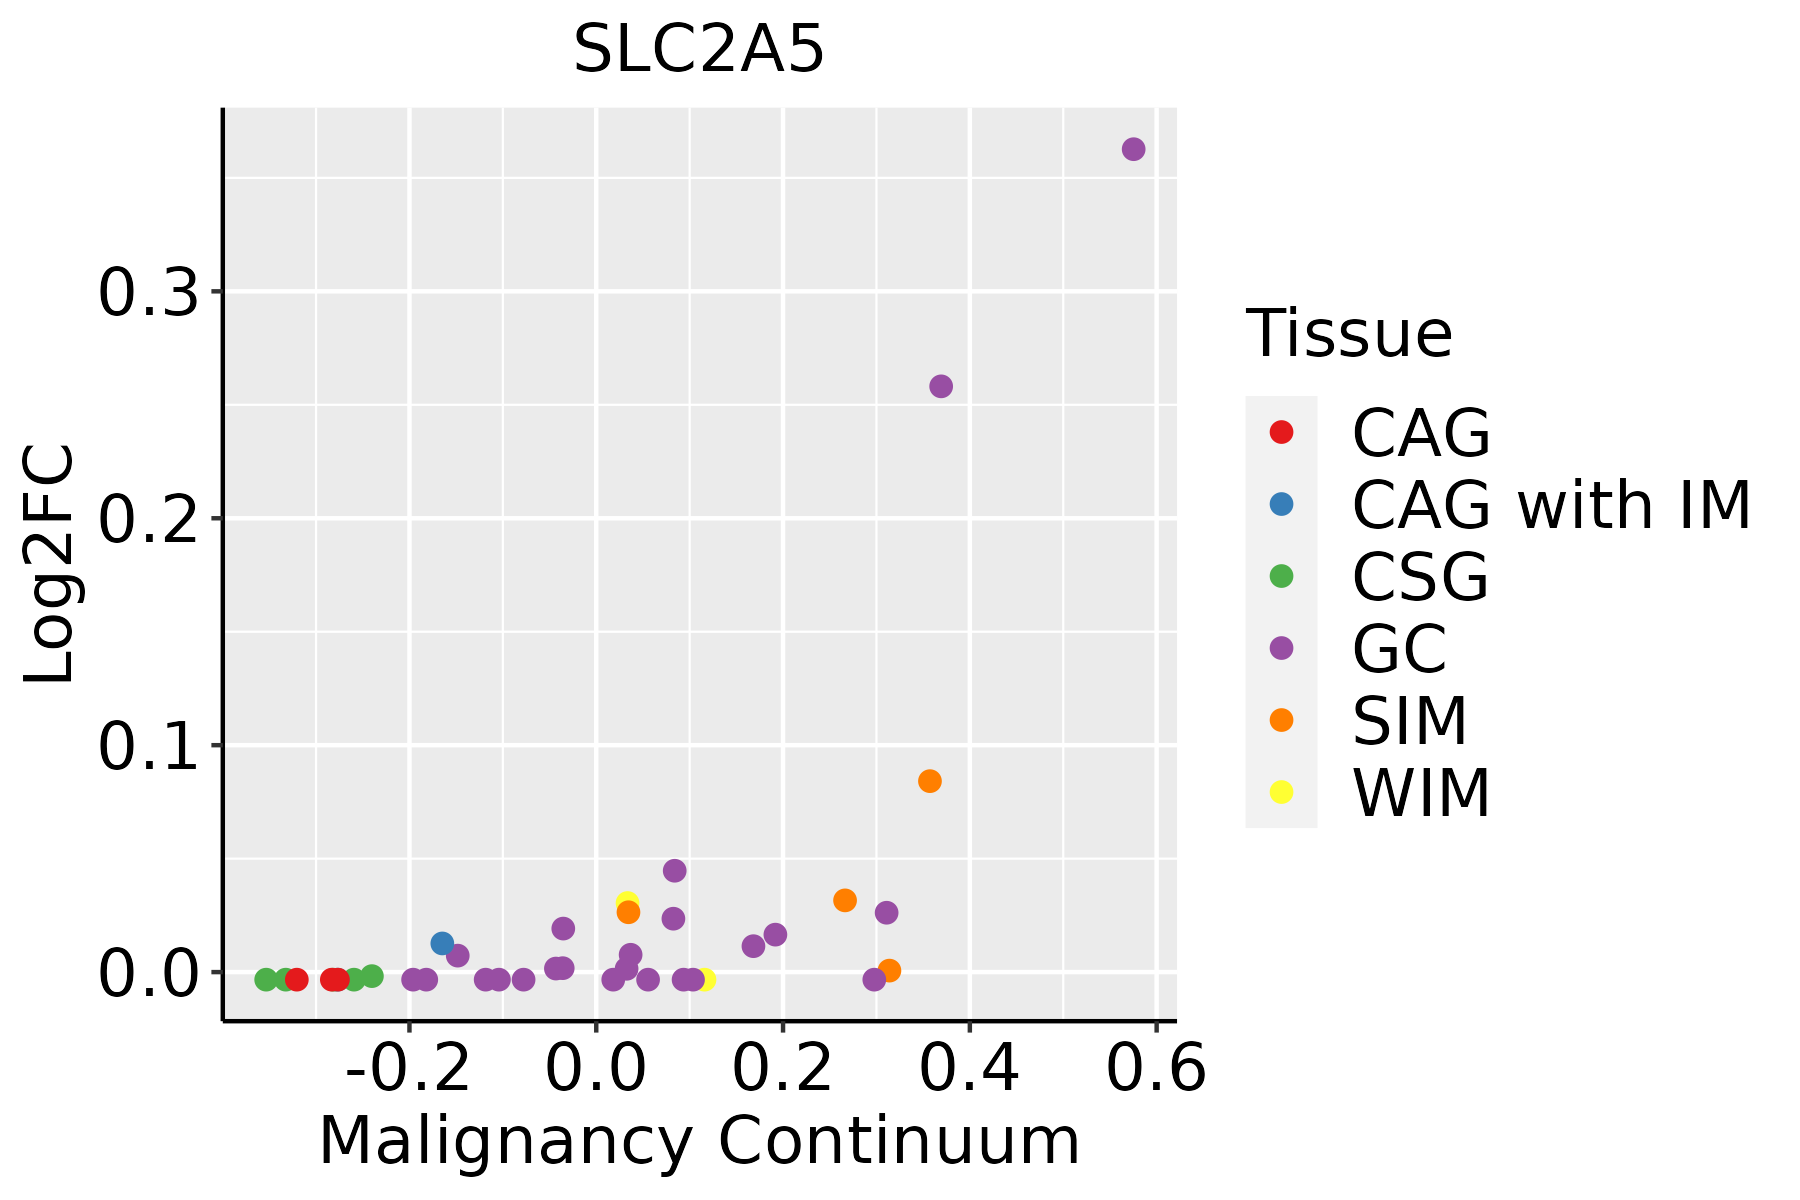 | CAG: Chronic atrophic gastritis |
| CAG with IM: Chronic atrophic gastritis with intestinal metaplasia | ||
| CSG: Chronic superficial gastritis | ||
| GC: Gastric cancer | ||
| SIM: Severe intestinal metaplasia | ||
| WIM: Wild intestinal metaplasia |
| ∗log2FC in expression of this searched gene in stem-like cells from each diseased tissue sample relative to stem-like cells in normal samples in each tissue plotted against the malignancy continuum. Samples are colored based on if they are from different disease stage. |
Top |
Malignant transformation related pathway analysis |
| Find out the enriched GO biological processes and KEGG pathways involved in transition from healthy to precancer to cancer |
| Tissue | Disease Stage | Enriched GO biological Processes |
| Colorectum | AD |  |
| Colorectum | SER |  |
| Colorectum | MSS |  |
| Colorectum | MSI-H |  |
| Colorectum | FAP |  |
| ∗Top 15 enriched GO BP terms are showed in the bar plot of each disease state in each tissue. Each row represents a significant GO biological process which is colored according to the -log10(p.adjust). |
| Page: 1 2 3 4 5 6 7 8 9 |
| GO ID | Tissue | Disease Stage | Description | Gene Ratio | Bg Ratio | pvalue | p.adjust | Count |
| GO:0007586 | Stomach | GC | digestion | 38/1159 | 137/18723 | 1.80e-15 | 1.22e-12 | 38 |
| GO:00226006 | Stomach | GC | digestive system process | 30/1159 | 104/18723 | 5.40e-13 | 2.10e-10 | 30 |
| GO:00508925 | Stomach | GC | intestinal absorption | 18/1159 | 41/18723 | 8.10e-12 | 2.20e-09 | 18 |
| GO:00097436 | Stomach | GC | response to carbohydrate | 40/1159 | 253/18723 | 4.13e-08 | 2.85e-06 | 40 |
| GO:00342846 | Stomach | GC | response to monosaccharide | 37/1159 | 225/18723 | 4.67e-08 | 3.17e-06 | 37 |
| GO:00097466 | Stomach | GC | response to hexose | 36/1159 | 219/18723 | 7.14e-08 | 4.62e-06 | 36 |
| GO:00713315 | Stomach | GC | cellular response to hexose stimulus | 25/1159 | 153/18723 | 7.68e-06 | 2.77e-04 | 25 |
| GO:00713265 | Stomach | GC | cellular response to monosaccharide stimulus | 25/1159 | 154/18723 | 8.64e-06 | 2.97e-04 | 25 |
| GO:00713225 | Stomach | GC | cellular response to carbohydrate stimulus | 25/1159 | 163/18723 | 2.36e-05 | 6.90e-04 | 25 |
| GO:0003044 | Stomach | GC | regulation of systemic arterial blood pressure mediated by a chemical signal | 11/1159 | 47/18723 | 1.08e-04 | 2.09e-03 | 11 |
| GO:0009750 | Stomach | GC | response to fructose | 5/1159 | 10/18723 | 1.75e-04 | 3.05e-03 | 5 |
| GO:0003073 | Stomach | GC | regulation of systemic arterial blood pressure | 14/1159 | 96/18723 | 2.29e-03 | 2.21e-02 | 14 |
| GO:0008217 | Stomach | GC | regulation of blood pressure | 22/1159 | 186/18723 | 2.66e-03 | 2.46e-02 | 22 |
| Page: 1 |
| Pathway ID | Tissue | Disease Stage | Description | Gene Ratio | Bg Ratio | pvalue | p.adjust | qvalue | Count |
| Page: 1 |
Top |
Cell-cell communication analysis |
| Identification of potential cell-cell interactions between two cell types and their ligand-receptor pairs for different disease states |
| Ligand | Receptor | LRpair | Pathway | Tissue | Disease Stage |
| Page: 1 |
Top |
Single-cell gene regulatory network inference analysis |
| Find out the significant the regulons (TFs) and the target genes of each regulon across cell types for different disease states |
| TF | Cell Type | Tissue | Disease Stage | Target Gene | RSS | Regulon Activity |
| ∗The dot plots of a searched regulon are shown for all cell subpopulations in each disease state of each tissue based on the regulon specific score inferred using pySCENIC and by calculating the average expression. |
| Page: 1 |
Top |
Somatic mutation of malignant transformation related genes |
| Annotation of somatic variants for genes involved in malignant transformation |
| Hugo Symbol | Variant Class | Variant Classification | dbSNP RS | HGVSc | HGVSp | HGVSp Short | SWISSPROT | BIOTYPE | SIFT | PolyPhen | Tumor Sample Barcode | Tissue | Histology | Sex | Age | Stage | Therapy Types | Drugs | Outcome |
| SLC2A5 | SNV | Missense_Mutation | novel | c.24G>A | p.Met8Ile | p.M8I | P22732 | protein_coding | tolerated(0.11) | benign(0) | TCGA-VS-A9V3-01 | Cervix | cervical & endocervical cancer | Female | <65 | I/II | Chemotherapy | cisplatin | PD |
| SLC2A5 | SNV | Missense_Mutation | c.511N>G | p.Thr171Ala | p.T171A | P22732 | protein_coding | deleterious(0.03) | possibly_damaging(0.592) | TCGA-AA-3663-01 | Colorectum | colon adenocarcinoma | Male | <65 | I/II | Unknown | Unknown | SD | |
| SLC2A5 | SNV | Missense_Mutation | rs368743770 | c.338C>T | p.Ala113Val | p.A113V | P22732 | protein_coding | deleterious(0.01) | probably_damaging(0.993) | TCGA-AA-A00N-01 | Colorectum | colon adenocarcinoma | Male | >=65 | I/II | Unknown | Unknown | PD |
| SLC2A5 | SNV | Missense_Mutation | c.156N>T | p.Glu52Asp | p.E52D | P22732 | protein_coding | tolerated(0.17) | benign(0.01) | TCGA-AA-A010-01 | Colorectum | colon adenocarcinoma | Female | <65 | I/II | Chemotherapy | folinic | CR | |
| SLC2A5 | SNV | Missense_Mutation | novel | c.1045T>C | p.Phe349Leu | p.F349L | P22732 | protein_coding | deleterious(0) | benign(0.359) | TCGA-AZ-4315-01 | Colorectum | colon adenocarcinoma | Male | <65 | I/II | Unknown | Unknown | SD |
| SLC2A5 | SNV | Missense_Mutation | rs761342863 | c.203N>T | p.Thr68Met | p.T68M | P22732 | protein_coding | deleterious(0.02) | probably_damaging(0.981) | TCGA-D5-6928-01 | Colorectum | colon adenocarcinoma | Male | >=65 | I/II | Unknown | Unknown | SD |
| SLC2A5 | SNV | Missense_Mutation | c.982N>G | p.Met328Val | p.M328V | P22732 | protein_coding | tolerated(0.26) | benign(0.315) | TCGA-NH-A5IV-01 | Colorectum | colon adenocarcinoma | Female | >=65 | I/II | Unknown | Unknown | SD | |
| SLC2A5 | SNV | Missense_Mutation | novel | c.1431G>T | p.Lys477Asn | p.K477N | P22732 | protein_coding | deleterious(0.02) | benign(0.287) | TCGA-AG-A002-01 | Colorectum | rectum adenocarcinoma | Male | <65 | I/II | Unknown | Unknown | SD |
| SLC2A5 | SNV | Missense_Mutation | novel | c.596N>T | p.Thr199Ile | p.T199I | P22732 | protein_coding | tolerated(0.72) | possibly_damaging(0.796) | TCGA-A5-A0G1-01 | Endometrium | uterine corpus endometrioid carcinoma | Female | >=65 | I/II | Unknown | Unknown | SD |
| SLC2A5 | SNV | Missense_Mutation | rs138910454 | c.548N>A | p.Arg183Gln | p.R183Q | P22732 | protein_coding | tolerated(0.75) | benign(0.121) | TCGA-A5-A2K7-01 | Endometrium | uterine corpus endometrioid carcinoma | Female | <65 | I/II | Chemotherapy | taxol | SD |
| Page: 1 2 3 4 5 6 |
Top |
Related drugs of malignant transformation related genes |
| Identification of chemicals and drugs interact with genes involved in malignant transfromation |
| (DGIdb 4.0) |
| Entrez ID | Symbol | Category | Interaction Types | Drug Claim Name | Drug Name | PMIDs |
| 6518 | SLC2A5 | TRANSPORTER, DRUGGABLE GENOME | STREPTOZOTOCIN | STREPTOZOCIN | 9756334 | |
| 6518 | SLC2A5 | TRANSPORTER, DRUGGABLE GENOME | GLUFOSFAMIDE | GLUFOSFAMIDE |
| Page: 1 |

Copyright 2023-Present -The University of Texas Health Science Center at Houston |