
|
|||||
|
 | |
| |
| |
| |
| |
| |
|
Gene: SLC2A4 |
Gene summary for SLC2A4 |
| Gene information | Species | Human | Gene symbol | SLC2A4 | Gene ID | 6517 |
| Gene name | solute carrier family 2 member 4 | |
| Gene Alias | GLUT4 | |
| Cytomap | 17p13.1 | |
| Gene Type | protein-coding | GO ID | GO:0001666 | UniProtAcc | P14672 |
Top |
Malignant transformation analysis |
| Identification of the aberrant gene expression in precancerous and cancerous lesions by comparing the gene expression of stem-like cells in diseased tissues with normal stem cells |
| Entrez ID | Symbol | Replicates | Species | Organ | Tissue | Adj P-value | Log2FC | Malignancy |
| 6517 | SLC2A4 | P4T-E | Human | Esophagus | ESCC | 1.40e-18 | 3.75e-01 | 0.1323 |
| 6517 | SLC2A4 | P12T-E | Human | Esophagus | ESCC | 1.59e-30 | 4.98e-01 | 0.1122 |
| 6517 | SLC2A4 | P17T-E | Human | Esophagus | ESCC | 7.83e-16 | 5.97e-01 | 0.1278 |
| 6517 | SLC2A4 | P36T-E | Human | Esophagus | ESCC | 3.56e-15 | 5.20e-01 | 0.1187 |
| 6517 | SLC2A4 | P38T-E | Human | Esophagus | ESCC | 2.30e-13 | 5.68e-01 | 0.127 |
| 6517 | SLC2A4 | P40T-E | Human | Esophagus | ESCC | 1.39e-13 | 4.66e-01 | 0.109 |
| 6517 | SLC2A4 | P56T-E | Human | Esophagus | ESCC | 2.09e-15 | 1.37e+00 | 0.1613 |
| 6517 | SLC2A4 | P80T-E | Human | Esophagus | ESCC | 1.07e-33 | 8.70e-01 | 0.155 |
| 6517 | SLC2A4 | P82T-E | Human | Esophagus | ESCC | 2.57e-13 | 5.78e-01 | 0.1072 |
| 6517 | SLC2A4 | P89T-E | Human | Esophagus | ESCC | 1.01e-21 | 9.07e-01 | 0.1752 |
| 6517 | SLC2A4 | P91T-E | Human | Esophagus | ESCC | 1.76e-22 | 1.50e+00 | 0.1828 |
| 6517 | SLC2A4 | P104T-E | Human | Esophagus | ESCC | 1.51e-11 | 4.37e-01 | 0.0931 |
| 6517 | SLC2A4 | P126T-E | Human | Esophagus | ESCC | 2.42e-10 | 5.85e-01 | 0.1125 |
| 6517 | SLC2A4 | P128T-E | Human | Esophagus | ESCC | 3.30e-12 | 3.82e-01 | 0.1241 |
| Page: 1 |
| Tissue | Expression Dynamics | Abbreviation |
| Esophagus | 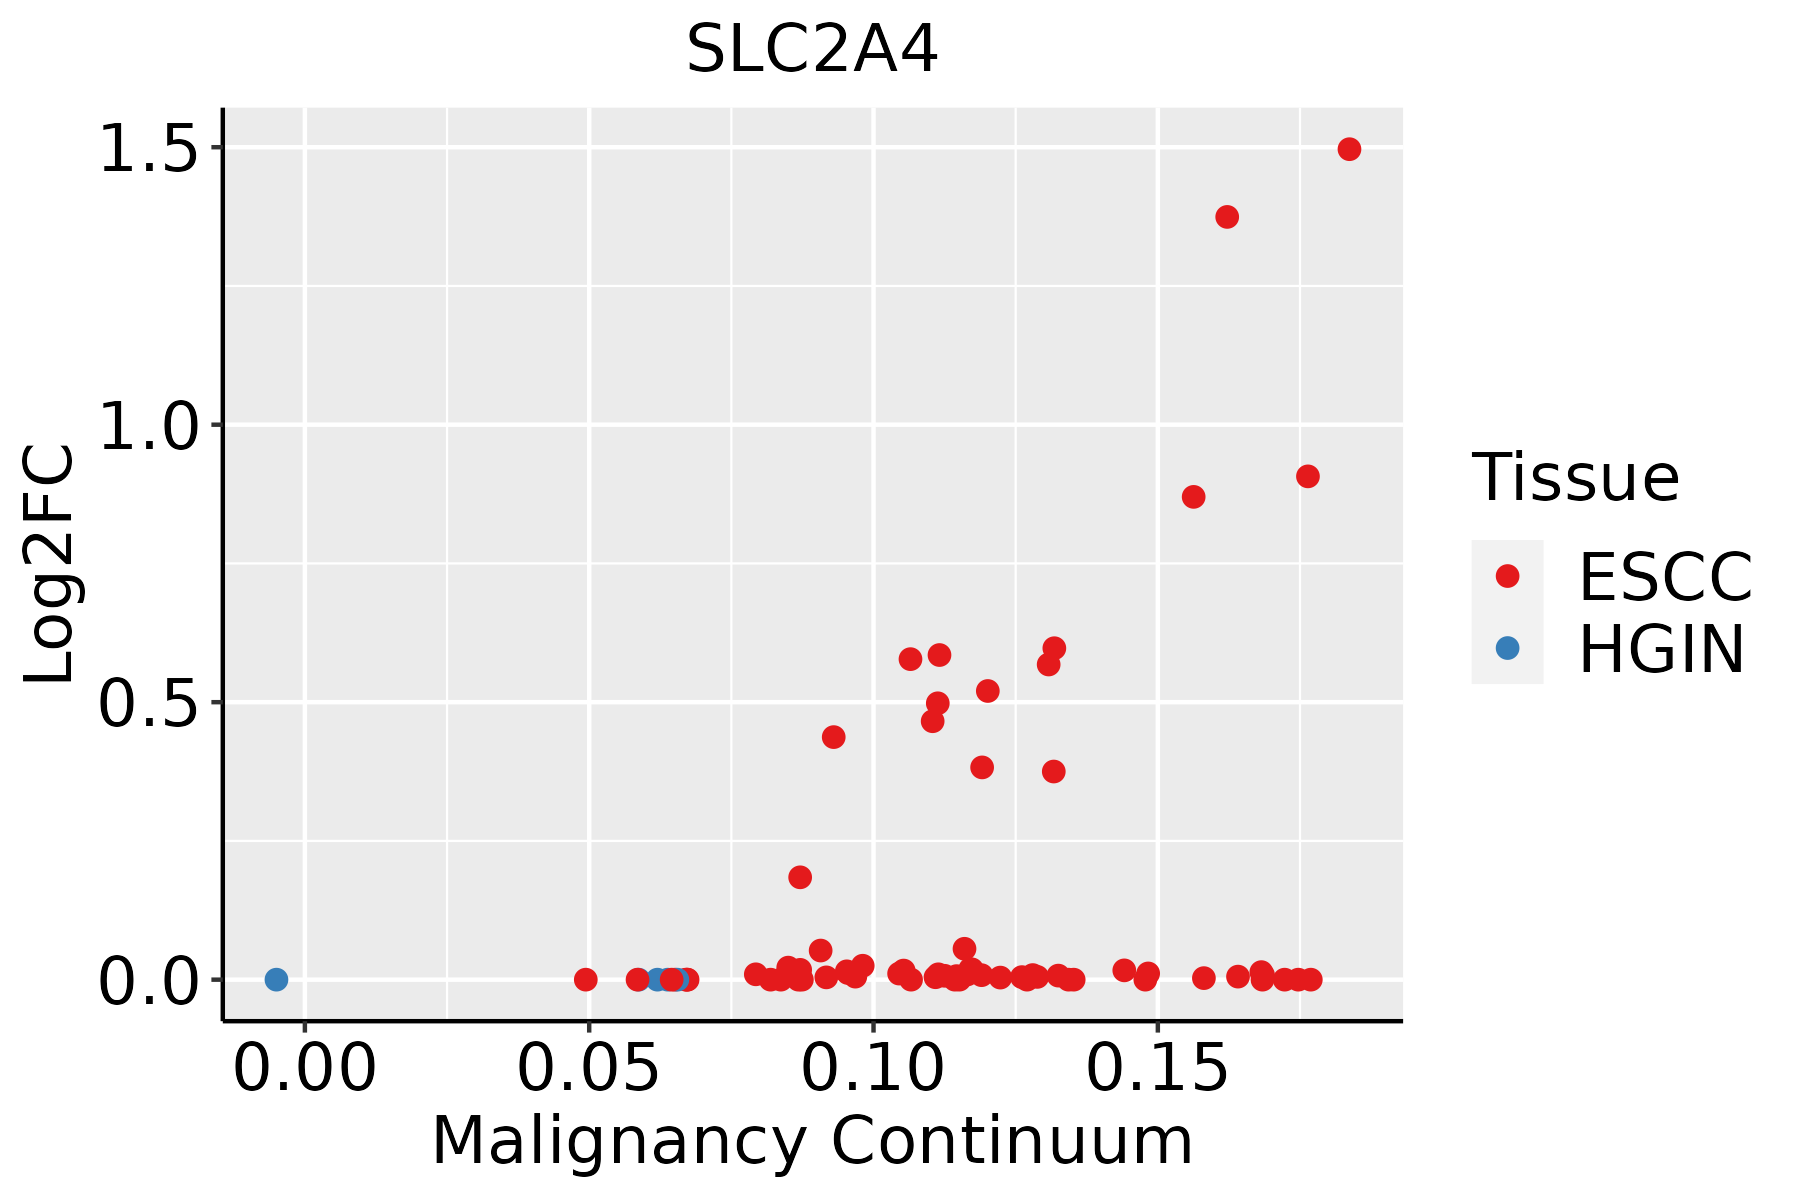 | ESCC: Esophageal squamous cell carcinoma |
| HGIN: High-grade intraepithelial neoplasias | ||
| LGIN: Low-grade intraepithelial neoplasias |
| ∗log2FC in expression of this searched gene in stem-like cells from each diseased tissue sample relative to stem-like cells in normal samples in each tissue plotted against the malignancy continuum. Samples are colored based on if they are from different disease stage. |
Top |
Malignant transformation related pathway analysis |
| Find out the enriched GO biological processes and KEGG pathways involved in transition from healthy to precancer to cancer |
| Tissue | Disease Stage | Enriched GO biological Processes |
| Colorectum | AD |  |
| Colorectum | SER |  |
| Colorectum | MSS |  |
| Colorectum | MSI-H |  |
| Colorectum | FAP |  |
| ∗Top 15 enriched GO BP terms are showed in the bar plot of each disease state in each tissue. Each row represents a significant GO biological process which is colored according to the -log10(p.adjust). |
| Page: 1 2 3 4 5 6 7 8 9 |
| GO ID | Tissue | Disease Stage | Description | Gene Ratio | Bg Ratio | pvalue | p.adjust | Count |
| GO:005165617 | Esophagus | ESCC | establishment of organelle localization | 273/8552 | 390/18723 | 9.13e-23 | 1.81e-20 | 273 |
| GO:0062197111 | Esophagus | ESCC | cellular response to chemical stress | 234/8552 | 337/18723 | 5.37e-19 | 5.97e-17 | 234 |
| GO:001605014 | Esophagus | ESCC | vesicle organization | 211/8552 | 300/18723 | 2.85e-18 | 2.87e-16 | 211 |
| GO:0006900111 | Esophagus | ESCC | vesicle budding from membrane | 54/8552 | 61/18723 | 2.66e-12 | 1.07e-10 | 54 |
| GO:0070482111 | Esophagus | ESCC | response to oxygen levels | 218/8552 | 347/18723 | 6.91e-11 | 2.17e-09 | 218 |
| GO:005165016 | Esophagus | ESCC | establishment of vesicle localization | 114/8552 | 161/18723 | 8.20e-11 | 2.53e-09 | 114 |
| GO:007121419 | Esophagus | ESCC | cellular response to abiotic stimulus | 206/8552 | 331/18723 | 7.52e-10 | 1.88e-08 | 206 |
| GO:010400419 | Esophagus | ESCC | cellular response to environmental stimulus | 206/8552 | 331/18723 | 7.52e-10 | 1.88e-08 | 206 |
| GO:0036293111 | Esophagus | ESCC | response to decreased oxygen levels | 201/8552 | 322/18723 | 8.37e-10 | 2.04e-08 | 201 |
| GO:0001666111 | Esophagus | ESCC | response to hypoxia | 192/8552 | 307/18723 | 1.59e-09 | 3.69e-08 | 192 |
| GO:005164815 | Esophagus | ESCC | vesicle localization | 119/8552 | 177/18723 | 5.16e-09 | 1.08e-07 | 119 |
| GO:0071453110 | Esophagus | ESCC | cellular response to oxygen levels | 114/8552 | 177/18723 | 3.63e-07 | 5.06e-06 | 114 |
| GO:0036294110 | Esophagus | ESCC | cellular response to decreased oxygen levels | 105/8552 | 161/18723 | 4.20e-07 | 5.73e-06 | 105 |
| GO:190165319 | Esophagus | ESCC | cellular response to peptide | 208/8552 | 359/18723 | 1.68e-06 | 2.01e-05 | 208 |
| GO:007145616 | Esophagus | ESCC | cellular response to hypoxia | 97/8552 | 151/18723 | 3.12e-06 | 3.51e-05 | 97 |
| GO:0043434111 | Esophagus | ESCC | response to peptide hormone | 234/8552 | 414/18723 | 4.93e-06 | 5.21e-05 | 234 |
| GO:003286918 | Esophagus | ESCC | cellular response to insulin stimulus | 124/8552 | 203/18723 | 6.63e-06 | 6.75e-05 | 124 |
| GO:003286818 | Esophagus | ESCC | response to insulin | 156/8552 | 264/18723 | 7.21e-06 | 7.20e-05 | 156 |
| GO:003461220 | Esophagus | ESCC | response to tumor necrosis factor | 149/8552 | 253/18723 | 1.47e-05 | 1.33e-04 | 149 |
| GO:00069707 | Esophagus | ESCC | response to osmotic stress | 57/8552 | 84/18723 | 3.26e-05 | 2.70e-04 | 57 |
| Page: 1 2 |
| Pathway ID | Tissue | Disease Stage | Description | Gene Ratio | Bg Ratio | pvalue | p.adjust | qvalue | Count |
| hsa05415211 | Esophagus | ESCC | Diabetic cardiomyopathy | 146/4205 | 203/8465 | 5.81e-11 | 7.78e-10 | 3.99e-10 | 146 |
| hsa040689 | Esophagus | ESCC | FoxO signaling pathway | 89/4205 | 131/8465 | 1.56e-05 | 7.98e-05 | 4.09e-05 | 89 |
| hsa0415210 | Esophagus | ESCC | AMPK signaling pathway | 80/4205 | 121/8465 | 1.73e-04 | 6.67e-04 | 3.42e-04 | 80 |
| hsa049318 | Esophagus | ESCC | Insulin resistance | 69/4205 | 108/8465 | 1.92e-03 | 5.54e-03 | 2.84e-03 | 69 |
| hsa0541538 | Esophagus | ESCC | Diabetic cardiomyopathy | 146/4205 | 203/8465 | 5.81e-11 | 7.78e-10 | 3.99e-10 | 146 |
| hsa0406814 | Esophagus | ESCC | FoxO signaling pathway | 89/4205 | 131/8465 | 1.56e-05 | 7.98e-05 | 4.09e-05 | 89 |
| hsa0415213 | Esophagus | ESCC | AMPK signaling pathway | 80/4205 | 121/8465 | 1.73e-04 | 6.67e-04 | 3.42e-04 | 80 |
| hsa0493113 | Esophagus | ESCC | Insulin resistance | 69/4205 | 108/8465 | 1.92e-03 | 5.54e-03 | 2.84e-03 | 69 |
| Page: 1 |
Top |
Cell-cell communication analysis |
| Identification of potential cell-cell interactions between two cell types and their ligand-receptor pairs for different disease states |
| Ligand | Receptor | LRpair | Pathway | Tissue | Disease Stage |
| Page: 1 |
Top |
Single-cell gene regulatory network inference analysis |
| Find out the significant the regulons (TFs) and the target genes of each regulon across cell types for different disease states |
| TF | Cell Type | Tissue | Disease Stage | Target Gene | RSS | Regulon Activity |
| ∗The dot plots of a searched regulon are shown for all cell subpopulations in each disease state of each tissue based on the regulon specific score inferred using pySCENIC and by calculating the average expression. |
| Page: 1 |
Top |
Somatic mutation of malignant transformation related genes |
| Annotation of somatic variants for genes involved in malignant transformation |
| Hugo Symbol | Variant Class | Variant Classification | dbSNP RS | HGVSc | HGVSp | HGVSp Short | SWISSPROT | BIOTYPE | SIFT | PolyPhen | Tumor Sample Barcode | Tissue | Histology | Sex | Age | Stage | Therapy Types | Drugs | Outcome |
| SLC2A4 | SNV | Missense_Mutation | novel | c.34N>C | p.Asp12His | p.D12H | P14672 | protein_coding | tolerated(0.09) | benign(0.001) | TCGA-A8-A095-01 | Breast | breast invasive carcinoma | Female | <65 | I/II | Chemotherapy | 5-fluorouracil | CR |
| SLC2A4 | insertion | Nonsense_Mutation | novel | c.47_48insAGAGGGGAGGGAAGAGGACAGTGGCTGATGATAATAA | p.Gln17GlufsTer9 | p.Q17Efs*9 | P14672 | protein_coding | TCGA-A8-A08H-01 | Breast | breast invasive carcinoma | Female | >=65 | I/II | Unknown | Unknown | SD | ||
| SLC2A4 | SNV | Missense_Mutation | rs769186928 | c.1049N>A | p.Arg350Gln | p.R350Q | P14672 | protein_coding | deleterious(0.01) | probably_damaging(0.977) | TCGA-2W-A8YY-01 | Cervix | cervical & endocervical cancer | Female | <65 | I/II | Chemotherapy | cisplatin | CR |
| SLC2A4 | SNV | Missense_Mutation | c.484N>A | p.Glu162Lys | p.E162K | P14672 | protein_coding | deleterious(0) | probably_damaging(0.996) | TCGA-AA-3713-01 | Colorectum | colon adenocarcinoma | Male | >=65 | III/IV | Chemotherapy | 5-fluorouracil | PR | |
| SLC2A4 | SNV | Missense_Mutation | rs763227660 | c.439G>A | p.Ala147Thr | p.A147T | P14672 | protein_coding | deleterious(0.01) | benign(0.066) | TCGA-AA-3966-01 | Colorectum | colon adenocarcinoma | Female | >=65 | I/II | Unknown | Unknown | SD |
| SLC2A4 | SNV | Missense_Mutation | rs768365925 | c.737G>A | p.Arg246His | p.R246H | P14672 | protein_coding | deleterious(0.02) | benign(0.15) | TCGA-AA-A010-01 | Colorectum | colon adenocarcinoma | Female | <65 | I/II | Chemotherapy | folinic | CR |
| SLC2A4 | SNV | Missense_Mutation | rs770842692 | c.844C>T | p.Arg282Cys | p.R282C | P14672 | protein_coding | deleterious(0) | benign(0.042) | TCGA-AU-6004-01 | Colorectum | colon adenocarcinoma | Female | >=65 | I/II | Unknown | Unknown | SD |
| SLC2A4 | SNV | Missense_Mutation | c.752C>T | p.Ala251Val | p.A251V | P14672 | protein_coding | tolerated(0.66) | benign(0.017) | TCGA-CK-4951-01 | Colorectum | colon adenocarcinoma | Female | >=65 | I/II | Unknown | Unknown | PD | |
| SLC2A4 | SNV | Missense_Mutation | c.1481T>C | p.Val494Ala | p.V494A | P14672 | protein_coding | tolerated(0.87) | benign(0.001) | TCGA-CK-4951-01 | Colorectum | colon adenocarcinoma | Female | >=65 | I/II | Unknown | Unknown | PD | |
| SLC2A4 | SNV | Missense_Mutation | rs202200041 | c.709G>A | p.Glu237Lys | p.E237K | P14672 | protein_coding | deleterious(0.01) | possibly_damaging(0.49) | TCGA-CK-4952-01 | Colorectum | colon adenocarcinoma | Female | <65 | III/IV | Unknown | Unknown | SD |
| Page: 1 2 3 4 5 6 |
Top |
Related drugs of malignant transformation related genes |
| Identification of chemicals and drugs interact with genes involved in malignant transfromation |
| (DGIdb 4.0) |
| Entrez ID | Symbol | Category | Interaction Types | Drug Claim Name | Drug Name | PMIDs |
| 6517 | SLC2A4 | DRUGGABLE GENOME, TRANSPORTER, EXTERNAL SIDE OF PLASMA MEMBRANE | HYDROGEN PEROXIDE | 16713429 | ||
| 6517 | SLC2A4 | DRUGGABLE GENOME, TRANSPORTER, EXTERNAL SIDE OF PLASMA MEMBRANE | PROTEIN SYNTHESIS INHIBITOR | 9844728 | ||
| 6517 | SLC2A4 | DRUGGABLE GENOME, TRANSPORTER, EXTERNAL SIDE OF PLASMA MEMBRANE | GREEN TEA EXTRACT | 17616136 | ||
| 6517 | SLC2A4 | DRUGGABLE GENOME, TRANSPORTER, EXTERNAL SIDE OF PLASMA MEMBRANE | PENICILLAMINE | PENICILLAMINE | 17666490 | |
| 6517 | SLC2A4 | DRUGGABLE GENOME, TRANSPORTER, EXTERNAL SIDE OF PLASMA MEMBRANE | RETINOID | 12697904 | ||
| 6517 | SLC2A4 | DRUGGABLE GENOME, TRANSPORTER, EXTERNAL SIDE OF PLASMA MEMBRANE | TCDD | 7530807 | ||
| 6517 | SLC2A4 | DRUGGABLE GENOME, TRANSPORTER, EXTERNAL SIDE OF PLASMA MEMBRANE | GLUFOSFAMIDE | GLUFOSFAMIDE | ||
| 6517 | SLC2A4 | DRUGGABLE GENOME, TRANSPORTER, EXTERNAL SIDE OF PLASMA MEMBRANE | RHGH | 7762644 | ||
| 6517 | SLC2A4 | DRUGGABLE GENOME, TRANSPORTER, EXTERNAL SIDE OF PLASMA MEMBRANE | BSO | 15127200 | ||
| 6517 | SLC2A4 | DRUGGABLE GENOME, TRANSPORTER, EXTERNAL SIDE OF PLASMA MEMBRANE | HGF | 18362143 |
| Page: 1 2 3 4 5 6 7 |

Copyright 2023-Present -The University of Texas Health Science Center at Houston |